Mixing
Abstract
An overview of selected experimental results in the field of - oscillations is presented. The average results for the mixing parameters, and , exclude the no-mixing hypothesis at the level of 6.7 standard deviations. No sign of violation in the system is observed. The measurements impose constraints on the parameter space of many New Physics models.
I Introduction
Last year, 31 years after the discovery of mesons, the first evidence of a mixing phenomena in the system of neutral charm mesons has been obtained belle_kk ; babar_kpi . Following this breakthrough were several additional measurements enabling - through an averaging procedure - a quite precise determination of the parameters governing the mixing. The results presented in the paper follow from the data collected by the two B-factories experiments, Belle and BaBar, from the charm-factory experiment Cleo-c, as well as from the proton collider experiment CDF. At the B-factories the cross-section for the continuum production of pairs is around 1.3 nb, which with the integrated luminosity of KEKB amounts to produced charmed hadron pairs. At CESR, the 800 pb-1 data sample corresponds to pairs produced in a coherent state. And while at the Tevatron the experimental environment for the presented measurements is more difficult, the cross-section for neutral charm meson production with a transverse momentum larger than 5.5 GeV yields a starting data sample of ’s. The experiments thus provide a really diverse experimental environment for successful studies in charmed hadron physics.
The mixing, that is the transition of a neutral meson into its antiparticle and vice-versa, appears as a consequence of states of definite flavour (, ) being a linear superposition of the mass eigenstates (states of simple exponential time evolution, ):
| (1) |
It is governed by the lifetime of mesons, , and by the mixing parameters and . and denote the masses and widths of the mass eigenstates and , respectively. is the average decay width. The mixing rate is small. The contribution of loop diagrams, successfully describing the oscillations in other neutral meson systems, is suppressed since the system is the only neutral meson system with down-like quarks exchanged in the loop. In this short distance calculation is negligibly small due to the small SU(3) flavor symmetry breaking () and elements of Cabibbo-Kobayashi-Maskawa (CKM) matrix () shipsey . Long distance contributions to the - transition are difficult to calculate. Current theoretical estimates predict the mixing parameters falk ; bigi1 .
Violation of the asymmetry () in the charm sector is expected to be small. Since the processes with mesons involve mainly the first two generations of quarks, for which the CKM elements are almost real, the expected level of is which is below the current experimental sensitivity.
II Measurements
Several methods and selection criteria are common to the presented measurements. Tagging of the flavour of an initially produced meson is achieved by reconstruction of decays or . The charge of the characteristic low momentum pion determines the tag. The energy released in the decay,
| (2) |
has a narrow peak for the signal events and thus helps in rejecting the combinatorial background. Here, is used to denote the invariant mass of the decay products, and stands for the nominal mass of . mesons produced in decays have different decay time distribution and kinematic properties than the mesons produced in fragmentation. In order to obtain a sample of neutral mesons with uniform properties one selects mesons with momentum above the kinematic limit for meson decays (B-factories) or uses the impact parameter distribution to isolate primary charm mesons (CDF).
II.1 Decays to CP eigenstates
In the limit of negligible the mass eigenstates are also eigenstates. In decays only the mass eigenstate component of with the eigenvalue equal to the one of contributes. By measuring the lifetime of in decays to one thus determines the corresponding or . On the other hand, flavour specific final states like have a mixed symmetry. The measured value of the effective lifetime in these decays corresponds to a mixture of and . The relation between the two lifetimes can be written as bergman
| (3) |
where and are the lifetimes measured in and , respectively. denotes the eigenvalue of . The relative difference of the lifetimes is described by the parameter .
-even final states were used to measure belle_kk . Expressed in terms of the mixing parameters, reads bergman
| (4) |
with and describing the in mixing and interference between mixing and decays, respectively. In case of no and .
Simultaneous fits to decay time distributions of selected and candidates were performed with as a common free parameter. The fit is presented in Fig. 1(a)-(c). The agreement of the fit function with the data is excellent, . The final value obtained is
| (5) |
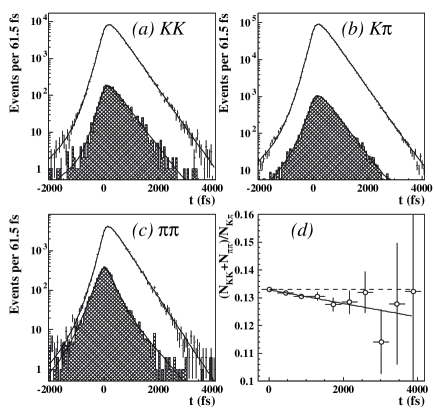
The largest systematic uncertainties arise from the assumed resolution function (common offset in individual decay modes), possible deviations of acceptance dependence on decay time from a constant (estimated by a fit to the generated distribution of reconstructed MC events) and variation of selection criteria (effect estimated using high statistics MC samples).
The resulting is more than 3 standard deviations above zero and hence represents clear evidence of mixing, regardless of possible . The difference of lifetimes is made visually observable by ploting the ratio of decay time distributions for decays to and in Fig. 1(d).
Recently the BaBar collaboration performed a similar measurement babar_kk , with results for individual lifetimes shown in Fig. 2. The obtained value of the mixing parameter is
| (6) |
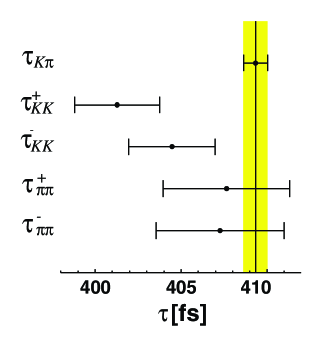
The two measurements make the most precisely measured individual mixing parameter in the system.
Final states of definite allow also a search for possible . Two methods, decay time dependent and time integrated, have been exploited. For the former, the lifetime in is measured separately for and tagged events. The asymmetry is bergman
| (7) | |||||
The values of measured by Belle belle_kk and BaBar babar_kk are
| (8) |
respectively, and show no sign of at the level of around 0.3%.
With the time integrated method one measures the asymmetry
| (9) | |||||
receives contribution from all three types of , direct, in mixing and in the interference between decays with and without the mixing. The latter two are independent of the final state. Experimentaly the measured asymmetry must be corrected for possible charge asymmetries in the detection of the slow pion as well as the forward-backward asymmetry () in the production of fermion pairs in collisions. The method of determination of correction factors was developed in babar_acp using the untagged decays. The forward-backward asymmetry is separated on the basis of its symmetry properties as a function of the meson polar angle in the center-of-mass system. Figure 3 shows the measured ((a),(b)) and ((c),(d)) as a function of the meson polar angle babar_acp .
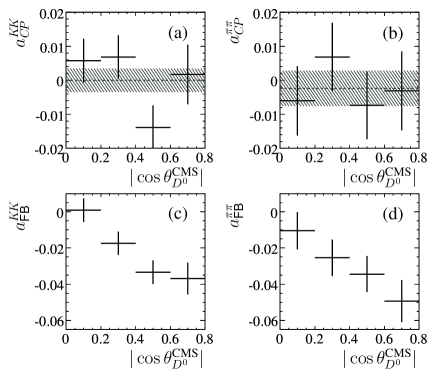
Averaging over the polar angle yields the value
| (10) |
Measurement of the Belle collaboration belle_acp
| (11) |
is also consistent with no .
II.2 Wrong-sign decays to hadronic final states
Decays of mesons to two-body hadronic final states accessible to both, and , have traditionally been used to search for the mixing. Final state can be reached through a doubly Cabibbo supressed (DCS) decay as well as through the mixing followed by a Cabibbo favoured (CF) decay. The time evolution for these decays has three terms:
| (12) |
The first one is due to DCS decays, the third one due to the mixing, and the middle term represents the interference of the two contributions. is the Cabibbo suppression factor relative to CF decays. and are the mixing parameters, rotated by a strong phase difference between DCS and CF decays, and . The dimensionless time is measured in units of .
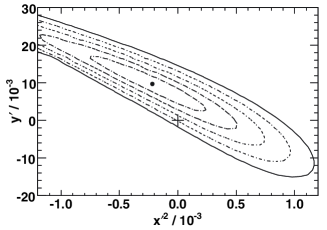
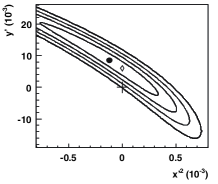
The BaBar collaboration obtained the first evidence for mixing by performing the decay time study of wrong-charge decays , to separate the DCS and the mixing contribution. The parameters obtained from the fit are presented in terms of likelihood contours in Fig. 4 (top). The central value lies slightly in the non-physical region () and the no-mixing point is excluded at the level corresponding to 3.9 standard deviations. Recently CDF collaboration obtained the result of similar significance cdf_kpi shown in Fig. 4 (bottom left). Result form the Belle collaboration belle_kpi takes into account the presence of a physical boundary and is presented in Fig. 4 (bottom right) as a 95% C.L. contour calculated using the Feldman-Cousins method.
II.3 Time dependent Dalitz analyses
Several intermediate resonances can contribute to a hadronic multi-body final state. In a specific decay channel , recently analyzed by Belle belle_kspipi , contributions from CF decays (e.g. ), DCS decays (e.g. ) and decays to eigenstates (e.g. ) are present. Individual contributions can be identified by analyzing the Dalitz distribution of the decay. Moreover, for a self-conjugated final state these different types of decays interfere and it is possible to determine their relative phases (unlike in the case of decays). Since these types of intermediate states also exhibit a specific time evolution one can determine directly the mixing parameters and by studying the time evolution of the Dalitz distribution.
The signal p.d.f. for a simultaneous fit to the Dalitz and decay-time distribution is
| (13) | |||||
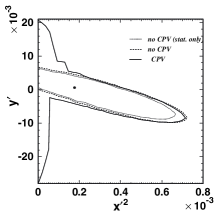
The matrix element is composed of an instantaneous amplitude for decay, , and an amplitude for the decay, , arising due to a possibility of mixing. They both depend on the Dalitz variables and . The dependence on the mixing parameters is hidden in . If is neglected the amplitude for tagged decays is . Amplitudes for decays are parametrized in the isobar model as a sum of 18 Breit-Wigner resonances and a constant non-resonant term. The result of the fit in terms of mixing parameters is presented in Fig. 5.

Numerically, the fit which allows for the results in
| (14) |
The measurement represents the most accurate determination of . The violating parameters and are consistent with no violation.
BaBar has performed the time dependent Dalitz analysis of decays babar_kpipi0 . The final state is flavour specific and hence the wrong-sign decays again receive contribution from mixing and DCS process. The combined Dalitz-decay-time signal distribution has the form
| (15) | |||||
(depending on the Dalitz variables and ) is the amplitude for decays determined from the fit to the Dalitz distribution of wrong-sign decays. The amplitude for decays, , is fixed to the values obtained in the fit to the time integrated Dalitz distribution of right-sign decays. The relative phase also depends on , and is determined from the fit to the wrong- and right-sign Dalitz distributions. Parameters and are, similar as in the case of decays, a rotated mixing parameters and , now by an unknown strong phase shift between two points in phase spaces of DCS and CF decays to .
A fit to the time evolution of the wrong-sign Dalitz distribution results in
| (16) |
II.4
Pairs of neutral mesons are produced at the threshold in a coherent state. With the Cleo-c detector one exploits this quantum coherence to determine several parameters related to the mixing. The effective branching ratios for are modified with respect to the values measured from uncorrelated meson decays. The branching fractions can be obtained by integration of the time dependence for PDG ,
| (17) | |||||
where is the time interval between two mesons decays, and amplitudes and are in the limit of no defined as , . The branching fraction for decays to the final state composed of a CP-even state () and semileptonic state (), for example, is found to be . In a similar manner other double-tagged (both and reconstructed) branching fractions depend on the parameters and cleo_c . Single-tagged (only a single final state reconstructed) branching fraction ( and in the above example) remain unchanged compared to the uncorrelated measurements.
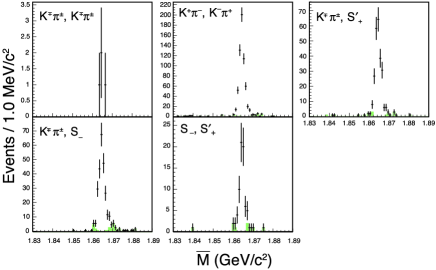
The measurements consist of determination of a set of double- and single-tagged branching ratios. Examples of reconstructed double-tagged signal yields are shown in Fig. 6.
Parameters mentioned above are obtained from a simultaneous fit to the measured single- and double-tagged branching ratios (including additional world-average information on individual branching fractions). The result is cleo_c
| (18) |
This is the only direct measurement of the strong phase difference between DCS and CF decays .
II.5 Average of results
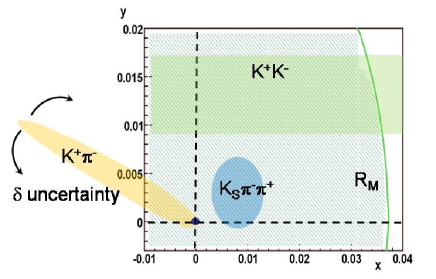
Measurements presented in the previous sections as well as others constrain the possible values of the mixing and parameters in a way specific to the decay mode under consideration. A schematic view of constraints on and posed by some of the measurements is presented in Fig. 7.
Heavy flavour averaging group hfag performs a fit to the mixing and related observables. Correlations among the measured quantities are provided by the experiments and included in the fit. The average values from the fit in which is allowed for are presented in Tab. 1.
| Parameter | Value |
|---|---|
The no-mixing scenario is excluded by the world average of results at the level corresponding to almost 7 standard deviations. Since positive values of and are preferred the almost even state of neutral mesons seems to be shorter-lived and heavier.
III Prospects and summary
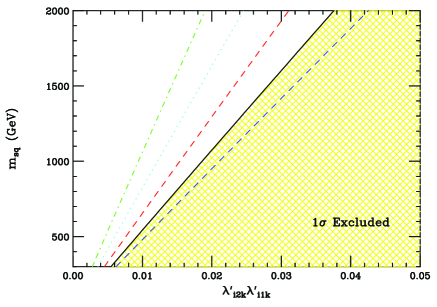
A rich harvest of results in the field of mixing, arising from a range of various experiments, only in the last two years established the oscillations of this neutral mesons with a significance of around seven standard deviations. The measured mixing parameters and of are at the upper edge of the values that can be accomodated within the SM. The results impose severe constraints on the parameter space of a wide range of New Physics models golowich . To illustrate this, Fig. 8 shows the constraints on the squark mass - coupling constants plane arising from the established value of in the supersymmetric R-parity violating models.
Several measurements focus on the search for violation in the system where a positive signal at the current level of sensitivity would represent a clear indication of New Physics processes. At the moment there is no such hint, and is in several processes found to be below the 0.3% level.
In the near future the major experimental task in the field is to measure with a higher accuracy and to further limit the range of the violation in various decay modes. Recent experimental results might trigger further theoretical efforts in the SM predictions for the mixing parameters, although at the moment more precise calculations appear to be difficult.
A more or less educated guess tells that with a modest integrated luminosity of 5 ab-1 collected by the future Super-B factory it would be possible to measure and with a precission of 0.1% - 0.15%. Furthermore, the parameters and could be measured to around , enabling tests of the asymmetries at around level.
References
- (1) M. Starič et al. (Belle Coll.), Phys. Rev. Lett. 98, 211803 (2007).
- (2) B. Aubert et al. (BaBar Coll.), Phys. Rev. Lett. 98, 211802 (2007).
- (3) G. Burdman, I. Shipsey, Ann. Rev. Nucl. Sci. 53, 431 (2003).
- (4) A.F. Falk et al., Phys. Rev. D69, 114021 (2004).
- (5) I.I. Bigi, N. Uraltsev, Nucl. Phys. B592, 92 (2001).
- (6) S. Bergmann et al., Phys. Lett. B 486, 418 (2000).
- (7) B. Aubert et al. (BaBar Coll.), Phys. Rev. D78, 011105 (2008).
- (8) B. Aubert et al. (BaBar Coll.), Phys. Rev. Lett. 100, 061803 (2008).
- (9) M. Starič et al. (Belle Coll.), arXiv:0807.0148, subm. to Phys. Lett. B.
- (10) T. Aaltonen et al. (CDF Coll.), Phys. Rev. Lett. 100, 121802 (2008).
- (11) L.M. Zhang et al. (Belle Coll.), Phys. Rev. Lett. 96, 151801 (2006).
- (12) L.M. Zhang et al. (Belle Coll.), Phys. Rev. Lett. 99, 131803 (2007).
- (13) B. Aubert et al. (BaBar Coll.), arXiv:0807.4544, subm. to Phys. Rev. Lett.
- (14) CP violation in meson decays, in C. Amsler et al., Phys. Lett. B 677, 1 (2008).
- (15) D.M. Asner et al. (Cleo Coll.), Phys. Rev. D78, 012001 (2008).
- (16) E. Barberio et al. (HFAG), arXiv:0808.1297, and updates at http://www.slac.stanford.edu/xorg/hfag/
- (17) E. Golowich et al., Phys. Rev. D76, 095009 (2007).