Convection and the Origin of Evershed Flows
Abstract
Numerical simulations have by now revealed that the fine scale structure of the penumbra in general and the Evershed effect in particular is due to overturning convection, mainly confined to gaps with strongly reduced magnetic field strength. The Evershed flow is the radial component of the overturning convective flow visible at the surface. It is directed outwards – away from the umbra – because of the broken symmetry due to the inclined magnetic field. The dark penumbral filament cores visible at high resolution are caused by the “cusps” in the magnetic field that form above the gaps.
Still remaining to be established are the details of what determines the average luminosity of penumbrae, the widths, lengths, and filling factors of penumbral filaments, and the amplitudes and filling factors of the Evershed flow. These are likely to depend at least partially also on numerical aspects such as limited resolution and model size, but mainly on physical properties that have not yet been adequately determined or calibrated, such as the plasma beta profile inside sunspots at depth and its horizontal profile, the entropy of ascending flows in the penumbra, etc.
1 Introduction
Recently – and in just the right time for the Evershed centenary – the first realistic three-dimensional radiation-magnetohydrodynamics models of sunspots and sunspot penumbrae have become available (Heinemann et al. 2007; Scharmer et al. 2008; Rempel et al. 2009). This has provided the opportunity to resolve the longstanding debate about the origin of the penumbral fine structure (Danielson 1961; Mamadazimov 1972; Schmidt et al. 1986; Solanki & Montavon 1993; Jahn & Schmidt 1994; Martens et al. 1996; Schlichenmaier et al. 1998b, a, 1999; Martínez Pillet 2000; Thomas et al. 2002; Bellot Rubio et al. 2003; Schlichenmaier & Solanki 2003; Schmidt & Fritz 2004; Borrero et al. 2004; Bellot Rubio et al. 2004; Weiss et al. 2004; Thomas & Weiss 2004; Tildesley & Weiss 2004; Borrero et al. 2005; Spruit & Scharmer 2006; Thomas et al. 2006; Scharmer & Spruit 2006; Brummell et al. 2008) by “looking the horse in the mouth”.
When combined with unavoidable requirements from basic physics, the evidence from even this first generation of numerical models is sufficient to establish the basic mechanisms at work. The models illustrate, for example, that the large luminosity of the penumbra, of the order of 75-95 % of that of the photosphere (Solanki 2003, Fig. 3.2), must be essentially due to convective heat transport, which is able to carry nearly as much heat to the solar surface in penumbrae as in the surrounding photosphere, even in the presence of the strong penumbral magnetic field.
The numerical models still have shortcomings, as discussed in more detail below. In part, the shortcomings may be due to the choice of parameters and boundary conditions for the models. Additionally, the limited numerical resolution of the models may also be important. Indeed, modelling entire sunspots is exceedingly demanding in computational resources and even the most highly resolved models (c.f. Rempel et al. 2009) have mesh spacings that are only a few times smaller than the thickness of penumbral filaments.
Since sunspots are not necessarily round one can also choose to model only a narrow strip, stretching in one direction from an umbra to a surrounding photosphere, and assumed to be periodic in the perpendicular horizontal direction (Heinemann et al. 2007; Rempel et al. 2009). Such a model may be considered to represent a piece of a sunspot with a section of more or less straight penumbra filaments. There are abundant examples of such sunspots, as well as of “umbrae-without-penumbra” and “penumbrae-without-umbrae”, and thus one should expect to see essentially the same phenomena in such models as in models of entire sunspots. The much reduced size requirement in one direction can be utilized to increase the resolution in the other two directions, with given amounts of computing resources.
As we show below the situation can also be modelled, with essential features reproduced, in even smaller patches, with accordingly higher possible spatial resolution, by making also the longer of the two horizontal directions periodic. Such models represent local rectangular patches of penumbrae, and include neither an umbra nor a piece of photosphere. The one major drawback of this type of model is that it cannot allow for the inclination of the penumbra surface. The setup does allow for an arbitrary inclination of the penumbra magnetic field, and in fact requires the inclination to be specified, at least as an initial condition. These types of models are thus ideal for exploring the parameter space spanned by magnetic field inclination and by lower boundary plasma beta and entropy, and may be used to disentangle the relative importance of each these factors, at spatial resolutions that could not be achieved in the other two types of models.
The three classes of models are complementary, in that the more localized ones can achieve higher spatial resolution, and thus can address resolution issues more effectively than global models, which on the other hand can be compared more directly with observations.
Below we briefly summarize and discuss some of the findings from the numerical models, attempt to identify reasons for remaining problems, and indicate directions for future work.
2 Recent modelling results
Heinemann et al. (2007) were the first to perform realistic numerical simulations of sunspots where one could see signs of the formation of penumbra filaments. The qualifier “realistic” is here used to indicate MHD-models that include an ionizing equation of state representative of solar conditions and radiative energy transfer with an H--like continuum opacity. Those requirements are essential for making sure that the model behavior near the optical depth unity, where the surface luminosity is determined, is at least qualitatively similar to that of the real Sun. Gray radiative transfer was used in the Pencil Code results on which the Heinemann et al. (2007) paper was based, but similar experiments using the Copenhagen Stagger Code that includes non-gray radiative energy transfer
confirm the results. The use of non-gray (binned) opacity only influences layers higher up in the atmosphere, whose behavior is not essential to understanding the penumbra fine structure (although it may be important for computing realistic synthetic spectral line diagnostics).
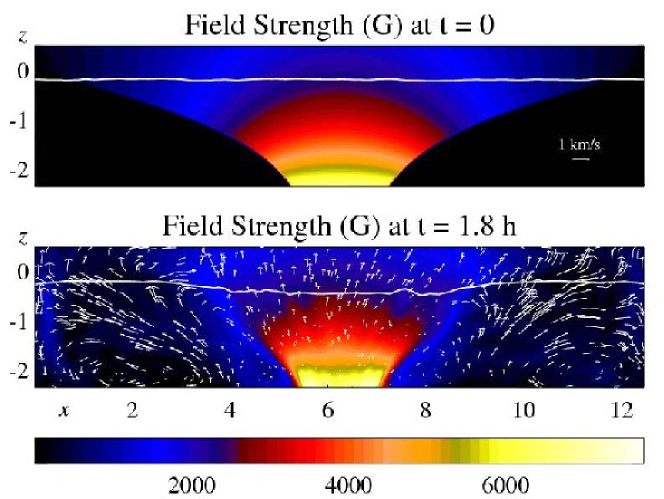
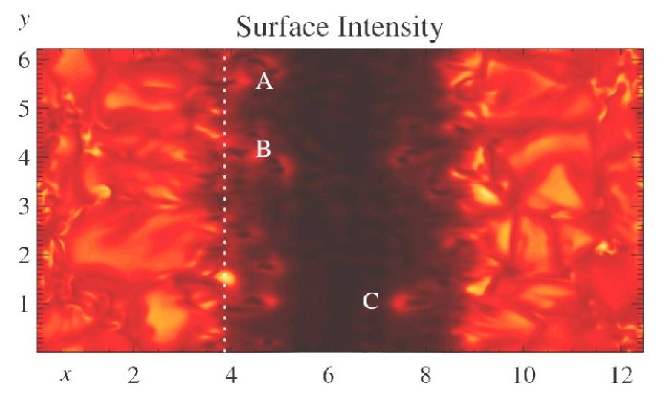
The Heinemann et al. (2007) experiments consisted of a rectangular box of size Mm, with an isotropic grid spacing of approximately 24 km; a vertical cross section is shown in Fig. 1. As users of numerical MHD-simulations are the first to realize this is by no means equivalent to having a “physical resolution” of 24 km; as a rule-of-thumb a feature resolved by less than about 10 grid points is significantly affected by numerical resolution, and hence the penumbral small scale features seen in the Heinemann et al. (2007) models are indeed only marginally resolved. One can nevertheless recognize a number of properties reminiscent of solar penumbrae and their surroundings: bright filaments with “heads” that move towards the umbra, with dark cores (cf. Fig. 2) and systematic radial outflows of several km s-1 in the penumbral filaments, and a “moat flow” carrying magnetic flux features away from the spot. Both the speeds of inward migration, the magnitude of the Evershed-like outflows, and the moat flow speeds are similar to observed values. Those agreements could in principle, given the limited spatial size and resolution of the model, be fortuitous, but could also be indications of underlying physical processes that are so robust that they start becoming established even when the numerical resolution is marginal. As illustrated by the subsequent work by Rempel et al. (2009) the latter indeed seems to be the case.
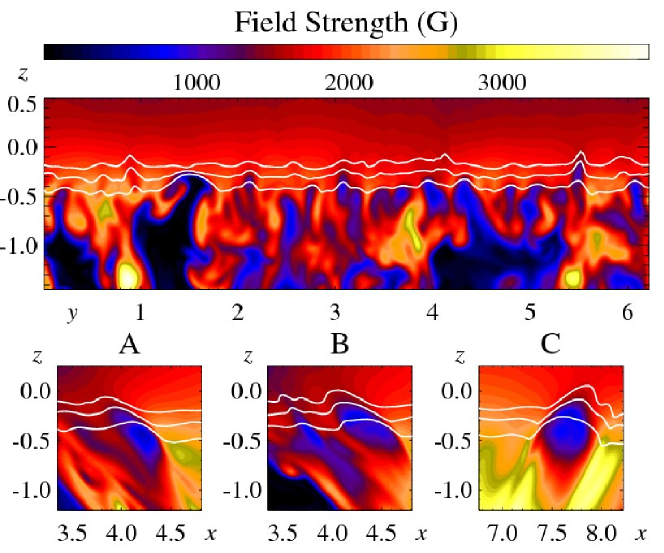
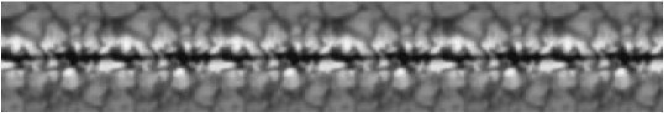
As pointed out by Heinemann et al. (2007), the filamentary features seen at the surface correspond to local convective flow channels (cf. Fig. 3), similar to the umbral dots seen in the numerical simulations be Schüssler & Vögler (2006), and in light bridge models (Nordlund 2006, cf. Fig. 4). The analogy is additional evidence of robust physical processes at work. The main difference is probably just a matter of the inclination of the magnetic field, which brakes the symmetry and forces a preferred direction onto the overturning part of the convective flow.
The basic mechanism at work is thermal convection, modified by the presence of a strong and inclined magnetic field. The luminosity of the penumbra, which visually is so clearly attributed to the densely packed penumbral filaments, must be due to convective heat transport up to the visible surface, with the penumbral filaments being the top layer manifestation of that heat transport, much as the granulation pattern in the surrounding photosphere is the surface manifestation of the even more efficient convective heat transport there.
In the penumbra the overturning and cooling of ascending hot gas is constrained to happen primarily in the radial direction; the generally radial orientation of the magnetic field strongly disfavors motions in the azimuthal direction. Since each parcel of ascending hot gas must be exposed to surface cooling for about the same time as in the granulation pattern in the surrounding photosphere, and since the velocity magnitudes are constrained by the requirement to transport nearly the same amount of energy to the surface, the trajectories of parcels of gas as they overturn at the surface must be about as long in the surrounding photosphere; i.e., paths that extend above the surface for several megameters horizontally. But since the motions are constrained to occur mainly in the radial direction there is less horizontal expansion and more “crowding” of the paths.
From these general considerations one concludes that already the energy transport requirements and the constraints imposed by the magnetic field in a natural way leads to the occurrence of bright, densely packed filaments with lengths of at least several megameters. To the extent that the models do not yet produce all of these properties (e.g., too short and non-space-filling filaments) one can then also conclude that the energy transport (and hence penumbral brightness) is likely to be too small, for which one should then seek remedies.
However, the features that are already present in the current models do perform the expected type of convective energy transport, just at a lower level of intensity, and with a smaller filling factor. One can thus already study the basic mechanisms at work, and perhaps then also conjecture about how conditions should be changed in order for the models to more close match the observed properties of solar penumbrae.
2.1 Evershed results
Scharmer et al. (2008) investigated the nature of the Evershed-like flows in the penumbral filaments seen in the Heinemann et al. (2007) models, looking in particular for explanations of the inward migration and for the outward, Evershed-like flows. They found the inward migration to be due to a pattern-motion where the “head” represents a strong convective upflow location, which is able to push aside the penumbral magnetic field, and also to push material that then quickly cools up along the inclined magnetic field lines. The cooler and heavier material results in the bending down of field lines, and allows the convective flow to overturn and return down below the surface. That process, the ascent of hot gas that cools at the surface and then descends, is – from a “heat engine” point of view – essentially the same as the convective process in normal solar granulation (cf. Stein & Nordlund 1998; Nordlund 2008).
The filaments seen in the Heinemann et al. (2007) simulations are quite short, which is perhaps not too surprising, given the limitations in size and numerical resolution. The corresponding features in the models of Rempel et al. (2009) are longer, but still rather short compared to real penumbral filaments. In both cases the filaments are also much less space-filling than in real solar penumbrae. Since the size constraints have been lifted in the Rempel et al. (2009) work the length and filling factor issues should be seen as indications that some other setup property common to both works is responsible; e.g., the limited numerical resolution. Rempel et al. (2009) also argue that the Evershed-like flow seen in their model is too weak relative to real sunspots, but this may simply be a reflection of the too small filling factor. As illustrate by Fig. 6 of their paper, the peak flow speeds in the filaments reach approx. 6 km s-1, which is certainly in the right ball park (cf. Solanki 2003).
Likely factors, which could be responsible for both the lack of space filling and the shortness of the filaments, are the basic strength and inclinations of the magnetic field in the penumbral part of the models. These properties depend on details of the boundary conditions applied at the base of the model – mainly the amplitude and profile of the plasma beta (ratio of gas to magnetic pressure) across the base of the sunspot model. Already a visual inspection of Fig. 1, and of Fig. 2 of Rempel et al. (2009) indicates that the average model magnetic fields are not sufficiently inclined, as compared to what is implied by Fig. 3.2 of Solanki (2003). Likely remedies that should be tried include decreasing the sunspot beta value at the bottom boundary, adjusting the horizontal beta profile, and/or reducing the sensitivity to boundary conditions by extending the models to larger depths. Future model results will show if any of these suggestions pans out, or if there are yet other properties of the models that need to be improved (e.g., using even higher spatial resolution, and continuing for even longer time spans, sufficient for the model to forgive and forget oversimplified initial conditions).
3 Local penumbra models
As mentioned in the introduction, one of the compromises one can choose to make to maximize the available spatial resolution is to restrict the total size of the model so much that it represents only a small piece of the penumbra. To avoid having to specify necessarily awkward radial boundary conditions one can choose periodic boundary conditions also in the radial direction.
Such models necessarily lack one seemingly central aspect of real penumbrae, in that the sloping of the penumbra surface (e.g., of optical depth unity) cannot be represented. That may also be seen as an advantage, since in the alternative, more normal set-ups, which include an umbra and a photosphere, one cannot avoid having a sloping penumbra. By using local models one can thus figure out if the sloping plane is essential for the formation of the penumbral fine structure, or if perhaps – as in the case of rectangular vs. round sunspot models – this is a side issue that is not of central importance.
The main advantage with the local models is that they allow a much larger spatial resolution. A rectangular model of a penumbral stripe such as the Heinemann et al. (2007) model needs to be at least as wide as a few granules, in order to do a reasonable job in representing the external photosphere. At the same time it needs to be at least as “long” as the diameter of a sunspot, and then some, to allow for the surrounding photosphere and to prevent neighboring periodic images of the spot from distorting the spot magnetic field too much. The Heinemann et al. (2007) model, which was Mm wide, thus represents the low end of the possible size range of these models.
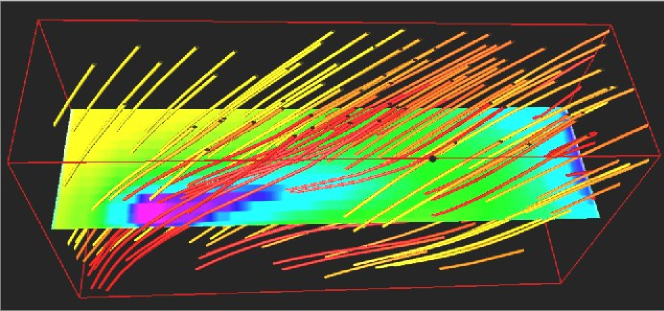
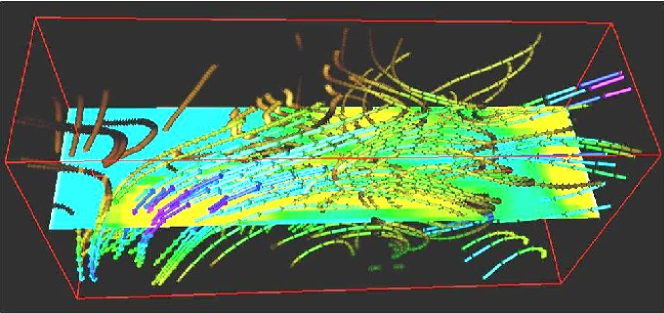
A local and doubly periodic model that covers only a patch of the penumbra, on the other hand needs only to be as wide as a few penumbral filaments (say, about 1 Mm), and long enough to contain a section of a penumbral filament (which was argued above to be of the order of the size of a granule, so a size of about 6 Mm would seem to be enough). To summarize one can use a horizontal area more than an order of magnitude smaller in local models, with a corresponding gain possible in the spatial resolution. Figure 7 shows an example of such a model, with a grid spacing of about 3 km.
The filamentary structures visible in Figure 7 display a pattern motion towards the penumbra, consistent with the behavior found in similar, but more idealized setups that have been investigated in the past (cf. Hurlburt et al. 2000). This demonstrates that pattern motions similar to those observed in the inner parts of real penumbra can occur also without a ‘sloping plane’ penumbra surface. Systematic studies of the effects of varying the strength and inclination of the magnetic field in such models will be helpful in disentangling the interplay between factors that influence the lengths, widths, and filling factors of small scale penumbral structures.
From the various results mentioned above one can draw some conclusions relevant to the debate about mechanisms (or mechanism labels!) responsible for the creation of penumbral filaments. A major label issue has for example been whether to refer to the penumbral structures as “flux tubes” or as “gaps”.
To some extent such issues become moot when detailed models become available, or at most they turn into “what-did-I-say” attempts to paste the labels onto the detailed models. It is, however, relevant to remark that the flows that occur in penumbral filaments (and this includes the Evershed flow) are flows that – at least locally – dominate over the magnetic fields. The overturning convective flows are able to push aside the magnetic field, weakening it sufficiently so it no longer prevents the flow, but allows it. In this respect the situation is more adequately labelled as characterized by magnetic “gaps”, rather than one characterized by magnetic “flux tubes”, in as much as “flux tubes” traditionally have been though of as magnetic field channels that constrain the motions of gas to be along the magnetic field in the structures, rather than flowing relatively freely into and out of them, carrying a relatively weak magnetic field along. In the penumbra, the filaments do represent structures that are “open” (at the bottom) rather than “closed”, and where the topology of the flow determines the topology of the magnetic field rather than the other way around. Of course the gaps are not entirely “field free”, but the they fulfil essentially the same function as the idealized field-free gaps originally proposed by Spruit & Scharmer (2006) and Scharmer & Spruit (2006).
With respect to the “siphon flow” type of models (Montesinos & Thomas 1989; Thomas & Montesinos 1990, 1991; Montesinos & Thomas 1993, 1997; Thomas 2005) it appears safe to conclude that they are not directly relevant for penumbral fine structure. It is possible that localized siphon flows do occur, e.g., along field lines that happen to connect locations inside the penumbra with strongly evacuated flux concentrations outside the sunspot, but these must be rare, and cannot be a significant contributing effect in the creation and maintenance of penumbral fine structure.
The idea that downward flux pumping outside the sunspot could contribute to creating and maintaining the penumbra fine structure, by “pulling down” field lines and hence helps explain the occurrence of nearly horizontal field lines in the penumbra (Thomas et al. 2002; Weiss et al. 2004) also does not work, or at least is not needed. However, inside the penumbra, pulling down of field lines by convection is certainly relevant and operative, and near the periphery of penumbrae some aspect of such a process may be relevant as well (cf. Brummell et al. 2008).
An interesting question, which can be more easily addressed with the local type of penumbra models that allow maximizing the numerical resolution, is whether and to what extent the reduction of the magnetic field strength in the gaps depends on the numerical resolution. Should one expect, for example, that the magnetic field strength inside the gaps is reduced to a larger and larger extent as the numerical resolution is increased in the models? Only future experiments can address that question quantitatively, but two fundamental aspects deserve to be mentioned already before the results of such investigations are in:
-
–
To the extent that the flows are of finite duration, and their source regions are not entirely field free (both assumptions are unavoidably satisfied in the penumbral context) there is a definitive limit to how weak the magnetic fields can get, in that even with “frozen-in” field lines the magnetic flux density is only reduced by an amount corresponding to the perpendicular expansion of the flow from the “source” point to the point of observation.
-
–
Moreover, a general conclusion from other situations with very low diffusivities is that some sort of turbulence typically develops, resulting in large scale statistics that become essentially independent of the scale at which diffusivity sets in. To the extent that this happens here one should not expect a continued dependence on the numerical resolution.
4 Conclusions and concluding remarks
In conclusion, with access to realistic three-dimensional numerical modeling of sunspots we are now in an excellent position to finally answer the intriguing questions raised by Evershed’s observations a hundred years ago (Evershed 1909a, b). Accurate and detailed matches and comparisons with observations must await the next generation of improved models, but the current set of models already allow a number of conclusions regarding the physical mechanisms at work in the penumbra:
-
–
The basic mechanism, responsible for creating the penumbra fine structure as well as the Evershed flow, is thermal convection, modified by the presence of a strong and inclined magnetic field, with the penumbral filaments being the top layer manifestation of the heat transport, analogous to the convection pattern in the surrounding photosphere.
-
–
In the penumbra the overturning and cooling of ascending hot gas is constrained to happen primarily in the radial direction, with the inclination of the magnetic field braking the symmetry and causing the overturning to happen as an outward directed mainly radial flow – this is the physical background for the Evershed flow.
-
–
The convective motions are able to force open “gaps” in the magnetic field. These gaps are of course not “field-free”, but the magnetic field strengths are reduced enough to allow the overturning convective flows to occur.
-
–
Energy transport requirements dictate that ascending hot parcels of gas spend similar intervals of time, with similar flow speeds, while cooling in the optically visible surface layers as they do in the photospheric granulation pattern. Individual sections of penumbral filaments must therefore have lengths similar to granulation scales, and there both upflows and downflows must occur, intertwined, in the penumbral filaments.
With qualitative and semi-quantitative agreement of the results of realistic numerical simulations from two independent groups (Heinemann et al. 2007; Rempel et al. 2009), and with quantitative results moving in the right direction with improvements in the numerical resolution and in the horizontal and vertical extent of the models, the results that have already been gleaned from the first generation of models are likely to hold up to future scrutiny. But it will indeed be interesting to see models improving to the point where direct, quantitative comparisons can be made between observations and synthetic diagnostic produced from the models.
The intricate correlations between magnetic field strength and inclination on the one hand and velocity, temperature, and gas density on the other hand makes it virtually impossible to uniquely “invert” even very detailed observations. Indeed, the more detailed the observations are (in the spatial, temporal, and spectral domains) the more parameters it would take to represent the physical properties of inversion type models.
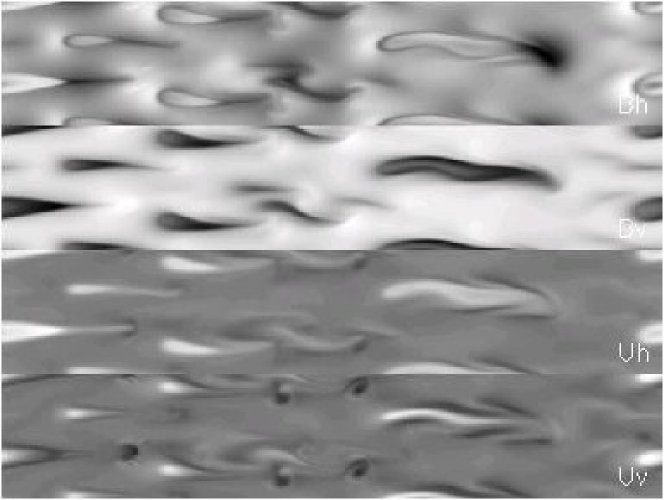
On the other hand, with access to detailed numerical models one can compute synthetic spectral lines and related diagnostics such as synthetic magnetograms and Doppler maps, and compare both their qualitative features and more quantitative “finger prints”, such as average spectral line shapes and other statistical measures. Each and every such quantitative measure represents a “collapse” of information, making it possible to compare unique signatures of the complex reality with analogous results from (necessarily always less complex) numerical models. If accurate matches are obtained one may still argue that this does not constitute formal proof of correctness of the models, but to the extent that the models adhere closely to the physical properties (equation of state, realistic radiative energy transfer, etc.) of the situation they are representing one would be hard put to argue that a good match is inconclusive.
Acknowledgements.
We thank the conference organizers for a very good meeting and the editors for excellent instructions and an amazing patience. Discussions and collaborations with Henk Spruit and Tobias Heinemann are gratefully acknowledged. The work of ÅN is supported by the Danish Natural Science Research Council. Computing resources were provided by the Danish Center for Scientific Computing.References
- Bellot Rubio et al. (2004) Bellot Rubio, L. R., Balthasar, H., Collados, M. 2004, A&A, 427, 319
- Bellot Rubio et al. (2003) Bellot Rubio, L. R., Balthasar, H., Collados, M., Schlichenmaier, R. 2003, A&A, 403, L47
- Borrero et al. (2005) Borrero, J. M., Lagg, A., Solanki, S. K., Collados, M. 2005, A&A, 436, 333
- Borrero et al. (2004) Borrero, J. M., Solanki, S. K., Bellot Rubio, L. R., Lagg, A., Mathew, S. K. 2004, A&A, 422, 1093
- Brummell et al. (2008) Brummell, N. H., Tobias, S. M., Thomas, J. H., Weiss, N. O. 2008, ApJ, 686, 1454
- Danielson (1961) Danielson, R. E. 1961, ApJ, 134, 289
- Evershed (1909a) Evershed, J. 1909a, The Observatory, 32, 291
- Evershed (1909b) Evershed, J. 1909b, MNRAS, 69, 454
- Heinemann et al. (2007) Heinemann, T., Nordlund, Å., Scharmer, G. B., Spruit, H. C. 2007, ApJ, 669, 1390
- Hurlburt et al. (2000) Hurlburt, N. E., Matthews, P. C., Rucklidge, A. M. 2000, Solar Phys., 192, 109
- Jahn & Schmidt (1994) Jahn, K., Schmidt, H. U. 1994, A&A, 290, 295
- Mamadazimov (1972) Mamadazimov, M. 1972, Solar Phys., 22, 129
- Martens et al. (1996) Martens, P. C. H., Hurlburt, N. E., Title, A. M., Acton, L. W. 1996, ApJ, 463, 372
- Martínez Pillet (2000) Martínez Pillet, V. 2000, A&A, 361, 734
- Montesinos & Thomas (1989) Montesinos, B., Thomas, J. H. 1989, ApJ, 337, 977
- Montesinos & Thomas (1993) Montesinos, B., Thomas, J. H. 1993, ApJ, 402, 314
- Montesinos & Thomas (1997) Montesinos, B., Thomas, J. H. 1997, Nat, 390, 485
- Nordlund (2006) Nordlund, Å. 2006, in Solar MHD Theory and Observations: A High Spatial Resolution Perspective, eds. J. Leibacher, R. F. Stein, & H. Uitenbroek, ASP Conf. Ser., 354, 353
- Nordlund (2008) Nordlund, Å. 2008, Physica Scripta Vol. T, 133, 014002
- Rempel et al. (2009) Rempel, M., Schüssler, M., Knölker, M. 2009, ApJ, 691, 640
- Scharmer et al. (2008) Scharmer, G. B., Nordlund, Å., Heinemann, T. 2008, ApJ, 677, L149
- Scharmer & Spruit (2006) Scharmer, G. B., Spruit, H. C. 2006, A&A, 460, 605
- Schlichenmaier et al. (1999) Schlichenmaier, R., Bruls, J. H. M. J., Schüssler, M. 1999, A&A, 349, 961
- Schlichenmaier et al. (1998a) Schlichenmaier, R., Jahn, K., Schmidt, H. U. 1998a, ApJ, 493, L121+
- Schlichenmaier et al. (1998b) Schlichenmaier, R., Jahn, K., Schmidt, H. U. 1998b, A&A, 337, 897
- Schlichenmaier & Solanki (2003) Schlichenmaier, R., Solanki, S. K. 2003, A&A, 411, 257
- Schmidt et al. (1986) Schmidt, H. U., Spruit, H. C., Weiss, N. O. 1986, A&A, 158, 351
- Schmidt & Fritz (2004) Schmidt, W., Fritz, G. 2004, A&A, 421, 735
- Schüssler & Vögler (2006) Schüssler, M., Vögler, A. 2006, ApJ, 641, L73
- Solanki (2003) Solanki, S. K. 2003, A&A Rev., 11, 153
- Solanki & Montavon (1993) Solanki, S. K., Montavon, C. A. P. 1993, A&A, 275, 283
- Spruit & Scharmer (2006) Spruit, H. C., Scharmer, G. B. 2006, A&A, 447, 343
- Stein & Nordlund (1998) Stein, R. F., Nordlund, A. 1998, ApJ, 499, 914
- Thomas (2005) Thomas, J. H. 2005, A&A, 440, L29
- Thomas & Montesinos (1990) Thomas, J. H., Montesinos, B. 1990, ApJ, 359, 550
- Thomas & Montesinos (1991) Thomas, J. H., Montesinos, B. 1991, ApJ, 375, 404
- Thomas & Weiss (2004) Thomas, J. H., Weiss, N. O. 2004, ARA&A, 42, 517
- Thomas et al. (2002) Thomas, J. H., Weiss, N. O., Tobias, S. M., Brummell, N. H. 2002, Nat, 420, 390
- Thomas et al. (2006) Thomas, J. H., Weiss, N. O., Tobias, S. M., Brummell, N. H. 2006, A&A, 452, 1089
- Tildesley & Weiss (2004) Tildesley, M. J., Weiss, N. O. 2004, MNRAS, 350, 657
- Weiss et al. (2004) Weiss, N. O., Thomas, J. H., Brummell, N. H., Tobias, S. M. 2004, ApJ, 600, 1073