A Search for Diffuse Neutral Hydrogen and H i Clouds in the NGC 2403 Group
Abstract
We have observed the NGC 2403 group of galaxies using the Robert C. Byrd Green Bank Telescope (GBT) in a search for faint, extended neutral hydrogen clouds similar to the clouds found around the M81/M82 group, which is located approximately 250 kpc from the NGC 2403 group along the same filament of galaxies. For an H i cloud with a size kpc within 50 kpc of a group galaxy, our 7 mass detection limit is 2.2 106 M⊙ for a cloud with a linewidth of 20 km s-1, over the velocity range from -890 to 1750 km s-1. At this sensitivity level we detect 3 new H i clouds in the direction of the group, as well as the known galaxies. The mean velocity of the new clouds differs from that of the group galaxies by more than 250 km s-1, but are in the range of Milky Way High Velocity Clouds (HVCs) in that direction. It is most likely that the clouds are part of the Milky Way HVC population. If H i clouds exist in the NGC 2403 group, their masses are less than 2.2 106 M⊙. We also compared our results to structures that are expected based on recent cosmological models, and found none of the predicted clouds. If NGC 2403 is surrounded by a population of dark matter halos similar to those proposed for the Milky Way in recent models, our observations imply that their H i content is less than 1% of their total mass.
1. Introduction
The neutral hydrogen in the environment of galaxies and galaxy groups is morphologically and kinematically complex. Surrounding the Milky Way are the High Velocity Clouds (HVCs), which are observed in both ionized and neutral states in large complexes including the Magellanic Stream (Putman et al. 2003), and as smaller isolated clouds, which together cover nearly 40% of the sky (Wakker & van Woerden 1997; Lockman et al. 2002). Possible analogues to the Milky Way clouds have been found around nearby galaxies including M31 (Thilker et al. 2004), M33 (Grossi et al. 2008), the M81/M82 group (Chynoweth et al. 2008), and M101 (van der Hulst & Sancisi 1988). Figure 1 shows for the mass distribution of extraplanar H i clouds around nearby galaxies.
There are many physical processess that could create HVCs and extraplanar H i clouds, most of which are likely to contribute to the overall population. Some H i clouds may be situated in dark halos – clumps of dark matter and gas that have not yet formed stars (Kravtsov et al. 2004). H i clouds may also be a product of cold-mode accretion along filaments (Kereš et al. (2005), Kereš et al. , private communication). Galaxy interactions can produce filamentary structures of gas and tidal streams like the Magellanic Stream and the tidal tails of the M81 group (Yun et al. 1993; Walter et al. 2002). Some H i clouds may be the recently accreted by-products of galaxy formation (Maller & Bullock 2004), or may trace positions of faint dwarf galaxies (Ben Bekhti et al. 2006; Begum et al. 2006). Some clouds may also arise from a “galactic fountain”, wherein hot gas created by supernovae expands thermally, cools, condenses and falls back into the galaxy (Bregman 1980). Studies of cloud properties such as mass, metallicity, morphology, and kinematics are necessary to distinguish between these possibilities within a given group. For example, to determine the relative importance of tidal interactions in generating H i clouds, it is ideal to compare the H i clouds within nearby galaxy groups that are undergoing different levels of galaxy interactions.
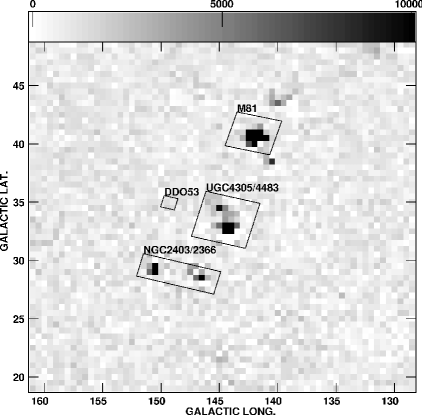
GBT observations of the highly interacting M81/M82 group revealed a population of H i clouds close to group galaxies, located along tidal streams, and kinematically bound to the group (Chynoweth et al. 2008). The H i clouds in the M81 group are most likely byproducts of ongoing galaxy interactions. The NGC 2403 galaxy group is located along the same filament of galaxies as the M81 group – the “M81 filament” (Karachentsev et al. 2002), shown in Figure 2. The NGC 2403 group contains the bright spiral galaxy NGC 2403, 3 additional large galaxies, and at least 4 dwarf or low surface brightness satellite galaxies. Table 1 lists the properties of the group. In contrast to the M81/M82 group, the NGC 2403 group is not known to be interacting at all. Although the NGC 2403 group appears mostly quiescent and undisturbed, some of the group galaxies show subtle irregularities which may be due to previous interactions between group galaxies. The largest galaxy, NGC 2403, shows a thick, lagging H i layer and a few H i filaments with anomalous velocities, which are similar to the M81/M82 clouds in mass (Fraternali et al. 2002). These features ma be analogues to Milky Way HVCs, and their origins are similarly unclear. These features have been attributed to a combination of outflow from a galactic fountain and accretion from the IGM (Fraternali & Binney 2006); both of these phenomena may be induced by interactions between group galaxies (Larson & Tinsley 1978; Sancisi et al. 2008). UGC 4305 has a cometary appearance in H i (Bureau & Carignan 2002), which may be caused by ram pressure from the intragroup medium. The dwarf galaxy DDO 53 is also kinematically irregular in H i (Begum et al. 2006). The other galaxies in the group appear to be normal. Galaxy distances and velocities are taken from Karachentsev & Kaisin (2007).
We observed the NGC 2403 group with the GBT to map its faint, extended neutral gas and to generate a census of its neutral hydrogen cloud population. A survey of the H i cloud population in this quiescent group, combined with the results from the M81/M82 group, allows us to explore the role that interactions play in the formation and evolution of extraplanar H i clouds.
In sections 2 and 3 we summarize the observations and data reduction. In section 4 we describe methods used to interpret our observations. In section 5, mass calculations for known objects in the group are presented. In section 6 we discuss the properties of the newly detected structures. Finally, in section 7 we discuss the implications of our results in light of recent models of the formation of the Milky Way.
2. Observations
We observed the NGC 2403 group with the 100m Robert C. Byrd Green Bank Telescope (GBT) of the NRAO111The National Radio Astronomy Observatory (NRAO) is a facility of the National Science Foundation operated under cooperative agreement by Associated Universities, Inc. in 9 sessions between 8 June and 1 August, 2008. We combined the 9 observing sessions into three maps: a region (“Region 1”) containing NGC 2403, NGC 2366, and DDO 44; a region (“Region 2”) containing UGC 4305, UGC 4483, and K52, with an extension to observe the region around VKN; and a region around DDO 53. Figure 2 shows a layout of the observations. Additionally, in light of the detection of a cloud at 07h36m12.1s, 67∘33``25`, we re-observed the region centered on the object for an additional 22 minutes.
The regions were observed by moving the telescope in declination and sampling every at an integration time of 3 seconds per sample. Strips of constant declination were spaced by . Corresponding maps were made by moving the telescope in right ascension to form a ‘basket weave’ pattern over the region. In the end, each pixel was integrated for approximately 6 seconds except in the region surrounding the large new cloud, where each pixel received 18 seconds.
The GBT spectrometer was used with a bandwith of 12.5 MHz, corresponding to a velocity range of -890 to 1750 km s-1. The typical system temperature for each channel of the dual-polarization receiver was 20 K.
Our observations cover a large angular area (at least 50 kpc in projection around each group galaxy) in order to make a complete study of the H i cloud population and properties across the entire extent of the group, including between major galaxies. The beam size of the GBT in the 21 cm line is , which maps to approximately 10 kpc at the distance of the NGC 2403 group; this is well matched to the expected angular size of H i clouds above our mass detection threshold (Thilker et al. 2004; Chynoweth et al. 2008).
3. Data Reduction
The GBT data were reduced in the standard manner using the GBTIDL and AIPS222Developed by the National Radio Astronomy Observatory; documentation at http://gbtidl.sourceforge.net, http://www.aoc.nrao.edu/aips data reduction packages.
In order to match our velocity resolution to the expected linewidths of H i clouds in the group, spectra were smoothed to a channel spacing of 24.4 kHz, corresponding to a velocity resolution of 5.2 km s-1. A reference spectrum for each of the 9 observation sessions was made using an observation of an emission-free region, usually from the edges of the maps. The reference spectrum was then used to perform a (signal-reference)/reference calibration of each pixel. The calibrated spectra were scaled by the system temperature, corrected for atmospheric opacity and GBT efficiency. We adopted GBT efficiency equation (1) from Langston & Turner (2007) with a zenith atmospheric opacity = 0.009. Velocities are in the kinematical LSR velocity frame.
The frequency range observed was relatively free of RFI and less than 0.3 % of all spectra were adversely affected. The spectra exhibiting RFI values were identified by tabulating the RMS noise level in channels free of neutral hydrogen emission. Spectra that showed high values of RMS noise across many channels were flagged and removed. Observations were gridded using the AIPS task SDIMG, which also averages polarizations. After amplitude calibration and gridding, a 3rd-order polynomial was fit to line-free regions of the spectra. This baseline was subtracted from the gridded spectra. The effective angular resolution, determined from maps of 3C286, is 9.15′ 0.05′. To convert to units of flux density, we observed the calibration source 3C286, whose flux density is 14.57 0.94 Jy at 1.418 GHz (Ott et al. 1994). The calibration from K to Jy was derived by mapping 3C286 in the same way that the H i maps were produced. After all corrections for the GBT efficiency and the mapping process, the scale factor from K/Beam to Jy/Beam images is 0.43 0.03. The typical RMS noise in the final data cube is 25 mK per 24.4 kHz channel. The instrumental parameters are summarized in Table 2, and Table 3 gives a summary of the observations.
4. Data Interpretation
The mapped regions have projected sizes of 122 367 kpc2 for Region 1, 245 245 kpc2 for Region 2, and 61 61 kpc2 for DDO 53. Based on previous studies, which found extraplanar clouds within 1-50 kpc from the center of a galaxy (Wakker & van Woerden 1997; Thilker et al. 2004; Chynoweth et al. 2008), we should detect all of the H i clouds around group galaxies that occupy the same phase space as the clouds around M31, the M81 group, and the Milky Way.
Previous studies have found clouds only within 150 km s-1 of the systemic velocity of associated galaxies (Thilker et al. 2004; Chynoweth et al. 2008). If these values can be interpreted as a prediction for H i cloud locations, we expect to find clouds with velocities within a few hundred km s-1 relative to the main galaxies in the group. Spectral maps were made in the entire observed velocity range, from -890 to 1750 km s-1. This extends the search more than 1000 km s-1 beyond the systemic velocity of any group galaxy. Spectral maps were visually inspected for extended emission not associated with group galaxies and possible new H i clouds. The mass detection threshold was calculated assuming that clouds would be unresolved in the GBT beam, using the formula
| (1) |
Where is the distance to the group, is the rms noise in one channel, is the channel width, and is the number of channels required for a secure detection. For our calculation, we used a H i cloud linewidth of 20 km s-1, corresponding to .
The 7 detection threshold for H i mass was 2.2 106 M⊙, adopting the NGC 2403 distance of 3.3 Mpc. With this mass detection threshold, we would be able to detect analogues to the most massive clouds around M31 and M33, the M81/M82 clouds, the M101 cloud, and large Milky Way objects such as Complexes C and H and the Magellanic Stream. These clouds are the most likely to originate in galaxy interactions and/or primordial accretion, rather than from supernovae. Figure 1 shows that if the mass spectrum of extraplanar H i clouds associated with the Milky Way and nearby galaxies is representative, we should detect 23% of the extraplanar H i cloud population in the NGC 2403 group.
The spectral line images are available on-line333The spectral line image cubes are available http://www.gb.nrao.edu/kchynowe/N2403/.
5. Masses of Known Objects
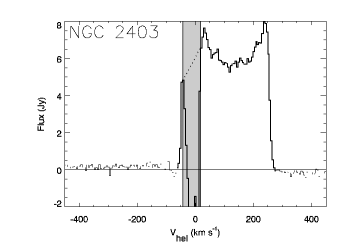
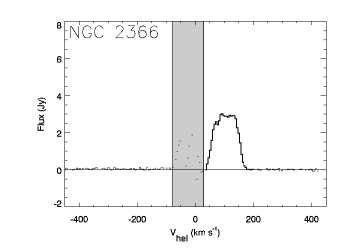
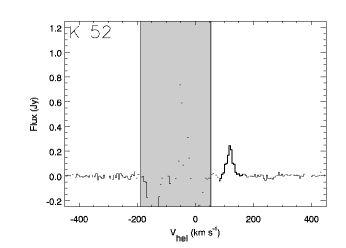
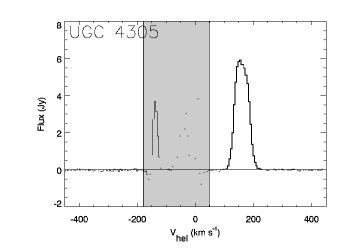
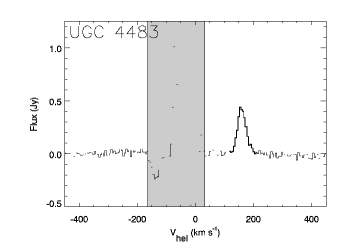
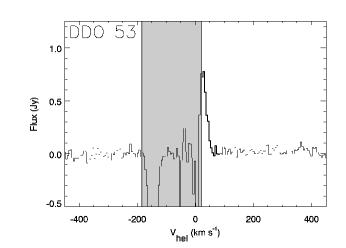
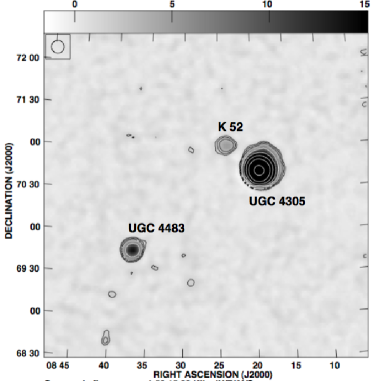
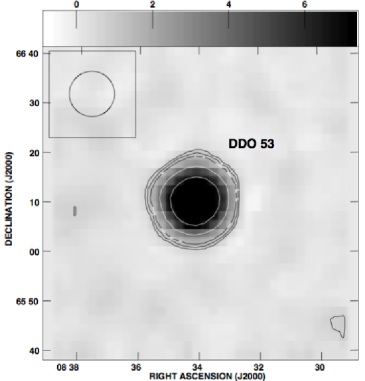
Moment maps of the H i column density are presented in Figures 5 and 5 and the H i spectra for the known galaxies are presented in Figure 3. The velocity ranges affected by foreground Milky Way emission are indicated on each plot. There is some overlap in velocity space between the NGC 2403 group and the Milky Way, and over this velocity range we can not discriminate between local and distant emission. Of the galaxies, only NGC 2403 overlaps with Milky Way velocities. To estimate the total H i mass of neutral hydrogen for NGC 2403, we replaced the velocity channels contaminated by Milky Way and local high velocity clouds with interpolated values computed from spectral line observations at either end of the contaminated channels.
Our calculated values for are in agreement with the literature; see Table 4. Error estimates on the masses are 1. The dominant error contribution is the uncertainty in the absolute calibration, about 7% for the GBT.
6. New Identifications
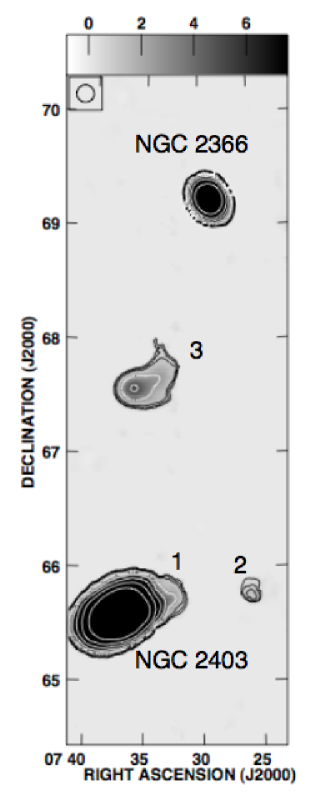
All of the galaxies in the NGC 2403 group appear undisturbed at the angular resolution of the GBT. We do not detect the filaments of H i in NGC 2403 seen in higher-resolution VLA data (Fraternali et al. 2002), most likely due to beam dilution.
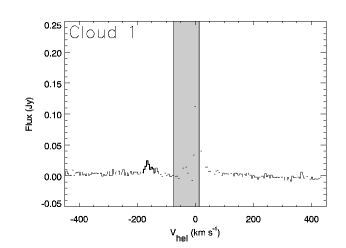
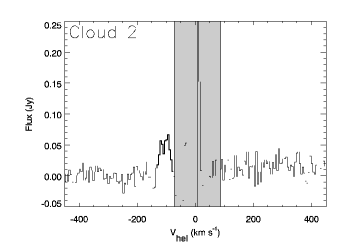
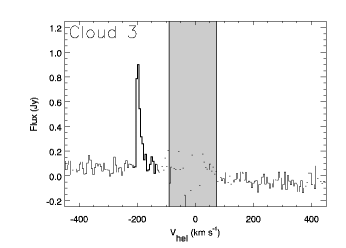
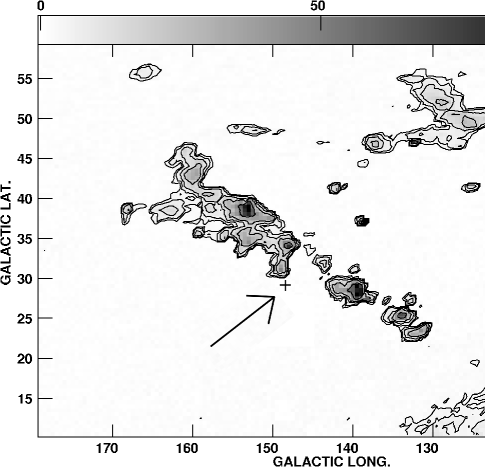
Three H i clouds are detected near NGC 2403 and NGC 2366, labeled numbers 1-3 in Figures 5 and 5. The clouds are described below, and Table 5 lists their properties. Spectra of the clouds are shown in Figure 6. It is not immediately clear whether the clouds are extragalactic or local to the Milky Way. The region mapped is just south of the Milky Way HVC Complex A (see Figure 9), so the clouds may be associated with Complex A or other Milky Way HVCs. In order to distinguish between the two possibilities, we analyzed the spectra of the clouds.
Each cloud is detected in 4-6 channels, corresponding to velocity widths of 20-30 km s-1 and consistent with both a local and an extragalactic origin (Ben Bekhti et al. 2006; Westmeier et al. 2008). If the clouds are located at the distance of NGC 2403 (3.3 Mpc), their masses are 1.5 to 51.7 106 M⊙ and their diameters range from 9-25 kpc. If, instead, the clouds are within the distance bracket for Complex A given in van Woerden et al. (1999), their masses are between 2-475 M⊙ and their diameters are between 10-75 pc. Either of these sets of numbers is plausible: the H i clouds discovered in the M81/M82 group had masses 107 M⊙ and diameters 10 kpc; likewise, Milky Way H i clouds are found with masses 60 M⊙ and sizes 10 pc (Stil et al. 2006).
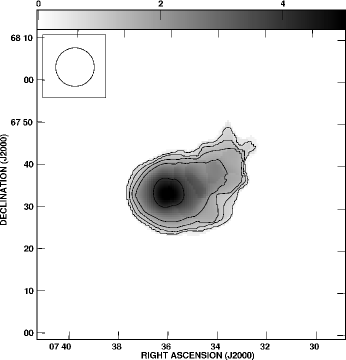
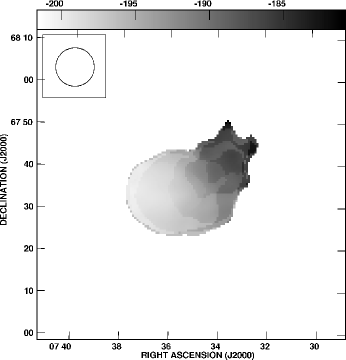
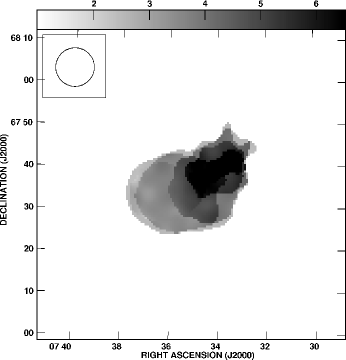
Clouds 1 and 2 are unresolved in the GBT beam. However, the structure of Cloud 3 was further analyzed. The cloud has the cometary or ‘head-tail’ structure, velocity gradient, and velocity-dispersion gradient observed in many Milky Way HVCs (Ben Bekhti et al. 2006). These features are all presented in Figure 7. This type of structure is indicative of ram pressure interaction between a moving cloud and an ambient medium, i.e. the warm gaseous halo of a galaxy (Quilis & Moore 2001). If at the distance of the NGC 2403 group, Cloud 3 is located 90 kpc from any group galaxy, and is far from the outer regions of these galaxies. It is thus likely that the cloud is part of the Milky Way, and interaction with the Milky Way halo is the source of its head-tail structure.
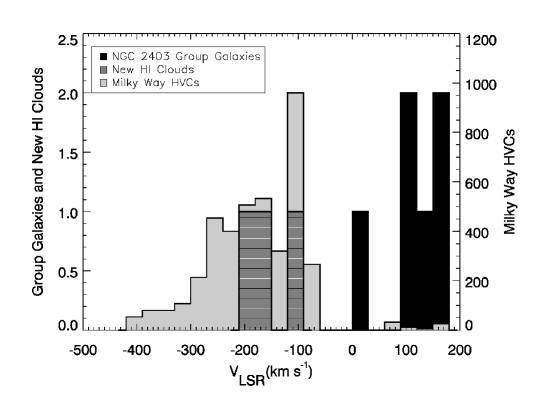
We also compared the velocity distributions of the new H i clouds, the group galaxies, and the Milky Way HVCs in the direction of the group; see Figure 8. If the new clouds are part of the NGC 2403 galaxy group, their velocity distribution ought to be consistent with that of the galaxy group (Chynoweth et al. 2008). The average cloud velocity is -142 km s-1, separated by 250 km s-1 from the NGC 2403 galaxy group average velocity of 113 km s-1. The velocity distribution of the clouds is consistent with the velocity of Milky Way HVCs in that direction (van Woerden et al. 2004). Therefore the clouds are likely to be newly discovered compact components of Complex A or other compact Milky Way HVCs rather than members of the NGC 2403 group.
7. Discussion and Conclusions
We have observed the NGC 2403 galaxy group with the GBT in order to search for faint, extended neutral hydrogen and H i clouds. We report detection of three clouds above our 7 detection threshold of 2.2 106 M⊙ for sources filling the 9 GBT beam. These clouds are separated in velocity from the galaxy group by 250 km s-1. The clouds are consistent in position with Milky Way HVC Complex A and consistent in velocity with all Milky Way HVCs in the direction of the group. We conclude that the clouds are most likely associated with the Milky Way, and that we have detected no extraplanar H i clouds associated with the NGC 2403 galaxy group. Any H i clouds in the group must be less massive than 2.2 106 M⊙, or lie farther than 50 kpc from a group galaxy.
Cosmological galaxy formation models predict a population of dark halos; clumps of dark matter and gas that have not yet formed stars. These dark halos have not been observed, but Kravtsov et al. (2004) point out that some of the missing dark halos may be the population of compact HVCs identified by Braun & Burton (1999). The existence of any HVCs associated with dark halos remains in doubt and our observations of nearby galaxy groups are designed to place strong limits on the existence of this class of object. We did not find any clouds in the NGC 2403 galaxy group with the properties expected for the missing dark halos.
These observations are significant because of the small number of clouds (none) detected with the properties expected for galaxy formation based on cold dark matter models. If H i clouds indeed form within dark halos, it would be useful to determine how many of these halos our observations should have been able to detect. Recently, Diemand et al. (2008) performed a detailed numerical model of the Milky Way formation based on cosmology, called Via Lactea II (see http://www.ucolick.org/diemand/vl/ for more details). The public release of this simulation consists of a table of resolved sub-halos, with the total masses and 3 dimensional positions and velocities. In order to connect their simulations with our observations we require an estimate of the ratio of H i mass to dark matter. Maloney & Putman (2003) have modeled the ratio of gas to dark matter at various densities and under the influence of ionizing photon flux. Their models suggest a range of neutral H i to dark matter ratios, from 0.015 to 0.0015, depending on the gas density. We assume a H i to dark matter ratio of 0.01, and compute the number of clouds that could be detected by our observations. We have taken the Via Lactea II simulation and applied our observing selection criteria of mass limits, angular region surveyed and velocity ranges searched, and computed the number of dark matter halos we would detect, if each halo has 1% of its mass in H i .
We placed their simulated components at the distance of NGC 2403 and at the same relative location as is shown in Figure 5. After applying all observing constraints, we counted the number of objects in the field. The simulation was performed with the Via Lactea II model oriented in 4 different configurations The first configuration placed the Via Lactea II simulation components at Z=3300 kpc, the distance of NGC 2403, with velocity 131 km s-1. The other three cases simply flipped the positions about the principle axes. In each configuration there were several dark matter halos that we should have detected in H i . An average of 8 components were detected in the simulation configurations, with a range between 3 and 12 components. The comparison of our observations and this simulation indicates that either the H i mass fraction of the dark matter halos is less than 0.01 relative to total matter, or the Via Lactea II simulation is not an accurate model for the distribution of mass surrounding the NGC 2403 group.
We compare the H i characteristics of the M81/M82 galaxy group, which is undergoing strong interactions between 4 large galaxies and has a population of large H i clouds and extended H i , with the NGC 2403 galaxy group, which is not known to be interacting and contains no H i clouds and no faint, extended H i . Many galaxy groups have been searched for analogues to HVCs but none have been detected (Pisano et al. 2007), except in galaxy groups with interacting members (Kern et al. 2007; Chynoweth et al. 2008).
This paper is part of a larger project to observe H i clouds in nearby galaxy groups. We plan to obtain deeper observations of the NGC 2403 group, and are currently observing an expanded area around the M81 group and 3 more galaxy groups that have varying levels of ongoing galaxy interactions. We will compare this dataset consisting of H i cloud properties including mass, linewidth, velocity, and distance from group galaxies to compare with the expected properties that result from different H i cloud formation mechanisms.
References
- Begum et al. (2006) Begum, A., Chengalur, J. N., Karachentsev, I. D., Kaisin, S. S., & Sharina, M. E. 2006, MNRAS, 365, 1220. arXiv:astro-ph/0511253
- Ben Bekhti et al. (2006) Ben Bekhti, N., Brüns, C., Kerp, J., & Westmeier, T. 2006, A&A, 457, 917. arXiv:astro-ph/0607383
- Braun & Burton (1999) Braun, R., & Burton, W. B. 1999, A&A, 341, 437. arXiv:astro-ph/9810433
- Braun & Thilker (2004) Braun, R., & Thilker, D. A. 2004, A&A, 417, 421. %****␣gbtN2403_astroph.tex␣Line␣475␣****arXiv:astro-ph/0312323
- Bregman (1980) Bregman, J. N. 1980, ApJ, 236, 577
- Bureau & Carignan (2002) Bureau, M., & Carignan, C. 2002, AJ, 123, 1316. arXiv:astro-ph/0112325
- Chynoweth et al. (2008) Chynoweth, K. M., Langston, G. I., Yun, M. S., Lockman, F. J., Rubin, K. H. R., & Scoles, S. A. 2008, AJ, 135, 1983. arXiv:0803.3631
- Diemand et al. (2008) Diemand, J., Kuhlen, M., Madau, P., Zemp, M., Moore, B., Potter, D., & Stadel, J. 2008, Nature, 454, 735. 0805.1244
- Fraternali & Binney (2006) Fraternali, F., & Binney, J. J. 2006, MNRAS, 366, 449. arXiv:astro-ph/0511334
- Fraternali et al. (2002) Fraternali, F., van Moorsel, G., Sancisi, R., & Oosterloo, T. 2002, AJ, 123, 3124. arXiv:astro-ph/0203405
- Grossi et al. (2008) Grossi, M., Giovanardi, C., Corbelli, E., Giovanelli, R., Haynes, M. P., Martin, A. M., Saintonge, A., & Dowell, J. D. 2008, A&A, 487, 161. 0806.0412
- Kalberla et al. (2005) Kalberla, P. M. W., Burton, W. B., Hartmann, D., Arnal, E. M., Bajaja, E., Morras, R., & Pöppel, W. G. L. 2005, A&A, 440, 775. arXiv:astro-ph/0504140
- Karachentsev et al. (2002) Karachentsev, I. D., Dolphin, A. E., Geisler, D., Grebel, E. K., Guhathakurta, P., Hodge, P. W., Karachentseva, V. E., Sarajedini, A., Seitzer, P., & Sharina, M. E. 2002, A&A, 383, 125
- Karachentsev & Kaisin (2007) Karachentsev, I. D., & Kaisin, S. S. 2007, AJ, 133, 1883. arXiv:astro-ph/0701465
- Kereš et al. (2005) Kereš, D., Katz, N., Weinberg, D. H., & Davé, R. 2005, MNRAS, 363, 2. arXiv:astro-ph/0407095
- Kern et al. (2007) Kern, K., Kilborn, V., Forbes, D., & Koribalski, B. 2007, ArXiv e-prints. 0711.1407
- Kravtsov et al. (2004) Kravtsov, A. V., Gnedin, O. Y., & Klypin, A. A. 2004, ApJ, 609, 482. arXiv:astro-ph/0401088
- Langston & Turner (2007) Langston, G., & Turner, B. 2007, ApJ, 658, 455
- Larson & Tinsley (1978) Larson, R. B., & Tinsley, B. M. 1978, ApJ, 219, 46
- Lockman et al. (2008) Lockman, F. J., Benjamin, R. A., Heroux, A. J., & Langston, G. I. 2008, ApJ, 679, L21. 0804.4155
- Lockman et al. (2002) Lockman, F. J., Murphy, E. M., Petty-Powell, S., & Urick, V. J. 2002, ApJS, 140, 331. arXiv:astro-ph/0201039
- Maller & Bullock (2004) Maller, A. H., & Bullock, J. S. 2004, MNRAS, 355, 694. arXiv:astro-ph/0406632
- Maloney & Putman (2003) Maloney, P. R., & Putman, M. E. 2003, ApJ, 589, 270. arXiv:astro-ph/0302040
- Ott et al. (1994) Ott, M., Witzel, A., Quirrenbach, A., Krichbaum, T. P., Standke, K. J., Schalinski, C. J., & Hummel, C. A. 1994, A&A, 284, 331
- Pisano et al. (2007) Pisano, D. J., Barnes, D. G., Gibson, B. K., Staveley-Smith, L., Freeman, K. C., & Kilborn, V. A. 2007, ApJ, 662, 959. arXiv:astro-ph/0703279
- Putman et al. (2003) Putman, M. E., Staveley-Smith, L., Freeman, K. C., Gibson, B. K., & Barnes, D. G. 2003, ApJ, 586, 170. arXiv:astro-ph/0209127
- Quilis & Moore (2001) Quilis, V., & Moore, B. 2001, ApJ, 555, L95. arXiv:astro-ph/0106253
- Sancisi et al. (2008) Sancisi, R., Fraternali, F., Oosterloo, T., & van der Hulst, T. 2008, A&A Rev., 15, 189. 0803.0109
- Simon et al. (2006) Simon, J. D., Blitz, L., Cole, A. A., Weinberg, M. D., & Cohen, M. 2006, ApJ, 640, 270. arXiv:astro-ph/0511542
- Stil et al. (2006) Stil, J. M., Lockman, F. J., Taylor, A. R., Dickey, J. M., Kavars, D. W., Martin, P. G., Rothwell, T. A., Boothroyd, A. I., & McClure-Griffiths, N. M. 2006, ApJ, 637, 366. arXiv:astro-ph/0509730
- Thilker et al. (2004) Thilker, D. A., Braun, R., Walterbos, R. A. M., Corbelli, E., Lockman, F. J., Murphy, E., & Maddalena, R. 2004, ApJ, 601, L39. arXiv:astro-ph/0311571
- Thom et al. (2006) Thom, C., Putman, M. E., Gibson, B. K., Christlieb, N., Flynn, C., Beers, T. C., Wilhelm, R., & Lee, Y. S. 2006, ApJ, 638, L97. arXiv:astro-ph/0601139
- van der Hulst & Sancisi (1988) van der Hulst, T., & Sancisi, R. 1988, AJ, 95, 1354
- van Woerden et al. (1999) van Woerden, H., Peletier, R. F., Schwarz, U. J., Wakker, B. P., & Kalberla, P. M. W. 1999, in Stromlo Workshop on High-Velocity Clouds, edited by B. K. Gibson, & M. E. Putman, vol. 166 of Astronomical Society of the Pacific Conference Series, 1
- van Woerden et al. (2004) van Woerden, H., Wakker, B. P., Schwarz, U. J., & de Boer, K. S. (eds.) 2004, High Velocity Clouds, vol. 312 of Astrophysics and Space Science Library
- Wakker & van Woerden (1997) Wakker, B. P., & van Woerden, H. 1997, ARA&A, 35, 217
- Wakker et al. (2007) Wakker, B. P., York, D. G., Howk, J. C., Barentine, J. C., Wilhelm, R., Peletier, R. F., van Woerden, H., Beers, T. C., Ivezić, Ž., Richter, P., & Schwarz, U. J. 2007, ApJ, 670, L113. arXiv:0710.3340
- Walter et al. (2002) Walter, F., Weiss, A., & Scoville, N. 2002, ApJ, 580, L21. arXiv:astro-ph/0210602
- Westmeier et al. (2008) Westmeier, T., Brüns, C., & Kerp, J. 2008, MNRAS, 390, 1691. 0808.3611
- Yun et al. (1993) Yun, M. S., Ho, P. T. P., & Lo, K. Y. 1993, ApJ, 411, L17
| Name | bbFrom Karachentsev et al. (2002) | bbFrom Karachentsev et al. (2002) | DccFrom Karachentsev & Kaisin (2007) | VhelccFrom Karachentsev & Kaisin (2007) | Type |
| (J2000) | (J2000) | Mpc | km s-1 | ||
| NGC 2403 | 07h36m52.7s | 65∘35`52`` | 3.30 | 131 | Sc |
| DDO 44 | 07h34m11.9s | 66∘52`58`` | 3.19 | … | dSph |
| NGC 2366 | 07h28m55.7s | 69∘12`59`` | 3.19 | 99 | IBm |
| UGC 4483 | 08h37m03.1s | 69∘46`44`` | 3.21 | 156 | BCD |
| UGC 4305/HoII | 08h19m06.5s | 70∘43`01`` | 3.39 | 157 | Im |
| KDG 52 | 08h23m56.2s | 71∘01`36`` | 3.55 | 113 | Irr |
| DDO 53/UGC 4459 | 08h34m08.6s | 66∘11`03`` | 3.56 | 20 | Irr |
| VKN | 08h40m11.1s | 68∘26`11`` | … | … | dSph(?) |
| Telescope: | |
|---|---|
| Diameter……………………… | 100 m |
| Beamwidth (FWHM)………………. | 9.1 ′ |
| Linear resolution …………….. | 2.7 kpc |
| Receiver: | |
| System Temperature ……………. | 20 K |
| Spectrometer: | |
| Bandwidth…………………….. | 12.5 MHz (2637.5 km s-1) |
| Resolution, Hanning Smoothed……. | 6.1 kHz (1.29 km s-1) |
| Center Frequency (MHz) | 1418.4065 |
| Bandwidth (MHz) | 12.5 |
| Channel Width (kHz) | 24.4 |
| Velocity Resolution (km s-1) | 5.2 |
| Integration time (hours): | 21 |
| Typical RMS noise (mJy) | 11 |
| Sensitivity to H i (7) | 2.2 106 M⊙ |

 |
 |
 |
 |
 |
 |
 |
 |
 |
 |
 |
 |
 |
 |
 |
| Galaxy | H i Mass | H i Mass from Karachentsev & Kaisin (2007) |
|---|---|---|
| () | ||
| NGC 2403 | 3.38 0.26 | 3.31 |
| DDO 44 | … | 0.001 |
| NGC 2366 | 0.68 0.05 | 0.71 |
| UGC 4483 | 0.04 0.005 | 0.03 |
| UGC 4305/HoII | 0.91 0.07 | 0.98 |
| K 52 | 0.02 0.004 | 0.01 |
| DDO 53/UGC 4459 | 0.05 0.004 | … |
| VKN | … | … |
| Cloud | Tpeak | Vhel | MHI ( | |||
|---|---|---|---|---|---|---|
| (J2000) | (J2000) | (K) | (km s-1) | (km s-1) | (M⊙) | |
| 1 | 07h32m36.0s | 65∘43`02`` | 0.06 | -150 | 20 | 14 |
| 2 | 07h25m28.5s | 65∘49`22`` | 0.15 | -114 | 20 | 57 |
| 3 | 07h36m12.1s | 67∘33``25` | 1.97 | -205 | 30 | 475 |