1 \publishedatdoi:10.1038/nature07266http://www.nature.com/nature/journal/v455/n7213/full/nature07266.html
Clustered star formation as a natural explanation of the H cutoff in disc galaxies
Abstract
Star formation is mainly determined by the observation of H radiation which is related to the presence of short lived massive stars. Disc galaxies show a strong cutoff in H radiation at a certain galactocentric distance which has led to the conclusion that star formation is suppressed in the outer regions of disc galaxies. This is seemingly in contradiction to recent UV observations[1] that imply disc galaxies to have star formation beyond the H cutoff and that the star-formation-surface density is linearly related to the underlying gas surface density being shallower than derived from H luminosities[2]. In a galaxy-wide formulation the clustered nature of star formation has recently led to the insight that the total galactic H luminosity is non-linearly related to the galaxy-wide star formation rate[3]. Here we show that a local formulation of the concept of clustered star formation naturally leads to a steeper radial decrease of the H surface luminosity than the star-formation-rate surface density in quantitative agreement with the observations, and that the observed H cutoff arises naturally.
Argelander-Institut für Astronomie (AIfA), Universität Bonn, 53121 Bonn, Germany
The integrated galactic initial mass function (IGIMF) describes the mass spectrum of all newly formed stars in a galaxy. The IGIMF is calculated by adding up all stars of all newly formed star clusters[4, 5] and falls off more steeply with increasing stellar masses for massive stars[5] than the canonical initial mass function (IMF) in each star cluster due to the combination of two effects: the masses of the young star clusters are distributed according to the embedded cluster mass function (ECMF), for which the upper mass limit is a function of the total star formation rate[6] (SFR), and the stellar upper mass limit of the IMF is a function of the total star cluster mass[7]. Consequently, the total fraction of massive stars and therefore the total H luminosity drops faster with decreasing SFR than the SFR[3]. The IGIMF theory has already been shown to naturally lead to the observed mass-metallicity relation of galaxies[8] and has received recent empirical verification in a study of IMF variations among galaxies[9].
In order to construct a quantitative local IGIMF-theory we introduce the local embedded cluster mass function (LECMF),
| (1) |
which defines the number of newly formed star clusters with mass per unit area at the location in a disc galaxy. Observations[10] of Galactic star forming regions show that this function is a single part power law, , with an index of . The smallest cluster mass[5], , should form at any place in the galaxy, whereas the most massive star cluster, , which can form locally is expected to depend on the local gas density, i.e. how much material is locally available for star cluster formation. Observations[6, 5] show that the most massive star cluster, , of the whole galaxy is a function of the total galactic star formation rate. To express the upper limit of the LECMF in dependence on the local gas surface density we write
| (2) |
where and are the gas density at the location and at the origin, respectively. The local mass of all star clusters between the two mass limits is determined by the local star formation rate which is described by the Kennicutt-Schmidt-law[2, 11] with being the widely accepted value[2], whereas follows from recent UV observations[1]. As UV emission is a star formation tracer that is much less sensitive to the presence of OB stars than H emission, the true exponent must be much closer to the value derived from UV observations. Thus, we chose . Interestingly, the high gas-density part of the Kennicutt-Schmidt-plot[2] based on FIR observations also has a flatter slope of and galaxy evolution models suggest not to exceed unity in order to reproduce observed radial density profiles of disc galaxies[12], confirming our choice. The mass spectrum of all newly formed stars per unit area (the local integrated galactic initial mass function, LIGIMF) is calculated by adding up all newly formed stars of all young star clusters, and the H surface density follows by adding up the H flux contributions of all newly formed stars. The newly formed stars in each young star cluster are distributed according to the invariant canonical initial mass function (IMF)[13, 14] with a fixed lower mass limit but an upper mass limit depending on the total cluster mass[7]. Young star clusters above 3000 have constant H-light-to-mass ratios whereas smaller clusters are increasingly H under-luminous[3]. With decreasing star formation rate surface density the upper mass limit of the LECMF decreases, and consequently the fraction of under-luminous star clusters increases. Thus UV and H scale differently with the star formation surface density, gas surface density or galacotentric radius, respectively. A detailed explanation how the H surface luminosity is calculated is given in the Supplementary Discussion.
The LIGIMF-theory is next applied to a sample of disc galaxies[15] with meassured gas surface densities and H surface luminosities of H ii regions averaged over annuli at different galactocentric radii. It is known that ionising photons emitted by massive stars can escape from well defined H ii regions and lead to recombinations and thus H radiation in the surrounding diffuse ionised gas (DIG)[16]. Using H emission as a star formation tracer this kind of photon leakage has to be taken into account to get an estimate of the true star formation rate. The study[16] of NGC 247 and NGC 7793 allows to construct a correction procedure in order to obtain the total H surface luminosities from the surface luminosities of H ii regions only (see Supplementary Discussion).
For a linear star-formation law () as derived from UV observations[1] the LIGIMF-theory predicts an H surface luminosity as a function of the gas surface density which is in full agreement with the observations (Fig. 1). Additionally, the radial H profile derived in the LIGIMF-theory matches the observations perfectly (Fig. 2). The concept of clustered star formation resolves the discrepancies between H and UV observations completely.
At first sight it might be objected that the LIGIMF-theory contradicts observations of the UV sources in the outer disc of galaxies: 5%–10% of all clusters in the outer discs of galaxies detected in UV have associated H emission[17]. The age estimates of the UV knots range up to 400 Myr. Clusters with H emission have ages 20 Myr as they are powered by short lived massive stars and therefore 5% of all observed UV knots are expected to have associated H emission in agreement with observations. The LIGIMF-theory predicts an overabundance of under-luminous star clusters beyond the H cutoff and a smaller number ratio of H to non-H-emitting UV knots is expected. But under-luminous does not mean no H emission. In the LIGIMF theory each young UV cluster is an H source, too, but UV and H luminosity scale differently with the cluster mass. Thus, this finding[17] is entirely consistent with the LIGIMF-theory. The observed UV knots in the outer disc of M83 are at any time systematically smaller than their counterparts in the inner disc[18] in agreement with the fundamental basics of the LIGIMF-theory. Even one outstanding massive young star cluster in the outer region of M83 does not contradict this principle but is expected from a statistical point of view (see Supplementary Discussion). Furthermore, the M83 FUV luminosity function of outer-disc stellar complexes is steeper than for the inner-disc population[18]. A similar trend is reported in NGC 628 for the H luminosity function of H ii regions[19]. In the LIGIMF-theory inner disc LECMFs have higher upper mass limits than in the outer disc LECMFs. Integration of the LECMFs over the outer regions leads to a steeper ECMF of the outer disc than the resultant ECMF of the inner disc, indicating that outer disc star formation complexes are systematically smaller than the inner disc ones. This integration effect is fundamentally the same as the IGIMF being steeper for dwarf galaxies with low global star formation rates than for disc galaxies with high star formation rates[3].
Previously, the H cutoff has been explained[15] by a drop of the local gas density below a critical density determined by the stability condition of a thin isothermal disc[20, 21] where no star formation can occur. In contradiction to this explanation recent UV observations[1] reveal star formation outside the H cutoff, and dwarf galaxies[22] show star formation although their average gas density is lower than the critical density. Indeed, it has been shown that in regions with densities lower than the critical value, star formation can be driven by other than thermal instabilities[23]. It has been argued that H ii regions powered by the same massive stars are larger in a thin environment, i.e. at large galactocentric radii, than in a dense one and thus identical H ii regions become fainter in the outer galaxy. Therefore, it has been concluded[23] that the H surface luminosity should drop faster than the star formation rate surface density. Indeed, the surface brightness of individual H ii regions should be fainter in the outer galaxy. But the H surface density considered in star formation laws refers to the total H luminosity per unit area of the galaxy and not to the cross section of the H ii region. Identically powered H ii regions contribute equally to the H surface luminosity independently of their location in a thin or a dense gas environment. Thus, the proposed solution[23] does neither explain the H cutoff nor the different slopes of the UV-based and H-based star formation laws. It has been shown recently that a required minimum column density for massive star formation might exist[24] implying star formation with no massive stars in low density environments. However, this model predicts a top-heavy IMF for cloud column densities much larger than this threshold, for which no observational evidence exists[14], and allows no quantitative linkage of H luminosity and the star formation rate. Contrary to this previously existing work, the LIGIMF theory is in excellent agreement with the observed radial H- and UV-luminosity profiles (Fig. 2) and the Kennicutt-Schmidt star formation law (Fig. 1), and also allows the determination of star formation rates even in H-faint galaxy regions.
References
- [1] Boissier, S. et al. Radial Variation of Attenuation and Star Formation in the Largest Late-Type Disks Observed with GALEX. ApJS 173, 524–537 (2007).
- [2] Kennicutt, R. C., Jr. The Global Schmidt Law in Star-forming Galaxies. ApJ 498, 541–552 (1998).
- [3] Pflamm-Altenburg, J., Weidner, C. & Kroupa, P. Converting H Luminosities into Star Formation Rates. ApJ 671, 1550–1558 (2007).
- [4] Vanbeveren, D. Theoretical evolution of massive stellar aggregates. A&A 124, 71–76 (1983).
- [5] Weidner, C. & Kroupa, P. The Variation of Integrated Star Initial Mass Functions among Galaxies. ApJ 625, 754–762 (2005).
- [6] Weidner, C., Kroupa, P. & Larsen, S. S. Implications for the formation of star clusters from extragalactic star formation rates. MNRAS 350, 1503–1510 (2004).
- [7] Weidner, C. & Kroupa, P. Evidence for a fundamental stellar upper mass limit from clustered star formation. MNRAS 348, 187–191 (2004).
- [8] Köppen, J., Weidner, C. & Kroupa, P. A possible origin of the mass-metallicity relation of galaxies. MNRAS 375, 673–684 (2007).
- [9] Hoversten, E. A. & Glazebrook, K. Evidence for a Nonuniversal Stellar Initial Mass Function from the Integrated Properties of SDSS Galaxies. ApJ 675, 163–187 (2008).
- [10] Lada, C. J. & Lada, E. A. Embedded Clusters in Molecular Clouds. ARA&A 41, 57–115 (2003).
- [11] Kennicutt, R. C., Jr. et al. Star Formation in NGC 5194 (M51a). II. The Spatially Resolved Star Formation Law. ApJ 671, 333–348 (2007).
- [12] Zasov, A. V. & Abramova, O. V. The star-formation efficiency and density of the disks of spiral galaxies. Astronomy Reports 50, 874–886 (2006).
- [13] Kroupa, P. On the variation of the initial mass function. MNRAS 322, 231–246 (2001).
- [14] Kroupa, P. The Initial Mass Function of Stars: Evidence for Uniformity in Variable Systems. Science 295, 82–91 (2002).
- [15] Kennicutt, R. C., Jr. The star formation law in galactic disks. ApJ 344, 685–703 (1989).
- [16] Ferguson, A. M. N., Wyse, R. F. G., Gallagher, J. S., III & Hunter, D. A. Diffuse Ionized Gas in Spiral Galaxies: Probing Lyman Continuum Photon Leakage From H II Regions? AJ 111, 2265–2279 (1996).
- [17] Zaritsky, D. & Christlein, D. On the Extended Knotted Disks of Galaxies. AJ 134, 135–141 (2007).
- [18] Thilker, D. A. et al. Recent Star Formation in the Extreme Outer Disk of M83. ApJ 619, L79–L82 (2005).
- [19] Lelièvre, M. & Roy, J.-R. The H II Regions of the Extreme Outer Disk of NGC 628. AJ 120, 1306–1315 (2000).
- [20] Toomre, A. On the gravitational stability of a disk of stars. ApJ 139, 1217–1238 (1964).
- [21] Cowie, L. L. Cloud fluid compression and softening in spiral arms and the formation of giant molecular cloud complexes. ApJ 245, 66–71 (1981).
- [22] Hunter, D. A., Elmegreen, B. G. & van Woerden, H. Neutral Hydrogen and Star Formation in the Irregular Galaxy NGC 2366. ApJ 556, 773–800 (2001).
- [23] Elmegreen, B. G. & Hunter, D. A. Radial Profiles of Star Formation in the Far Outer Regions of Galaxy Disks. ApJ 636, 712–720 (2006).
- [24] Krumholz, M. R. & McKee, C. F. A minimum column density of 1 g cm-2 for massive star formation. Nature 451, 1082–1084 (2008).
- [25] Kenney, J. D. P. & Young, J. S. The effects of environment on the molecular and atomic gas properties of large Virgo cluster spirals. ApJ 344, 171–199 (1989).
- [26] Wong, T. & Blitz, L. The Relationship between Gas Content and Star Formation in Molecule-rich Spiral Galaxies. ApJ 569, 157–183 (2002).
- [27] Schuster, K. F., Kramer, C., Hitschfeld, M., Garcia-Burillo, S. & Mookerjea, B. A complete 12CO 2-1 map of M 51 with HERA. I. Radial averages of CO, HI, and radio continuum. A&A 461, 143–151 (2007).
- [28] Crosthwaite, L. P. & Turner, J. L. CO(1-0), CO(2-1), and Neutral Gas in NGC 6946: Molecular Gas in a Late-Type, Gas-Rich, Spiral Galaxy. AJ 134, 1827–1842 (2007).
- [29] Kennicutt, R. C., Jr., Tamblyn, P. & Congdon, C. E. Past and future star formation in disk galaxies. ApJ 435, 22–36 (1994).
- [30] Martin, C. L. & Kennicutt, R. C., Jr. Star Formation Thresholds in Galactic Disks. ApJ 555, 301–321 (2001).
Supplementary Information is linked to the online version of the paper at www.nature.com/nature.
Acknowledgements We thank Klaas S. de Boer for stimulating discussions.
Author Information Reprints and permissions information is available at www.nature.com/reprints. Correspondence and request for materials should be addressed to J.P.-A. (jpflamm@astro.uni-bonn.de).

The H-luminosity surface density versus the total gas surface density observed for seven disc galaxies[15] averaged over annuli at different galactocentric radii is plotted (black squares) after correcting for photon leakage from H ii regions (see Supplementary Discussion). These galaxies have a mean star formation rate of SFR=6.9 yr-1 (3.2 – 16.4 yr-1)[15, 2], a mean total gas mass of (0.6 – )[15, 2] and a mean scale length of kpc (3.9 – 5.2 kpc)[25, 26, 27, 28]. These mean values define our model standard disc galaxy. For a choice of the LIGIMF-theory predicts an - relation which matches the observations excellently (solid line). Note that the underlying true star-formation density as derived from UV observations[1] is directly proportional to the gas surface density () and is shown after converting it into an H surface luminosity using the wrong linear Kennicutt H-SFR relation[2, 29] (dashed line) and shows the expected - relation based on the classical picture which is in disagreement with the observations. Furthermore, the H-luminosity surface density in the high-luminosity part ( 1032.5 erg s-1 pc-2) depends, for the correct LIGIMF-theory, on the gas surface density with a power of 1.4 (dotted line, extrapolated to low H surface luminosity) in agreement with the classical Kennicutt-Schmidt slope of . The LIGIMF-theory puts the hitherto inconsistent H and UV observations in perfect agreement with each other. Both the steeper high-luminosity slope of and the H cutoff at low gas densities are two simultaneous outcomes of the LIGIMF-theory. The thick dotted line which coincides with the thick solid curve shows a fitting function of the LIGIMF-model (see Supplementary Discussion).
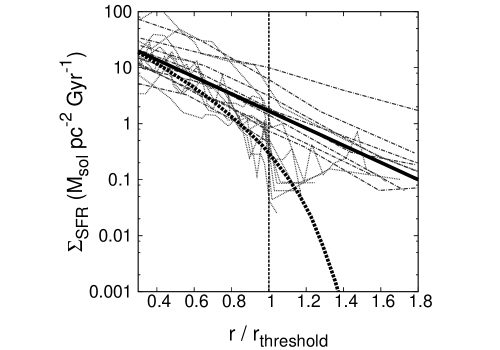
Radial distribution of the star formation surface density of nine disc galaxies based on UV[1] (thin dashed-dotted lines) and H[30] (thin dotted lines) observations that rely on a wrong linear conversion[29] between the corresponding H-luminosity surface density and star-formation-rate surface density after correction for photon leakage (see Supplementary Discussion). The galactocentric radius is in units of the H threshold radius[30]. Over-plotted is the true underlying star-formation-rate surface density of our standard disc galaxy (thick black line) as defined in Fig. 1 and the model H surface luminosity (thick dotted black line) converted into a star-formation surface density using the same linear conversion[30, 29]. The LIGIMF-theory thus naturally accounts for the discrepant value at a particular radius.
Supplementary Discussion
This Supplementary Discussion provides more information on i) how the H surface luminosity is calculated, ii) the correction for photon leakage from H ii regions, iii) the local applicability of the IGIMF theory, iv) a discussion on the sizes of typical star forming regions, v) a discussion of the presence of star clusters more massive than and vi) the fitting formula for the Kennicutt-Schmidt law in the LIGIMF-model.
i) Calculation of the H surface luminosity
In order to construct a local IGIMF theory we start with the IGIMF theory[5, 3], developed for the entire galaxy, and transfer all quantities into their corresponding local surface densities.
Thus, we first define the local embedded cluster mass function (LECMF),
| (3) |
which is the number of newly formed star clusters with mass per unit area at the location in a disc galaxy. Observations[10] of Galactic star forming regions show that the LECMF is a single part power law, , with an index of . The local mass surface density of newly formed stars is
| (4) |
where is the star-formation surface density, is the time span required to populate the cluster mass function completely[6], and M⊙ is the smallest cluster mass[5].
The observed most massive embedded star cluster in a galaxy is determined through the total star formation rate[6, 5],
| (5) |
To express the upper mass limit of the LECMF in dependence on the local gas surface density we write
| (6) |
The maximal gas-mass surface density, associated with the position of the most massive embedded star cluster, in a disc galaxy, which has a total gas mass and a single-exponential gas disc,
| (7) |
with a scale length , is determined by
| (8) |
One may raise the objection if the crude assumption of an exponential gas disc model is sufficient to construct a standard galaxy as the outer galaxy discs may also be described by other expressions as for example a power law. The key issue of the theory developed here is that the gas surface density generally tends to decrease with increasing galactocentric radius. The main aim here is not the detailed modelling of individual galaxies but to explain the characteristic discrepancies between H and UV observation and their traditional interpretations: i) a distinct star formation cutoff inferred from the H cutoff contrary to the extended radial star formation inferred from UV. ii) A steeper star-formation-law slope inferred from H (N=1.4) observations than from UV (N=1.0) observations within the H cutoff. The explanation through the present LIGIMF theory relies on the description of the gas surface density beyond the H cutoff. If the very outer gas disc is better described by for example a power law rather than by a single exponential law then this would not change the outcome of the LIGIMF theory. The radial H profiles of the disc galaxies examined in UV[1] and Fig. 2 in the main Text are from ref. 30. Figure 9 of ref. 30 shows the total gas surface densities of some of these galaxies. As this is a log-lin diagram it can easily be seen that the general trend of how the gas surface density scales with radius can be well described by an exponential law up to 2 H radii. If the aim is to construct detailed mass models of individual galaxies then an exponential law is inaccurate, but by far sufficient for our purpose here.
The star-formation surface density is described by the Kennicutt-Schmidt-law[2, 11],
| (9) |
with being the widely accepted value[2], whereas follows from UV observations[1]. As UV emission is a star formation tracer that is much less sensitive to the presence of OB stars than H emission, the true exponent must be much closer to the value derived from UV observations. Thus, we chose . Interestingly, the high gas-density part of the Kennicutt-Schmidt-plot[2] based on FIR observations also has a flatter slope of , and galaxy evolution models suggest not to exceed unity in order to reproduce observed radial density profiles of disc galaxies[12], confirming our choice.
The factor is determined by integrating Supplementary equation (9) over the whole disc,
| (10) |
In each embedded star cluster the newly formed stars are distributed according to the invariant canonical initial mass function (IMF)[13, 14] which is a two-part power law, , with indices between and , and between and , where is given by the maximum-stellar-mass–star-cluster-mass relation[7]. This relation is well defined empirically and is a result of feedback-driven star formation on a star-cluster spatial scale of few pc (Weidner, Kroupa & Goodwin, in prep.). The IMF in each star cluster, , is normalised by the total star cluster mass,
| (11) |
Finally, the local integrated galactic initial mass function (LIGIMF) can be calculated by locally adding up all stars in all newly formed star clusters,
| (12) |
The surface density of ionising photons emitted by all new stars at the position is
| (13) |
where is the total number of ionising photons[3] emitted by a star with mass in time . The H-luminosity surface density then follows from
| (14) |
ii) Photon leakage
In order to correct for the leakage of ionising radiation from H ii regions we use a comparative study[16] of the H radiation of well defined H ii regions and their embedding diffuse ionised gas (DIG). This study of the two galaxies NGC 247 and NGC 7793 shows hat the radial and azimuthal surface luminosity of the DIG is highly correlated with bright H ii regions and that the required power to sustain the DIG can only be met by the ionising radiation from massive star formation. In faint H luminosity regions the luminosity contribution of the DIG can exceed the one by distinct H ii regions. We use the published values of the H surface luminosities of H ii regions only and H ii regions plus DIG in different regions of these galaxies to construct a correction formula. Supplementary Fig. 1 shows the fraction of the H luminosity due to H ii regions of the total (H ii + DIG) H luminosity as a function of the H luminosity in H ii regions. Two interpolating functions are used to describe the resultant relation. With
| (15) |
and
| (16) |
the high luminosity region of NGC 7793 and all data points of NGC 247 can be easily interpolated (solid line) by
| (17) |
NGC 7793 alone can be interpolated (dashed line) by
| (18) |
The total surface luminosities are then given by
| (19) |
Luminosities brighter than 1032.3 erg s-1 pc-2 need no correction. The influence of photon leakage from H ii regions for the Kennicutt-Schmidt diagram of Fig. 1 is shown in Supplementary Fig. 2. The corrected values (small black squares) are obtained by applying Supplementary equation (19) on the original values (open circles). The steeper () - relation left of the H cutoff and the position of the cutoff still persist. The lines are as described in the main text. Correcting for photon leakage therefore does not affect our results in any way.
iii) Local applicability of the IGIMF theory
Recently it has been demonstrated that the concept of clustered star formation has a significant influence on the appearance of galaxies in H[3]. The galaxy-wide H luminosity scales non-linearly with the underlying total star-formation rate (SFR). As a first consequence it has been shown that a sample of the Sculptor group of dwarf irregular galaxies have much higher SFRs than previously deduced and that their SFRs scales approximately linearly with their gas mass. The sample consists only of 11 galaxies and the validity of the obtained star formation relation might be questionable. But a subsequent investigation of a sample of 205 local star forming galaxies confirms this finding and reveals a strictly linear relation between the SFR of a galaxy and its total gas mass over five orders of magnitude in mass (Pflamm-Altenburg and Kroupa, in preparation). Furthermore, the local UV-based star formation law integrated over the disc of a galaxy is in perfect agreement with global H based and IGIMF corrected star formation law. Therefore, dwarf galaxies can be described very well with the IGIMF-theory, ie. by the concept of clustered star formation. For a radius of 3 kpc of a dwarf galaxy the reference area is about 28.3 kpc2. In this context ”local” regions in a disc galaxy are annuli. E.g. an annulus between 10 and 11 kpc has an area of 66 kpc2, much larger than a dwarf galaxy for which the IGIMF theory is seemingly applicable. This means local regions in the context of disc galaxies have test areas larger than dwarf galaxies which we have mentioned to be excellently described by the IGIMF theory, i.e. by the concept of clustered star formation.
iv) Sizes of outer disc star forming regions
The basis of the LIGIMF theory is that X-UV discs result from local ”stellar IMF biases”. The H-luminosity—star-cluster-mass relation becomes non-linear[3] for cluster masses 3000 . The LIGIMF theory predicts that inner-disc star-forming complexes sample the LECMF up to higher upper star-cluster mass limits than outer-disc star-forming complexes. As UV is a star formation tracer much less sensitive to the LIGIMF-effect (i.e. the supression of OB-star numbers in low-SFR regions), the UV/H luminosity ratio in the inner disc is smaller than in the outer disc. Thus, a basic requirement of the LIGIMF theory is that star forming regions in the inner disc are typically larger or more massive than the outer disc ones. A colour-magnitude diagram of UV knots observed in M83 differentiates into outer and inner disc UV knots (Fig. 3 in ref.\citeafterrefthilker2005a). UV knots younger than 100 Myr have FUV-NUV colours (Fig. 2 in ref.\citeafterrefzaritsky2007a). It can clearly be seen that the typical young ( Myr) UV outer-disc knots of M83 have masses 1000 and the main bulk lies at 500 while the inner knots extend to much higher masses. Only these star forming clusters (20 Myr old) are of interest as only they contribute to H emission. Only one outer-disc object stands out with 104 . The presence of such a massive star cluster in the outer region is not forbidden statistically (see next Supplementary Section). Young inner-disc objects populate the CMD densely up to 5000 and have masses which are typically significantly larger than outer-disc UV knots. Outer-disc knots which are much larger than 1000 are older than 20 Myr and can not be considered in the context of the H cutoff. But at these somehwat later ages the inner-disc knots are also more massive. Summarising: at any time the typical star forming regions are less massive in the outer disc than in the inner disc. Additionally, the median FUV luminosity of the inner-disc population is 3 times greater than in the outer region[18]. And outer-disc complexes appear systematically fainter than their inner-disc counterparts[18]. Furthermore, the M83 FUV luminosity function of outer-disc stellar complexes is steeper than for the inner-disc population. A similar trend is reported[19] for the H luminosity function of H ii regions in NGC 628. This is in full agreement with the concept of a varying upper mass limit of the LECMF [equation (2)]. If a galaxy is divided into two parts, an inner and an outer part, then the LECMF of the respective part has to be integrated over the whole part of the galaxy to get the ECMF of each part separately. The inner part consists of regions where the LECMF has high local upper cluster mass limits. The outer part consists of regions where the LECMF has only low or intermediate local upper cluster mass limits. Thus, solving the surface integral over the LECMF it follows that the ECMF in the outer part is steeper than in the inner part. This is the same integration effect as for galaxies with a low SFR having steeper IGIMFs than galaxies with a high SFR[3]. The same holds for the FUV-luminosity and H ii-region luminosity function as observed. These observations are an indirect evidence that the upper mass limit of the LECMF decreases towards galactic regions with lower star formation surface densities.
Also the finding that 5%–10% of the UV knots in the extended disc of NGC 628 have associated H emission[17] is in-line with the LIGIMF theory. This ratio of H emitting sources to non-emitting sources is entirely reasonable given the age estimates of 20 Myr for H ii regions and 400 Myr for GALEX knots, i.e. 20/400 = 5 %. As explained above, an H-under-luminous star cluster is not the same as an H-non-luminous cluster. Each young UV source (20 Myr) can appear as an H source. The crucial point is that the UV and H luminosities of star clusters of mass 3000 scale differently with the star cluster mass[3]. Therefore, these observations[17] are in agreement with the LIGIMf theory.
v) Local maximum cluster mass
The presence, for example in outer-disc regions of galaxies, of outstanding star cluster masses is not forbidden, but expected. To demonstrate this we take the cluster mass probability distribution density, , between the lower, , and an upper limit, , normalised by
| (20) |
clusters are drawn from this distribution function with , , and , the mass of the most massive star cluster of this set is stored. This experiment is repeated several times. We then get a distribution of the most massive star cluster of a set of star clusters. In general, the distribution function of the -th massive star cluster of a set of star clusters can be constructed as follows: the probability that the i-th massive star cluster lies in the mass range from to is . There are possible realisations to choose the i-th massive star cluster out of . The probability that more-massive star clusters lie in the mass range from to is . There are possible realisations to choose clusters out of the remaining clusters. Finally, the probability that less-massive star clusters lie in the mass range from to is . There are possible realisations to choose clusters out of the remaining . Thus, the total distribution of the i-th massive star cluster is given by
| (21) |
For the most-massive star cluster () and a single part power law for the mass function the distribution simplifies to
| (22) |
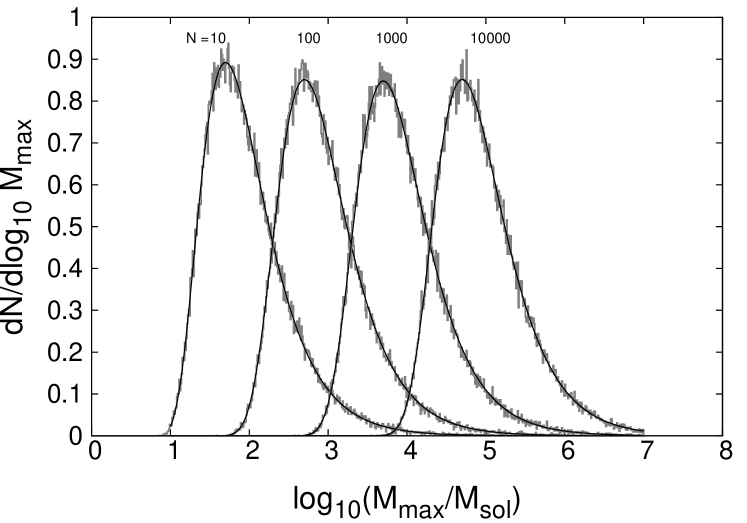
The distribution of the most-massive star cluster is plotted in Supplementary Fig. 3 for (drawing 106 times from ). Shown are the distributions obtained from Monte-Carlo simulations (grey histograms) and the analytical distributions (black curves) calculated using Supplementary equation (22). If a test area in the inner region of the galaxy with a high star formation rate is specified one would expect, for example, 1000 clusters per galactic test area and the expected most-massive star cluster and thus the upper mass limit of the LECMF in a typical inner region would be about 104 . In a test area of equal size in the outer regions were the star formation rate is lower by a factor of ten the expected number of star clusters per test area is reduced by a factor of ten, too. The expected most-massive star cluster would have a mass of slightly less than 1000 , while a 104 star cluster is unlikely but possible. Thus, from the statistical point of view, the typical star forming regions in the outer galaxies have to be of lower mass than in the inner regions with a much higher star formation rate.
vi) Fitting formula
The relation between the theoretical H surface luminosity and the gas surface density can be very well fitted (Fig. 1) by a polynomial of fifth order,
| (23) |
where
| (24) |
The coefficients are listed in Supplementary Table 1. The underlying theoretical star formation law [ in Supplementary equation (9)] is
| (25) |
By combining these two equations the LIGIMF theory allows a convenient and accurate conversion of an observed H luminosity surface density into a true star-formation-rate surface density.
Fit-coefficients
| -136.388 | |
|---|---|
| 29.3544 | |
| -2.52783 | |
| 0.108099 | |
| -2.29326e-03 | |
| 1.93394e-05 |

Ratio of the H-surface luminosity of H ii regions only and the total H-surface luminosity (H ii regions plus DIG) versus H-surface luminosity of H ii regions only, based on a comparative study[16] of the two disc galaxies NGC 7793 and NGC 247 in annuli at different galactocentric radii.

H-surface luminosity density corrected for photon leakage (small black squares) and uncorrected (open circles) versus gas surface density of the same galactic annuli.
Distribution of the most massive star cluster of a set of clusters from Monte-Carlo simulations (grey histograms) and the analytical treatment (black lines).