The Link Between SCUBA and Spitzer: Cold Galaxies at z1
Abstract
We show that the far-IR properties of distant Luminous and Ultraluminous InfraRed Galaxies (LIRGs and ULIRGs) are on average divergent from analogous sources in the local Universe. Our analysis is based on Spitzer MIPS and IRAC data of LIR1010L⊙, 70 m-selected objects in the 0.1z2 redshift range and supported by a comparison with the IRAS Bright Galaxy Sample. The majority of the objects in our sample are described by Spectral Energy Distributions (SEDs) which peak at longer wavelengths than local sources of equivalent total infrared luminosity. This shift in SED peak wavelength implies a noticeable change in the dust and/or star-forming properties from z0 to the early Universe, tending towards lower dust temperatures, indicative of strong evolution in the cold dust, ‘cirrus’, component. We show that these objects are potentially the missing link between the well-studied local IR-luminous galaxies, Spitzer IR populations and SCUBA sources — the z 1 counterparts of the cold z 1 SubMillimetre Galaxies (SMGs) discovered in blank-field submillimetre surveys. The Herschel Space Observatory is well placed to fully characterise the nature of these objects, as its coverage extends over a major part of the far-IR/submm SED for a wide redshift range.
keywords:
galaxies: general galaxies: high-redshift galaxies: starburst galaxies: photometry infrared: galaxies1 Introduction
In the past 30 years, the field of infrared astronomy has instigated immense breakthroughs in our understanding of the cosmos, at the same time driving pioneering technological advances (see review by Low, Rieke Gehrz 2007). Discovering and resolving a large part of the Cosmic InfraRed Background (CIRB) (Stanev Franceschini 1998, Gorjian, Wright Chary 1999) led to valuable insights on the nature of the sources that are responsible for more than half the cosmic electromagnetic energy density originating from star-formation and Active Galactic Nuclei (AGN). Only 1/3 of the CIRB is attributed to the local galaxies discovered in abundance by the InfraRed Astronomical Satellite (IRAS), which implies that a major part of it is composed of redshifted infrared light originating from galaxies at high redshift. Moreover, the CIRB intensity and peak wavelength suggest that the main contributors are dust-obscured populations whose bolometric energy output is dominated by emission in the infrared. As studies have repeatedly confirmed, these galaxies hide an immensely active InterStellar Medium (ISM); they are the ultimate stellar nurseries, many also hosting deeply embedded and rapidly growing AGN (e.g. Soifer et al. 1986, Sanders et al. 1987, Genzel et al. 1998, Tacconi et al. 2002).
Following these discoveries, a classification scheme was introduced based on the total infrared luminosity (LIR) in the 8–1000 m spectral region and four main classes of IR-luminous galaxies were defined: StarBursts (SBs, 1010 LIR 1011 L⊙), Luminous InfraRed Galaxies (LIRGs, 1011 LIR 1012 L⊙), UltraLuminous InfraRed Galaxies (ULIRGs, 1012 LIR 1013 L⊙) and HyperLuminous InfraRed Galaxies (HyLIRGs, LIR 1013 L⊙), e.g. Sanders Mirabel (1996), Genzel et al. (1998). This classification is non-arbitrary and a good representation of the generic characteristics of these sources, since the transition in energetic output from 1010 to 1014L⊙ is a consequence of a change in dust properties (e.g. Noll et al. 2006), star formation history (e.g. Cole et al. 2000, Brinchmann Ellis 2000), stellar mass (e.g. Bundy et al 2006), morphology (e.g. Murphy et al. 1996, Wang et al. 2006) and the role of the central black hole (e.g. Veilleux, Sanders Kim 1997, Brand et al. 2006).
With data from Spitzer, doors to the high redshift Universe were opened, both in terms of resolving the CIRB (e.g. Lagache, Puget Dole 2005, Dole et al. 2006) and accurately pinpointing the evolution of the infrared luminosity function (e.g. Le Floch’ et al. 2005, Huynh et al. 2007), as well as identifying the key processes responsible for the extreme luminosities of these galaxies (e.g. Franceschini et al. 2003). In terms of extragalactic science and specifically deep Spitzer surveys, the capabilities of MIPS have been extensively exploited in the mid-IR, enabling the nature of the 24 m population to be characterised up to z3 (e.g. Chary et al. 2004, Marleau et al. 2004, Le Floch et al. 2004; 2005, Houck et al. 2005, Dole et al. 2006, Marcilac et al. 2006). Work on the 160 m population has been limited to source count analysis (Dole et al. 2004a, Frayer et al. 2006a), whereas 70 m-selected sources have also been characterised with respect to their IR colours, mid-IR spectra and the infrared luminosity function (Dole et al. 2004a, Frayer et al. 2006a; 2006b, Huynh et al. 2007, Brand et al. 2008).
The difference in resolution and sensitivity between the three MIPS bands has not enabled a true unification of 24, 70 and 160 m populations and hence the range and types of galaxies that dominate each one. For example, all Spitzer sources detected at 70 m have 24 m counterparts, but the reverse is not true, as the sensitivity of MIPS at 24 m is up to a factor of 100 higher than at 70 m, considerably greater than the f70/f24 flux density ratio for the average IR-luminous galaxy at z1 (typically 30, Papovich et al. 2007). In addition, there is a wide range of sources with weak far-IR emission that would form part of a 24 m survey, but would not necessarily have detections in the MIPS 70 or 160 m bands, such as quiescently star-forming spirals, low redshift early-type galaxies, optically-selected quasars and obscured AGN (e.g. Yan et al. 2004, Desai et al. 2008). On the contrary, due to the lower sensitivity of MIPS at 70 m, the majority of far-IR selected objects conform to one main type and are thus defined by large amounts of dust, high IR to optical ratios and high star formation rates; they are predominantly SBs, LIRGs and ULIRGs (Symeonidis et al. 2007; 2008). This brings a high degree of homogeneity in the 70 m population, clearly benefiting any study of its evolution with redshift.
Infrared Spectral Energy Distributions (SEDs) for Spitzer selected sources have been examined with and without individual 70 and 160 m detections, the latter via 70 and 160 m stacking on the 24 m positions (Papovich et al. 2007, Zheng et al. 2007, Bavouzet et al. 2008) and the former with data from various surveys, such as the Spitzer Infrared Nearby Galaxies Survey (SINGS) (Kennicutt et al. 2003), the Spitzer Wide-area InfraRed Extragalactic survey (SWIRE) (Lonsdale 2003; 2004), the All-wavelength Extended Groth Strip Survey (AEGIS) (Davis et al. 2007), the Bootes field of the NOAO Deep Wide Field Survey (NDWFS) and the Spitzer First Look Survey (FLS) (see Dale et al. 2005, Rowan-Robinson et al. 2005, Symeonidis et al. 2007; 2008, Bavouzet et al. 2008 for work on SEDs). However, due to Spitzer’s limited sensitivity and angular resolution at the long wavelengths, the exact shape of the SED for various galaxy types has not been examined to the detail merited for the high redshift Universe. For non-local sources, the short wavelength (Wien) side of the SED peak has been mapped in the mid-IR and far-IR up to z2 and z1, respectively, whereas submm studies have examined the long wavelength (Rayleigh-Jeans) side up to z3. Although it seems that cumulative data over such a wide wavelength and redshift range would have enabled the complete characterisation of the IR SED, the different sensitivities of mid-IR, far-IR and submm surveys do not favour homogeneneous investigations and as a result, many details on the SED are missing. Moreover, these ‘bolometric’ studies do not provide detailed information on the key intragalactic environments which dominate the energy budget and as a result, fundamental questions with respect to the evolution of the properties of obscured galaxies still remain unanswered.
The natural question that follows is whether local infrared galaxies are the same, similar for the most part or instead very different to their high redshift counterparts. Here, we approach this topic by comparing the SEDs of local (z0) infrared galaxies with galaxies at z0.1, selected at 70 m, based on the preliminary results of Symeonidis et al. (2008, hereafter S08). In section 2 we define the sample and outline the various selection criteria. Sections 3 and 4 form the main body of our analysis, where we describe our methodology and results, paying particular attention to any biases that could have been introduced. In section 5 we discuss the implication of our results, making comparisons to other studies. Finally, the summary and conclusions are presented in section 6. Throughout we use a concordance model of Universe expansion, km s-1Mpc-1, and (Spergel et al. 2003).
2 Sample Selection
This work is based on Guaranteed Time Observations (GTO) using the Multiband Imaging Photometer (MIPS, Rieke et al. 2004) on the Spitzer Space Telescope (Werner et al. 2004) in the EGS field (0.5 deg2) (Davis et al. 2007) and 13H XMM-Newton/Chandra Deep Field (0.6 deg2, centred on + , Seymour et al. 2008). We select the sample at 70m and retrieve 178 objects down to 4 mJy (5) in the EGS and 244 objects down to 8 mJy (5) in 13H Field. As these two surveys cover similar areas and share a similar photometric completeness limit at f70 10 mJy, we are able to combine the data into one congruous sample, where 4 f70 290 mJy.
2.1 Source extraction and photometric coverage
For details on MIPS data reduction and source extraction, we refer the reader to Symeonidis et al. (2007) and Seymour et al. (2009), for the EGS and the 13H field respectively. Each 70 m object was matched to the brightest 24 m source within 8′′, in accordance with the MIPS PSF. Given the relative sensitivity limits ( 110Jy for 24m, 10 mJy for 70m), two sources near the 70m 5 flux density limit with no 24 m counterparts, were considered spurious and discarded. The 160 m photometry was extracted with the IRAF/DIGIPHOT package on the known positions of the 70 m sources, enabling us to go nearer the confusion limit, estimated to be on the order of 40 mJy at 160 m (e.g. Dole, Lagache Puget 2003). We used an aperture radius of 40 ′′(equivalent to the 160 m diffraction limit) and the aperture corrections specified by the MIPS team (1.884 for a 40′′radius and 40-75′′background annulus; http://ssc.spitzer.caltech.edu/mips/apercorr/). We tested our method of source extraction on the Spitzer Cosmic Evolution Survey (S-COSMOS, Frayer et al. 2009) 160m image, with the known positions of the S-COSMOS 160m sources and found our flux density estimates to be consistent, within 10 per cent (r.m.s.) of the S-COSMOS MOPEX (Makovoz Marleau 2005) estimates.
The MIPS photometry was supplemented with InfraRed Array Camera (IRAC) 8 m data to ensure a more extensive coverage of the infrared SED. The overlapping area of the 8, 24 and 160 m images adds up to about 65 per cent of the EGS 70 m survey and 54 per cent of the 13H field 70 m survey. Requiring IRAC coverage results in a subset of 114 70 m sources in the EGS and 132 in the 13H field, instead of the 178+224 described earlier.
2.2 Redshifts for the 13H field
Photometric redshifts were estimated for the 13H field, using multi-band deep optical and near-IR imaging: , , , , , , , , , , and , from various ground based observatories (CFHT, Subaru, INT and UKIRT) and 3.6, 4.5, 5.8, 8.0m from Spitzer’s IRAC. The requirement of area coverage in at least 4 optical/near-IR bands, reduced the number of available 70 m sources from 132 to 108. The cross-matching was done using the 24 m positions each 70 m source was identified with. Photometric redshifts were estimated with the HyperZ (Bolzonella et al. 2000) template fitting code, including the set of galaxy and AGN SED templates from Rowan-Robinson et al. (2008) and setting optical extinction as a free variable. All aperture magnitudes were also corrected for aperture losses. Moderate optical extinction was permitted for the AGN and late type galaxy templates, and heavy extinction (up to ) was allowed for the starburst templates. For a full description of the photomety extraction and redshift fitting process see Dwelly et al. (in prep.).
Within the final overlap area of the Spitzer MIPS/IRAC and ground-based optical/near-IR surveys, 39 good quality spectroscopic redshifts are also available, as part of an ongoing program to identify the optical counterparts of faint X-ray and radio sources in the 13H field, using various long-slit and multi-object spectrographs at the WHT, CFHT and Keck telescopes. The reliability of the photometric redshifts was checked against the spectroscopic redshifts, finding high consistency with an r.m.s. scatter in redshift of only 0.05.
Finally, as the aim of this work is to evaluate the properties of non-local 70 m selected sources, we made a redshift cut at z=0.1, rejecting the 26 low redshift resolved bright galaxies in the 13H field. The final 13H field redshift sample consists of 82 sources, 34 with spectroscopic redshifts and 48 with photometric redshifts.
2.3 Redshifts for the EGS
Spectroscopic redshifts for the EGS were acquired by the Deep Extragalactic Evolutionary Probe 2 (DEEP 2) survey (Davis et al. 2003). DEEP 2 targeted sources in the EGS with a magnitude limit of RAB = 24.1. The brightest, most extended sources were weeded out of the spectroscopic targeting algorithms, as their photometry was suspect and they could potentially saturate the detector. Thereafter, the retrieval of redshifts was random, at 60 sampling and at the time of writing there are 66 good quality redshifts available for the 114 sources in the MIPS/IRAC overlap areas. These are in the range 0.1 z 1.9, with a mean of 0.55 and a median of 0.48. The exclusion of the brightest R18 sources implies that there is an under-representation of extended, low-redshift galaxies. However, as we apply a redshift cut at z=0.1 (see section 2.2), these would have been eliminated from our final sample anyway. On the faint end, there are only 4 objects fainter than R=24.1 in the full sample, i.e. only two would have made it in the redshift sample, so overall there is high consistency between the two samples.
The limited optical photometry for the EGS 70 m objects did not allow us to calculate reliable photometric redshifts and as a result, we only use these 66 sources with spectroscopic redshifts in subsequent work. However, as outlined above, this redshift sample is a good represenation of the the z0.1 parent EGS sample.
2.4 The final 70 m sample
All 148 sources, assembled after the various area and redshift cuts described in earlier sections, are detected at 8 and 24 m. Eight sources have signal to noise 1 at 160 m and are therefore excluded from subsequent analysis. From the remaining 160 m measurements, 80 per cent are 3 detections, 62 per cent 5 and 47 per cent 7.
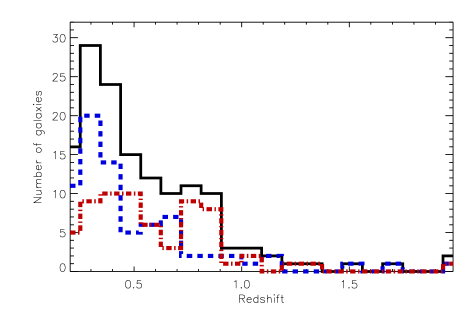
The final sample consists of 140 galaxies in the 0.1–2 redshift range (zmean 0.5, zmedian 0.42, hereafter the 70 m sample). Figure 1 shows the individual and combined redshift distributions, the differences likely arising due to sample variance.
Completeness is not a strict requirement for our analysis. However the selection criteria we apply, ensure that the 70 m sample is representative of the parent 70 m population. Nonetheless, given the strong correlation between R-band magnitude and redshift, we examine the possibility that the requirement of (optically derived) redshifts modifies the type of 70 m sources present in the final sample. We find that the redshift at which each source becomes too faint for inclusion in the 70 m sample is much lower than the redshift at which it drops out of the R-band survey. This is to be expected as the R-band limit ( 1 Jy), is 4-5 orders of magnitude lower than the 70 m flux density limit ( 10 mJy), but at the same time 95 per cent of the objects have f70/fR 5000. Under these circumstances, sources would drop out of the 70 m selection before dropping out of the optical selection, confirming that the sample of 140 sources we focus on, is representative of z0.1 70 m detected galaxies.
2.5 The local sample
In order to compare local and high redshift sources in a way that is as unbiased as possible, we evaluate our results against 259 galaxies from the IRAS revised Bright Galaxy Sample (BGS) selected at 60 m (hereafter, the local sample) by using available photometry from Sanders et al. (2003, hereafter S03). The IRAS BGS is particularly suitable for such a comparison because it includes all nearby LIRGS and ULIRGs and the 60 m selection criterion is comparable to 70 m at z0.1 where our sample begins. We do not weed out any sources which potentially have a significant AGN contribution from either the local or the 70 m sample. Apart from the fact that there is a low AGN incidence in far-IR selected samples, both populations are defined by powerful far-IR emission, hence the presence of large amounts of dust, explicitly setting star-formation to be a very a significant part of the galaxies’ energetics, if not the dominant. The IRAS BGS consists of 629 galaxies (z 0.08), the majority of which are starbursts, but with a significant LIRG population of 25 per cent and a very small fraction of ULIRGs ( 2 per cent). We only use galaxies which are not flagged as having large uncertainties in the photometry: all the available LIRGs and ULIRGs (143 and 18) and 98 randomly-selected starbursts. As our main conclusions rest on the comparison between local and high redshift LIRGs and ULIRGs and much less so on SBs, we believe it unnecessary to include all of the IRAS SBs in the local sample. Consequently, we rely on a randomly-selected subset, which is about 3-4 times the number of starbursts in the 70 m sample, to represent the BGS SBs.
3 SED fitting
The SED shape of an IR-luminous galaxy in the 5–1000 m range (rest wavelength), is dominated by emission from dust, with a range of temperatures spanning 3 orders of magnitude from 1500 K at the shortest wavelengths to 10 K at the longest. In the near-IR ( 2–5 m), light from stellar photospheres dominates the continuum, although there can be a small contribution from dust (e.g. Lu et al. 2003), subsequently becoming negligible shortward of 2 m, as the maximum grain sublimation temperature is of the order of 1500 K. The mid to far infrared part of the SED has two major contributions: emission from stochastically heated Very Small Grains (VSGs), with T 60 K, responsible for the continuum up to about 40 m and emission from large grains in thermal equilibrium, with T 50 K, responsible for emission longward of 40 m (e.g. Efstathiou Rowan-Robinson 1990; 1995, Granato Danese 1994, Silva et al. 1998, Klaas et al. 2001). Accordingly, the rest-frame SED peak, which defines the wavelength of maximum energetic output (in fν), is in the 40–140 m range and the SED is often approximated by a modified black body () of T 20–60 K and emissivity 1–2. As the bulk of the dust mass is in equilibrium, such an approximation does represent the average SED shape, however a colder, ‘cirrus’ component associated with the properties and distribution of dust in the ISM and the intensity of the diffuse radiation field is often missed. If the cold component is significant, yet ignored, the integrated energy output of the galaxy will be underestimated, but more importantly it will lead to erroneous estimates for physical quantities, such as dust mass, emissivity, opacity and temperature — e.g. see Silva et al. (1998), Granato et al. (2000) and Siebenmorgen, Krugel Laurejis (2001) where the importance of both the starburst and cirrus components is emphasized.
In this paper, we broadly categorise the sources as ‘cold’ or ‘warm’, depending on the average temperature that defines the bulk of the dust mass, which, as mentioned earlier, is mostly found to be in thermal equilibrium. As a result the average dust temperature scales with the inverse of the SED peak wavelength; a cold galaxy SED is expected to peak at longer wavelengths, whereas a warm SED will peak at shorter wavelengths. Note that this is not the same as the classical IRAS ‘warm/cold’ terminology parametrised as the mid-IR continuum slope. The IRAS ‘warm/cold’ criterion is based on the expectation that dust heated by an AGN would reach higher temperatures and hence lower the continuum slope between 25 and 60 m (or 24 and 70 m in Spitzer’s case) (e.g. Farrah et al. 2005; Verma et al. 2005, Frayer et al. 2006); it has been applied extensively in order to quantify relative AGN/starburst contributions in ULIRGs (e.g. de Grijp et al. 1985, Miley, Neugebauer Soifer 1985, Soifer et al. 1989). What we refer to as cold/warm, is not related to the mid-IR continuum slope, but solely to the far-IR properties and more specifically, the position of the SED peak.
3.1 Methodology
We fit the available IR data for the 70 m and local sample with the Siebenmorgen Krugel (2007, hereafter SK07) theoretical SED templates. In S08, we found that these models are optimum for fitting a wide range of source types, as their formulation employs a configuration of stars and dust distributed throughout the volume. In the SK07 formulation, mid-IR emission originating in dust regions enveloping OB stars is deconvolved from the cirrus emission due to the general stellar radiation field, allowing the far-IR part of the SED to be modeled as a two-temperature component; see also Klaas et al. (2001), Dunne and Eales (2001) for the benefits of a 2-temperature far-IR formulation. The SK07 library consists of 7000 templates defined by the physically acceptable combinations of the following 5 parameters: radius of dust emitting region (0.35, 1 and 3 kpc), visual extinction (AV = 2–-150), total infrared luminosity (1010–1014.7 L⊙), hot spot dust density (100-–10000 cm-3) and Lstars,OB/Lstars,tot (40, 60 and 90 per cent). Hot spot dust density refers to the density of the dust region enveloping OB stars. Lstars,OB/Lstars,tot, represents the percentage of the total infrared luminosity that originates from OB stars, compared to the contribution from the general stellar population.
We perform a fit on the photometry (8–160 m for the 70 m sample; 12–100 m for the local sample), using the entire range of SK07 templates, folding in the photometric redshift uncertainties (where applicable). For each object, we determine one interesting parameter, namely the wavelength of the SED (Lν) peak, calculated using the mean (and 1 uncertainty) of all templates with , where i is the template index and is the minimum value. In the same way we also get estimates for the total infrared luminosity (LIR, 8–1000 m) and submm flux density at 350 and 850 m.
We find that the 70 m sample consists of 30 SBs, 79 LIRGs, 29 ULIRGs and 3 HyLIRGs, indicating that down to the 10 mJy level, L1010 L⊙ sources are the sole contributors to z0.1 70 m populations.
Note that any comparison between IR galaxies at various redshifts will only be fair if each luminosity class is examined separately. As outlined in section 1, the transition in luminosity closely follows changes in the galaxies’ physical properties, star-formation history, etc., which must be reflected in all comparative evaluations, something that we maintain throughout this work.
3.2 Selection Issues
3.2.1 The SED models and fitting accuracy
We chose the SK07 models, as their theoretical formulation allows the representation of a wide range of systems, minimising assumptions on the types of sources that exist. This is in contrast to empirical sets of templates, e.g. Chary Elbaz (2001), Dale Helou (2002), which are tailored to local galaxies and could potentially predispose the results towards the types of SEDs found locally. In S08 we show that this is indeed the case and find them un-representative of the SEDs of 70 m-detected galaxies, especially in the far-IR. In contrast, we find that the SK07 models are representative of the SEDs of both the local and 70 m samples.
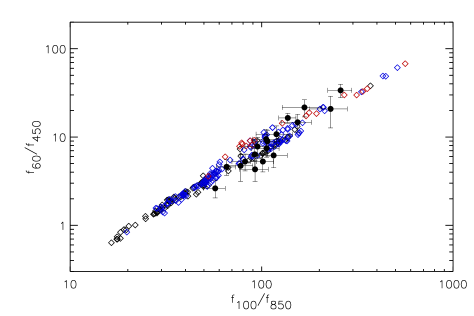
To quantify this further, we compare to submm data from Dunne et al. (2000, hereafter D00) and Dunne Eales (2001, hereafter DE01), who describe the submm properties of local galaxies in the SCUBA Local Universe Galaxy Survey (SLUGS) and report 850 and 450 m observations for a fraction of the IRAS BGS. Using the SK07 models we predict 60, 100, 450 and 850 m flux densities for the sources in the local sample and evaluate the results against the observed DE01 far-IR/submm colours (60/450 vs 100/850, figure 2). We find good agreement between our predictions and the DE01 observations, which confirms both the accuracy of our fitting method and the validity of the SK07 templates.
3.2.2 The detection limits of the 60 m IRAS survey and 70 m Spitzer survey
Selecting the sample at a wavelength shortward of the peak (the Wien side of the SED), by definition, does not predispose the selection towards cold sources, in the same way that selecting longward of the peak (the Rayleigh-Jeans side) does not predispose towards warm sources. Our 70 m selection is well into the Wien side of the SED (for z 0.2 it corresponds to 58m), so any bias would favour the selection of warmer SEDs, especially for galaxies at z 0.5. The 60 m IRAS selection probes longer wavelengths in local galaxies than the 70 m MIPS photometry for sources at z0.2, so, if anything, it should be more sensitive to relatively cold SEDs. Also, note that the 160 m photometry coincides with the IRAS 100 m band for sources at 0.4 z 1; this applies to all ULIRGs and the higher luminosity LIRGs in the 70 m sample.
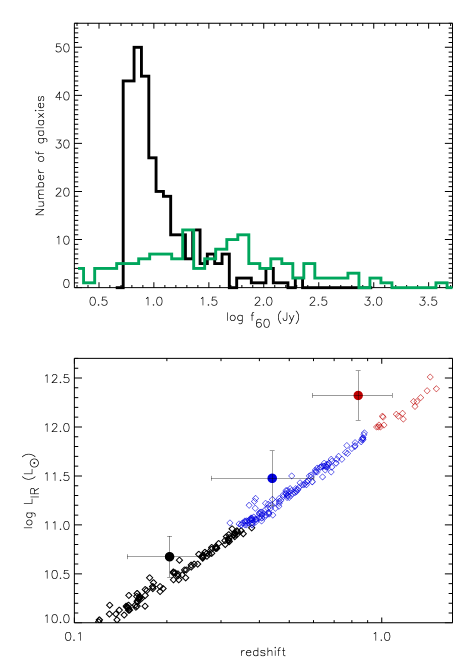
We estimate the 60 m flux density the 70 m sources would have if at the average redshift of the local sample (z 0.012, 50 Mpc) and compare with the f60 distribution for the local sample, finding considerable overlap (figure 3, top panel). It is only the lowest luminosity 70 m-detected SBs (L 51010L⊙) that would not be recovered within the IRAS 60 m flux density limit of 5.24 Jy. This is not surpising, as at 70 m we detect them at the mJy level and at low redshifts (z0.2). Using a (conservative) 70 m 10 mJy flux density limit and the SK07 templates matched to the IRAS galaxies, we calculate the maximum redshift at which each source in the local sample would still be bright enough to appear in the 70 m survey (figure 3, lower panel). As expected, the types of sources that make up the local sample are easily recoverable at f70 10 mJy. In fact, at the high luminosity end (log LIR11.5), the sources in the local sample are detectable to higher redshifts than the average redshift of the galaxies in the 70 m sample. The fact that the entire range of template matches for L 51010L⊙ sources in both samples is detectable with the flux density limits of the Spitzer/MIPS and IRAS surveys, confirms that the samples are well-matched and that our results and conclusions (sections 4 and 5) are not affected by the initial selection.
The final point to address is the dependency of the IR luminosity and position of SED peak on the absolute value of the 160 m flux density. Our detection levels are at least 5 at 70 m and typically 4–5 at 160 m, so to simulate combined uncertainties we evaluate the effects of a 30 per cent change in f160 for all objects in the 70m sample. We find that the change in luminosity does not exceed 0.2 dex and the average peak wavelength shift is less than 10 m, well within the typical uncertainty (see section 4.2). This confirms that the absolute value of f160 does not drive our estimates for and LIR.
4 Results
4.1 The 160/70m flux density ratio
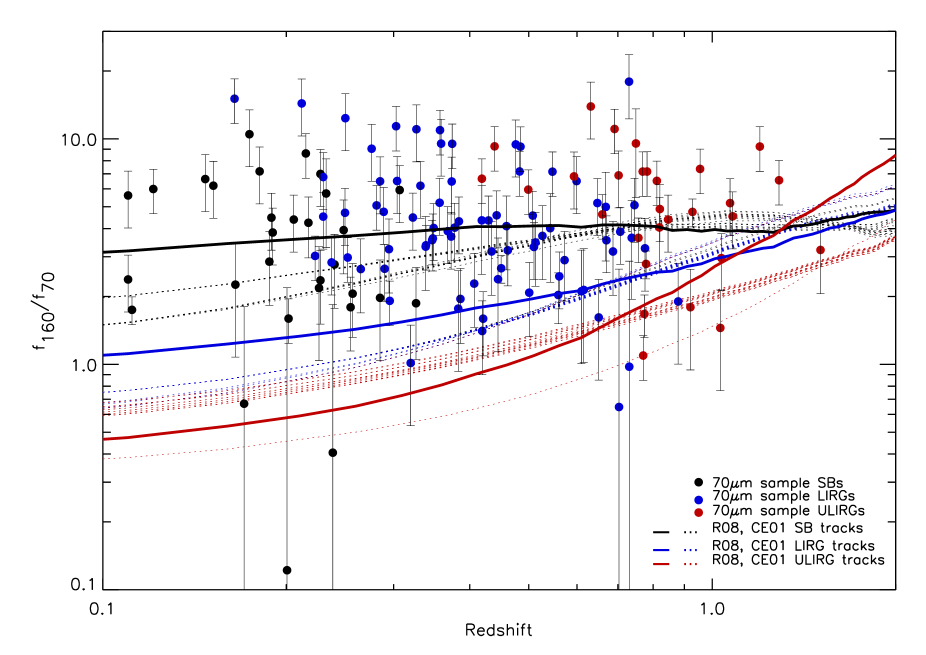
As a first approach we examine the observed f160/f70 colours of the 70 m sample as a function of redshift (figure 4), relying on SED templates to represent the IR colours of local galaxies. Accordingly, we chose the Chary Elbaz (2001, hereafter CE01) and Rieke et al. (2008, hereafter R08) empirical templates, well-representative of the average properties of local galaxies, but with some key differences in the continuum slope shortward of the peak; R08 consider their templates more accurate for high luminosity IR galaxies, such as Arp220, as they account for the steeper continuum slope seen in the spectra from the InfraRed Spectrograph (IRS) on Spitzer.
The f160/f70 ratio directly scales with the position of the peak, a relationship which is much clearer once K-corrections have been applied (see S08). Here, in order to minimise assumptions, we only compare the observed f160/f70 colour against the locally-derived tracks. However, by splitting the 70 m sample into luminosity classes we can evaluate f160/f70 more consistently and in a relatively narrow redshift range. The scatter in SB f160/f70 is in broad agreement with the local SB SEDs, with a similar number of sources lying above and below the region defined by the tracks. On the contrary, the f160/f70 for many LIRGs and ULIRGs is displaced from the local LIRG and ULIRG tracks by at least a factor of 2 and up to 10 in extreme cases. This suggests that a large fraction of these galaxies are colder than their local equivalents, as the energetic output at long wavelengths is increased relative to the short wavelengths. Overall, the f160/f70 colour does not seem to change with redshift and, although this would be mis-interpreted as a no-evolution effect, it is in fact quite the opposite. Examining the variation of f160/f70 with redshift will invariably have a luminosity and K-correction bias folded into it, as at each redshift range the survey probes galaxies at different rest-frame wavelength and of different LIR. In fact strong evolution is evident, as the high redshift LIRGs and ULIRGs have f160/f70 ratios comparable to those of local low luminosity starbursts as opposed to local LIRGs and ULIRGs.
4.2 The SED peak
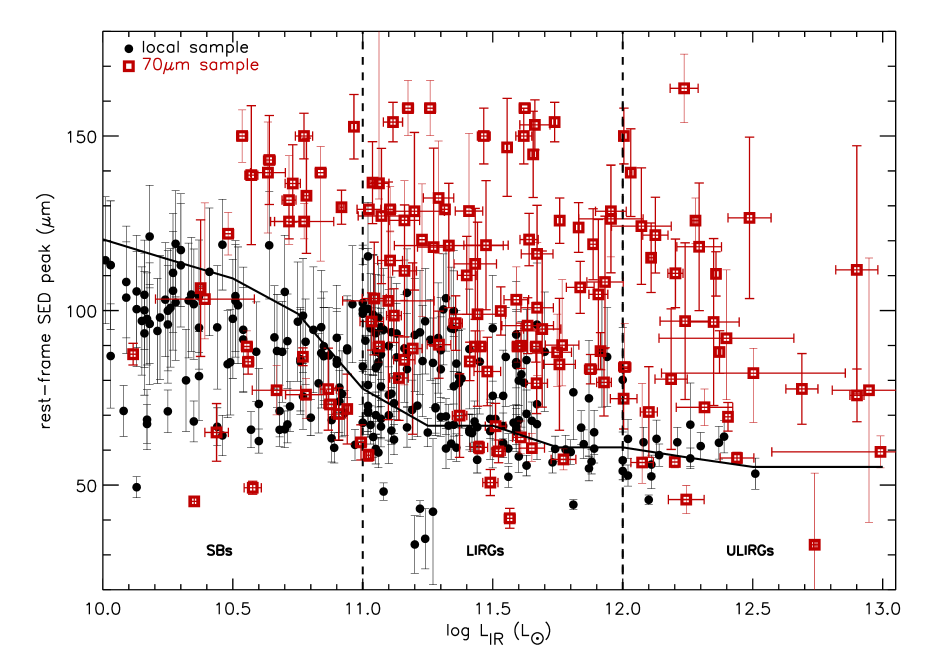
In figure 5, the variation of SED peak (rest-frame wavelength) is plotted against total infrared luminosity for the local and 70 m sample. Broadly speaking, the peak represents an average temperature for the bulk of the dust. In the nearby Universe, more luminous galaxies are characterised by emission from dust at higher temperatures which shifts the SED peak to shorter wavelengths, explicitly shown in the SED peak–LIR relationship of the local sample; see also Sanders Mirabel (1996) and the peak-LIR variation in the R08 SED templates, overplotted for comparison.
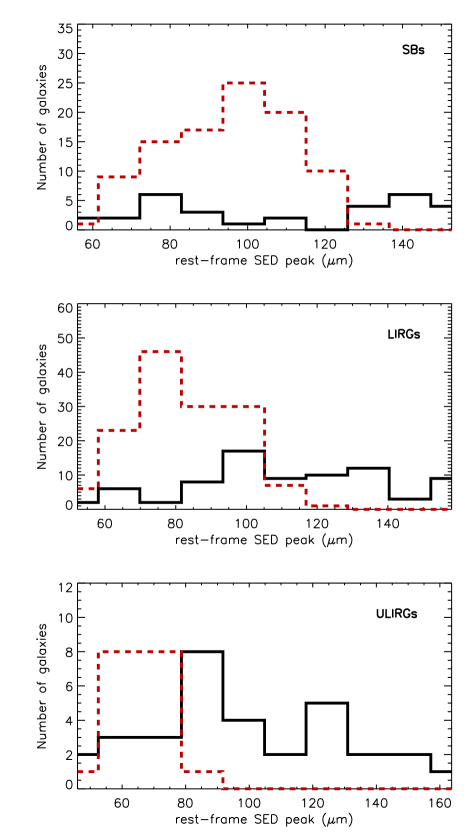
The local and high redshift sources, especially objects that fall in the LIRG and ULIRG luminosity class, occupy almost distinct regions of this plot, signifying that for a given LIR, high redshift galaxies have on average colder SEDs that peak at longer wavelengths. Since the SED peak seems to evolve from the local to the high redshift Universe, we might also expect it to evolve with redshift within the 70 m sample, i.e. from z0.1 to 2. However, we are unable to examine this because, as mentioned earlier, the LIR-z plane is not sufficiently sampled. Under the circumstances, we rely on the more unbiased comparison between local and high redshift sources by examining the distribution in peak wavelength separately for the 3 luminosity classes — figure 6. SBs in both samples seem to be broadly consistent, as the SB population in the 70m sample is at quite a low mean redshift (z0.2) and cosmic evolution in the z0 to z0.2 interval is not expected to be prominent. However, there are a few exceptions, with some 70 m-selected SBs being colder than local equivalents, but since these sources are at low redshifts, this could be a selection effect due to the much deeper MIPS survey. As described in section 3.2.2, this argument does not apply to the higher redshift, higher luminosity sources and hence any differences in the types of objects picked up by the two surveys will be solely due to evolution.
Figures 5 and 6 show that, although there is some overlap in the types of objects selected in the two surveys, it seems that the SEDs of a substantial number of high redshift LIRGs and ULIRGs peak at longer wavelengths than their local counterparts. Such a hypothesis was proposed in S08, where fitting locally-derived SED templates underestimated the far-IR emission of a large fraction of high redshift objects. Also, it seems that the galaxies in the 70m sample span approximately the same range in SED peak, whatever their luminosity class, in contrast to the narrower local distribution, which notably shifts towards shorter wavelengths at higher luminosities. Although the majority of local LIRGs peak at 75 m, with a smaller fraction at 100 m (mean 77 m), high redshift LIRGs span a wide range in SED peak up to 160 m, with a mean of 105 m. This effect is even more pronounced in the ULIRGs, where the average peak in the SEDs shifts from an average local value of 60 m to a high-redshift value of 92 m.
4.3 Submm colours
In sections 4.1 and 4.2 we presented strong evidence that the 70 m sample is not simply a redshifted version of sources in the local Universe. What naturally follows is a comparison with the SubMillimetre Galaxy (SMG) population, comprised mostly of cold galaxies at high redshift. Due to the negative K-correction and sensitivity limits, SMGs discovered in blank field surveys are mostly in the 1.5z3.5 redshift range (e.g. Chapman et al. 2005), as the 350–850m wavelength range corresponds to 140–340m 78–188m, effectively sampling near the SED peak for a wide range of sources.
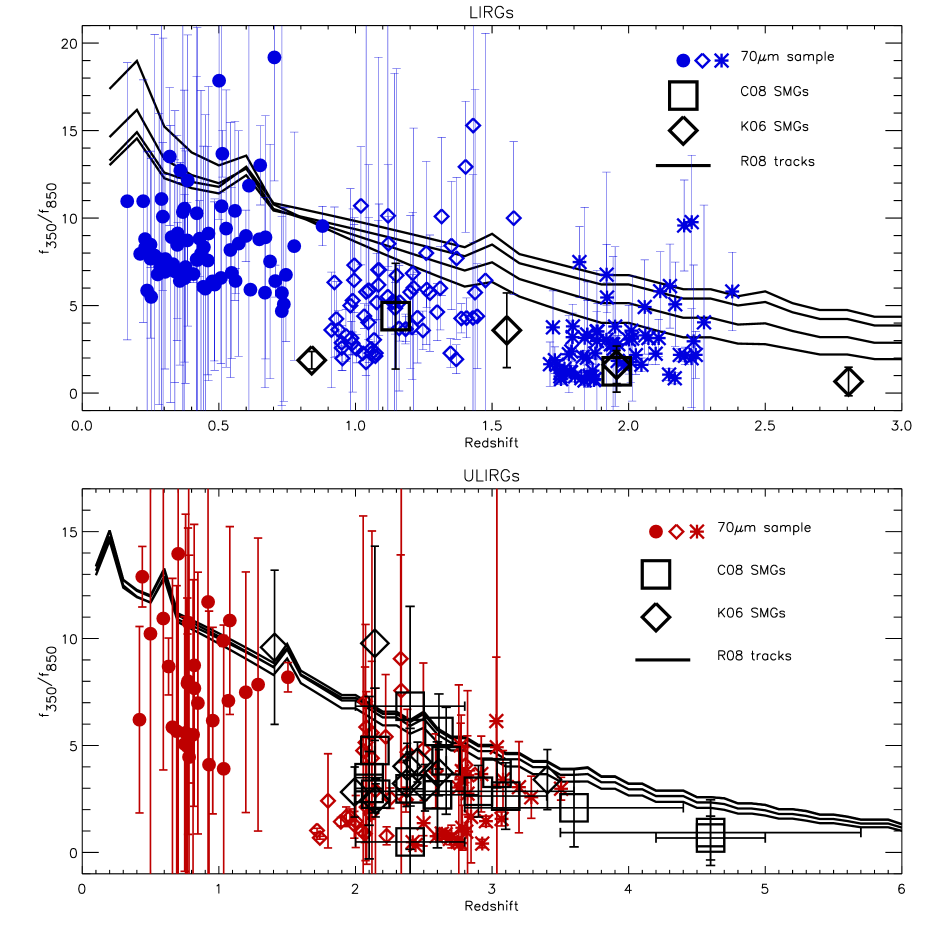
Using the SK07 fits, we predict 350 and 850m flux densities for the LIRGs and ULIRGs in the 70m sample, with uncertainties derived from the range of best-matched templates (see section 3.1) and plot the evolution of the f350/f850 colour with redshift (figure 7). We compare with LIRG and ULIRG SMG data from Kovacs et al. (2006, hereafter K06) and Coppin et al. 2008 (hereafter, C08). Also plotted are the R08 tracks, to represent the local IR galaxies. As the LIRGs in the 70m sample are at an average redshift of 0.4, we predict the sub-mm flux densities they would have if their redshifts were increased by 0.7 and 1.5, in order to bring them to a similar redshift range as the K06 and C08 LIRGs (top panel). Similarly, we calculate what submm flux densities we would expect for the ULIRGs (average z0.8) if their redshift were increased by 1.3 and 2 (lower panel).
The majority of K06 and C08 LIRGs and ULIRGs fall below the corresponding R08 tracks, implying a lower f350/f850 ratio; for a given LIR, sources with lower f350/f850 are colder, as there is a shift in far-IR emission, with more flux coming out at longer wavelengths. A large number of sources from the 70 m sample have similarly low f350/f850, again mostly below what is denoted by the R08 tracks, indicative of more cold dust emission, compared to what is seen locally. The agreement in f350/f850 between the SMGs and MIPS sources is a key result; it strongly suggests that the galaxies we detect at 70m are the z1 equivalents of the cold z1 sources detected in submm surveys.
5 Discussion
5.1 Cold Galaxies at z 1
We find evidence for evolution in the dust/star-formation properties with redshift, initially apparent through the f160/f70 colour and further quantified by the rest frame wavelength of the SED peak. More specifically, we show that a population of LIRGs and ULIRGs at 0.1z2 appears to have a cold-dust-associated far-IR excess not seen locally. Although we do identify many sources consistent with the kind of objects detected in the local Universe, such as the well-studied M82 and Arp220 types, our results establish a shift in the rest-frame far-infrared SEDs of high redshift sources towards longer wavelengths. A simple description for this, is that the shapes of the far-infrared SEDs of many high redshift sources may resemble more closely those of lower-luminosity galaxies locally.
The strong cold component identified in many of our 70 m objects must relate closely to conditions in the ISM, as it represents an increase in far-IR/submm flux compared to local galaxies and hence must represent a change in dust properties and/or star formation efficiency. For a given total infrared luminosity, sources that are described by colder SEDs may consequently be characterised by larger dust masses and/or higher dust opacity, an increase in grain emissivity or a combination of these. Another possibility is a change in the dust distribution, where a typical high-z LIRG/ULIRG may not be similar in structure to the strongly nuclear-concentrated local examples; instead the dust could be distributed over kpc scales, consistent with measurements of their extent in CO (e.g. Tacconi et al. 2006, Iono et al. 2009).
Hints for evolution have also emerged through other studies of high redshift, IR-selected sources. For example, Rowan-Robinson et al. (2004, 2005) report results from the European Large Area ISO Survey (ELAIS) and the Spitzer Wide-area InfraRed Survey (SWIRE), which indicate that many IR-luminous galaxies in the 0.15–0.5 redshift range are best fitted with cool cirrus models. Examination of IR SEDs for z0.5 ULIRGs, has revealed a higher cool to hot dust ratio than what is seen locally (Marcillac et al. 2006, Brand et al. 2008, Chakrabarti McKee 2008). Sajina et al. (2006, 2008) present results based on mid and far-IR selected samples, which suggest that their sources are better described by cooler temperatures and high far/mid-IR ratios in contrast to local ULIRGs. Le Floch et al. (2005) find that ISOCAM-detected LIRGS at a median redshift of z0.7 are characterised by half solar metallicities which could point to the IR SEDs being different from those of local LIRGs. This behaviour is an interesting complement to the evidence for evolution from mid-infrared spectroscopy and particularly the characteristics of Polycyclic Aromatic Hydrocarbon (PAH) features. The aromatic bands in high redshift galaxies are found to be similar in prominence and profile to the aromatic bands in local galaxies of lower luminosity (e.g. Pope et al. 2008, Rigby et al. 2008, Farrah et al. 2008), an important result as the PAH feature strengths in local galaxies are strongly correlated with emission from cold dust (Haas et al. 2002, Bendo et al. 2008).
Predictions from several studies are also in agreement with the mounting evidence that the ISM, star-formation efficiency and dust properties of many high redshift infrared galaxies significantly diverge from those in the local universe. Chemical evolution models (Calzetti Heckman 1999, Pei, Fall Hauser 1999) predict a lower contribution in the UV SFR density and an increase in the average AV by a factor of 2–3 at z1–2, an outcome also supported by observations in Efstathiou Rowan-Robinson (2003) and Le Floch et al. (2005). Le Floch et al. (2005) find a much stronger evolution in the infrared comoving energy density than in the UV over the same redshift range, evidence that dust reprocessing of optical light is more efficient at high redshift, but also tying in with an increase in star formation efficiency (SFR per unit cold gas mass) (Somerville, Primack and Faber 2001).
The observations and results outlined above are likely to have considerable impact in accurately modelling the far-IR and submm background, as well as pinpointing the evolution in the infrared luminosity function, where the cold SED component may play a more significant role than previously thought. We expect that cold galaxies such as those we identify here, will be discovered in abundance by the Herschel Space Observatory (Pilbratt et al. 2004). The capabilities of Herschel’s Spectral and Photometric Imaging Receiver (SPIRE, Griffin et al. 2007) and Photodetector Array Camera (PACS, Poglitsch et al. 2008) will provide detailed measurements in the 60–700 m region. This will allow accurate mapping of previously unexplored territories such as the nature of the main contributors to the cosmic infrared background and ISM properties at high redshift (Harwit 2004). The question as to whether a large fraction of IR-luminous galaxies at high redshift are cold, will explicitely be answered since the SED peak will be entirely defined at least up to redshift z3, enabling precise temperature measurements. In addition, with Herchel’s capabilities the nature and properties of dust at high redshift and its evolution through cosmic time will be accurately traced.
5.2 The submm/IR connection
SMGs, which are predominantly in the ULIRG and HyLIRG regime, are well-established as the most dust-rich galaxies in the Universe. Comparisons between the SEDs of SMGs and those of local and lower redshift (z 1.5) populations are therefore essential in the context of galaxy evolution, particularly evident when modelling the behaviour of the IR and submm source counts, which necessarily requires the assumption of a SED shape. If SMGs are the high redshift analogs of local warm IR galaxies, the high submm counts on the faint end (with the limits of present surveys) could only be reproduced by evoking strong evolution well beyond z3-4, as a warm SED moves the peak to shorter wavelengths, reducing the submm flux for a given LIR. This goes against the predictions of hierchical galaxy formation models which anticipate a downturn in space density of IR-luminous sources with Star Formation Rates (SFRs) 100 M⊙/yr by z3-4. Instead, if submm emission arises from a significantly cooler SED, submm counts could be fit with galaxies of more moderate SFRs (Kaviani, Haehnelt and Kauffman 2003). Predictions by Efstathiou et al. (2000), Rowan-Robinson (2001) and Efstathiou Rowan-Robinson (2003) also support this argument, suggesting that submm emission in high redshift galaxies could predominantly arise from cold dust and proposing that the quiescent cirrus component undergoes the same strong luminosity evolution as the starburst component.
Up to now, studies of SMG SEDs converge on the idea that they are predominantly fit by cooler cirrus SED templates (e.g. by Chapman et al. 2005, Kovacs et al. 2006, Pope et al. 2006, Coppin et al. 2008, Clements et al. 2008). Submm studies of high redshift ULIRGs and HyLIRGs, have shown that their intrinsic dust temperatures are distributed around a mean of T35 K (Chapman et al. 2005, Kovacs et al. 2006, Pope et al. 2006, Coppin et al. 2008). Huynh et al. (2007) report very low typical dust temperatures (T=21–33 K) for a sample of L51011 low-z SMGs. Interestingly, this corresponds to the range in temperatures seen in the local SBs and LIRGs described in D00 and it is in contast to the higher temperatures observed in local ULIRGs — the Farrah et al. (2003) local ULIRG sample is fit by T 42 K; see also Klaas et al. (1997) and Soifer et al. (1984) where the SEDs of Arp220 and NGC6240 are fit by modified blackbodies of temperature 47 K and 42 K respectively. Note that even if submm studies preferentially detect cold sources (e.g. Blain et al. 2004), many of these have total infrared luminosities comparable to the most energetic local galaxies, supporting the above evidence that a large number of high-redshift IR-luminous objects are colder than their local analogs. In fact the same conclusions are reached by Sajina et al. (2008) for a sample of high-redshift mid-IR selected sources, showing that this is not simply an artifact of the submm selection.
Our results have established a connection between the far-IR and submm, showing that high redshift SMGs likely share similar properties with the lower redshift galaxies selected in Spitzer/MIPS surveys. We find that the predicted submm colours for the 70 m-detected LIRGs and ULIRGs when redshifted to the 1.5z3.5 range, trace the same parameter space as the actual colours of submm-detected sources in the same luminosity and redshift range. This suggests that we have identified the missing link between SCUBA and Spitzer/MIPS galaxies, i.e. a population at intermediate redshift (z 1), detected by Spitzer but with the properties commonly seen in SCUBA galaxies.
6 Conclusions
We have examined the properties of a large sample of 0.1z2 IR-luminous sources selected at 70 m, corresponding to rest-frame 23–63 m, a selection which should strongly favour starforming galaxies. Using available photometry in the 8–160m range, we fit the Siebenmorgen Krugel (2007, SK07) dust templates in order to calculate the total infrared luminosity and rest-frame wavelength of the SED peak, finding the former to be mainly in the 1010–1014 L⊙ range and the latter at an average of 105 m for the LIRGs and 92 m for the ULIRGs. As the main aim of this study is to compare our results with local sources of equivalent luminosity, we use data from the local IRAS Bright Galaxy Sample, again fitting the photometry with the SK07 models. The locally-derived SED templates of Chary Elbaz (2001, CE01) and Rieke et al. (2008, R08) are also used as an additional comparative tool. We pay particular attention to any sources of bias that could affect our results and find nothing that could potentially predispose the outcome of our analysis.
Our major findings are:
-
•
By examining the f160/f70 colour of the 70m sample, we find that a large fraction of LIRGs and ULIRGs have higher f160/f70 than what is defined by the empirical CE01 and R08 local galaxy SEDs, by at least a factor of 2 and up to 10 in extreme cases. As the f160/f70 continuum slope is directly related to the position of the SED peak wavelength, non-trivial differences between local and high redshift IR populations are implied.
-
•
For a given total infrared luminosity, a large fraction of the LIRG and ULIRG SEDs in the 70 m sample peak at wavelengths longer than 90 m, indicative of a significant cold-dust-associated far-IR excess not detected in local sources of comparable luminosity. This behaviour is directly linked to evolution in dust and/or star-formation properties from the local to the high redshift universe.
-
•
We predict the f350/f850 colours that the 70m-selected LIRGs and ULIRGs would have if found at the average redshift of SMG populations (1 z 3) and find that they are on average equivalent to the observed SMG colours. This result suggests that we have potentially identified the z1 equivalents of the cold z1 sources discovered in blank field submm surveys.
The strong evidence that we present here, drives the answer to the question that we defined at the start, i.e. whether there is a substantial number of infrared galaxies at high redshift with properties divergent from those of their local counterparts, to be yes. More specifically, our results have shown that these sources being colder rather than warmer. The emergent conclusion is that the evolution of the IR-luminous population with redshift is towards a larger dust mass or higher dust opacity and emissivity, a more extended dust distribution, higher star-formation efficiency or a combination of all. The imminent Herschel observational programmes will be key in identifying and disentangling the main processes responsible.
Acknowledgments
This work is based on observations made with the Spitzer Space Telescope, operated by the Jet Propulsion Laboratory, California Institute of Technology, under NASA contract 1407 and partially supported by JPL/Caltech contract 1255094 to the University of Arizona. KC is grateful for STFC fellowship support. Special thanks to David Alexander for insightful discussions.
References
- Bavouzet et al. (2008) Bavouzet N., Dole H., Le Floc’h E., Caputi K. I., Lagache G., Kochanek C. S., 2008, AA, 479, 83
- Blain et al. (2004) Blain A. W., Chapman S. C., Smail I., Ivison R., 2004, ApJ, 611, 52
- Bolzonella et al. (2000) Bolzonella M., Miralles J.-M., Pelló R., 2000, AA, 363, 476
- Brand et al. (2006) Brand K., Dey A., Weedman D., Desai V., Le Floc’h E., Jannuzi B. T., Soifer B. T., Brown M. J. I., Eisenhardt P., Gorjian V., Papovich C., Smith H. A., Willner S. P., Cool R. J., 2006, ApJ, 644, 143
- Brand et al. (2008) Brand K., et al., 2008, ApJ, 673, 119
- Brinchmann & Ellis (2000) Brinchmann J., Ellis R. S., 2000, ApJL, 536, L77
- Bundy et al. (2006) Bundy K., Ellis R. S., Conselice C. J., Taylor J. E., Cooper M. C., Willmer C. N. A., Weiner B. J., Coil A. L., Noeske K. G., Eisenhardt P. R. M., 2006, ApJ, 651, 120
- Calzetti & Heckman (1999) Calzetti D., Heckman T. M., 1999, ApJ, 519, 27
- Chakrabarti & McKee (2008) Chakrabarti S., McKee C. F., 2008, ApJ, 683, 693
- Chapman et al. (2005) Chapman S. C., Blain A. W., Smail I., Ivison R. J., 2005, ApJ, 622, 772
- Chary & Elbaz (2001) Chary R., Elbaz D., 2001, ApJ, 556, 562
- Chary et al. (2004) Chary R., et al., 2004, ApJS, 154, 80
- Clements et al. (2008) Clements D. L., et al., 2008, MNRAS, 387, 247
- Cole et al. (2000) Cole S., Lacey C. G., Baugh C. M., Frenk C. S., 2000, MNRAS, 319, 168
- Coppin et al. (2008) Coppin K., et al., 2008, MNRAS, 384, 1597
- Dale et al. (2005) Dale D. A., et al., 2005, ApJ, 633, 857
- Dale & Helou (2002) Dale D. A., Helou G., 2002, ApJ, 576, 159
- Davis et al. (2003) Davis M., et al., 2003, in Guhathakurta P., ed., Society of Photo-Optical Instrumentation Engineers (SPIE) Conference Series Vol. 4834 of Society of Photo-Optical Instrumentation Engineers (SPIE) Conference Series, Science Objectives and Early Results of the DEEP2 Redshift Survey. pp 161–172
- Davis et al. (2007) Davis M., et al., 2007, ApJL, 660, L1
- de Grijp et al. (1985) de Grijp M. H. K., Miley G. K., Lub J., de Jong T., 1985, Nat, 314, 240
- Desai et al. (2008) Desai V., et al., 2008, ApJ, 679, 1204
- Dole et al. (2004) Dole H., et al., 2004, ApJS, 154, 87
- Dole et al. (2003) Dole H., Lagache G., Puget J.-L., 2003, ApJ, 585, 617
- Dole et al. (2006) Dole H., Lagache G., Puget J.-L., Caputi K. I., Fernández-Conde N., Le Floc’h E., Papovich C., Pérez-González P. G., Rieke G. H., Blaylock M., 2006, AA, 451, 417
- Dunne et al. (2000) Dunne L., Eales S., Edmunds M., Ivison R., Alexander P., Clements D. L., 2000, MNRAS, 315, 115
- Dunne & Eales (2001) Dunne L., Eales S. A., 2001, MNRAS, 327, 697
- Efstathiou et al. (2000) Efstathiou A., et al., 2000, MNRAS, 319, 1169
- Efstathiou & Rowan-Robinson (1990) Efstathiou A., Rowan-Robinson M., 1990, MNRAS, 245, 275
- Efstathiou & Rowan-Robinson (1995) Efstathiou A., Rowan-Robinson M., 1995, MNRAS, 273, 649
- Efstathiou & Rowan-Robinson (2003) Efstathiou A., Rowan-Robinson M., 2003, MNRAS, 343, 322
- Farrah et al. (2003) Farrah D., Afonso J., Efstathiou A., Rowan-Robinson M., Fox M., Clements D., 2003, MNRAS, 343, 585
- Farrah et al. (2008) Farrah D., et al., 2008, ApJ, 677, 957
- Farrah et al. (2005) Farrah D., Surace J. A., Veilleux S., Sanders D. B., Vacca W. D., 2005, ApJ, 626, 70
- Franceschini et al. (2003) Franceschini A., Berta S., Rigopoulou D., Aussel H., Cesarsky C. J., Elbaz D., Genzel R., Moy E., Oliver S., Rowan-Robinson M., Van der Werf P. P., 2003, AA, 403, 501
- Frayer et al. (2006a) Frayer D. T., et al., 2006a, AJ, 131, 250
- Frayer et al. (2006b) Frayer D. T., et al., 2006b, ApJL, 647, L9
- Frayer et al. (2009) Frayer D. T., et al., 2009, ArXiv e-prints
- Genzel et al. (1998) Genzel R., Lutz D., Sturm E., Egami E., Kunze D., Moorwood A. F. M., Rigopoulou D., Spoon H. W. W., Sternberg A., Tacconi-Garman L. E., Tacconi L., Thatte N., 1998, ApJ, 498, 579
- Gorjian et al. (1999) Gorjian V., Wright E. L., Chary R. R., 1999, in Bulletin of the American Astronomical Society Vol. 31 of Bulletin of the American Astronomical Society, Tentative Detection of the Cosmic Infrared Background at 2.2 and 3.5 microns Using Ground Based and Space Based Observations. pp 1394–+
- Granato & Danese (1994) Granato G. L., Danese L., 1994, MNRAS, 268, 235
- Granato et al. (2000) Granato G. L., Lacey C. G., Silva L., Bressan A., Baugh C. M., Cole S., Frenk C. S., 2000, ApJ, 542, 710
- Griffin et al. (2007) Griffin M., et al., 2007, Advances in Space Research, 40, 612
- Harwit (2004) Harwit M., 2004, Advances in Space Research, 34, 568
- Houck et al. (2005) Houck J. R., et al., 2005, ApJL, 622, L105
- Huynh et al. (2007) Huynh M. T., Frayer D. T., Mobasher B., Dickinson M., Chary R.-R., Morrison G., 2007, ApJL, 667, L9
- Huynh et al. (2007) Huynh M. T., Pope A., Frayer D. T., Scott D., 2007, ApJ, 659, 305
- Kaviani et al. (2003) Kaviani A., Haehnelt M. G., Kauffmann G., 2003, MNRAS, 340, 739
- Kennicutt et al. (2003) Kennicutt Jr. R. C., et al., 2003, PASP, 115, 928
- Klaas et al. (1997) Klaas U., Haas M., Heinrichsen I., Schulz B., 1997, AA, 325, L21
- Klaas et al. (2001) Klaas U., Haas M., Müller S. A. H., Chini R., Schulz B., Coulson I., Hippelein H., Wilke K., Albrecht M., Lemke D., 2001, AA, 379, 823
- Kovács et al. (2006) Kovács A., Chapman S. C., Dowell C. D., Blain A. W., Ivison R. J., Smail I., Phillips T. G., 2006, ApJ, 650, 592
- Lagache et al. (2005) Lagache G., Puget J.-L., Dole H., 2005, ARAA, 43, 727
- Le Floc’h et al. (2004) Le Floc’h E., et al., 2004, ApJS, 154, 170
- Le Floc’h et al. (2005) Le Floc’h E., et al., 2005, ApJ, 632, 169
- Lonsdale et al. (2003) Lonsdale C. J., et al., 2003, PASP, 115, 897
- Lonsdale et al. (2004) Lonsdale C. J., et al., 2004, ApJS, 154, 54
- Low et al. (2007) Low F. J., Rieke G. H., Gehrz R. D., 2007, ARAA, 45, 43
- Lu et al. (2003) Lu N., Helou G., Werner M. W., Dinerstein H. L., Dale D. A., Silbermann N. A., Malhotra S., Beichman C. A., Jarrett T. H., 2003, ApJ, 588, 199
- Makovoz & Marleau (2005) Makovoz D., Marleau F. R., 2005, PASP, 117, 1113
- Marcillac et al. (2006) Marcillac D., Elbaz D., Chary R. R., Dickinson M., Galliano F., Morrison G., 2006, AA, 451, 57
- Marleau et al. (2004) Marleau F. R., et al., 2004, ApJS, 154, 66
- Miley et al. (1985) Miley G. K., Neugebauer G., Soifer B. T., 1985, ApJL, 293, L11
- Murphy et al. (1996) Murphy Jr. T. W., Armus L., Matthews K., Soifer B. T., Mazzarella J. M., Shupe D. L., Strauss M. A., Neugebauer G., 1996, AJ, 111, 1025
- Papovich et al. (2007) Papovich C., et al., 2007, ApJ, 668, 45
- Pei et al. (1999) Pei Y. C., Fall S. M., Hauser M. G., 1999, ApJ, 522, 604
- Pilbratt et al. (2004) Pilbratt G. L., Prusti T., Heras A. M., Leeks S., Marston A. P., Vavrek R., 2004, in Bulletin of the American Astronomical Society Vol. 36 of Bulletin of the American Astronomical Society, Herschel Space Observatory. pp 813–+
- Poglitsch et al. (2008) Poglitsch A., et al., 2008, in Society of Photo-Optical Instrumentation Engineers (SPIE) Conference Series Vol. 7010 of Society of Photo-Optical Instrumentation Engineers (SPIE) Conference Series, The Photodetector Array Camera and Spectrometer (PACS) for the Herschel Space Observatory
- Pope et al. (2006) Pope A., et al., 2006, MNRAS, 370, 1185
- Rieke et al. (2004) Rieke G. H., et al., 2004, ApJS, 154, 25
- Rigby et al. (2008) Rigby J. R., et al., 2008, MNRAS, 384, 1597
- Rowan-Robinson (2001) Rowan-Robinson M., 2001, ApJ, 549, 745
- Rowan-Robinson et al. (2004) Rowan-Robinson M., et al., 2004, MNRAS, 351, 1290
- Rowan-Robinson et al. (2005) Rowan-Robinson M., et al., 2005, AJ, 129, 1183
- Sajina et al. (2008) Sajina A., et al., 2008, ApJ, 683, 659
- Sajina et al. (2006) Sajina A., Scott D., Dennefeld M., Dole H., Lacy M., Lagache G., 2006, MNRAS, 369, 939
- Sanders et al. (2003) Sanders D. B., Mazzarella J. M., Kim D.-C., Surace J. A., Soifer B. T., 2003, AJ, 126, 1607
- Sanders & Mirabel (1996) Sanders D. B., Mirabel I. F., 1996, ARAA, 34, 749
- Seymour et al. (2008) Seymour N., Dwelly T., Moss D., McHardy I., Zoghbi A., Rieke G., Page M., Hopkins A., Loaring N., 2008, MNRAS, 386, 1695
- Siebenmorgen & Krügel (2007) Siebenmorgen R., Krügel E., 2007, AA, 461, 445
- Siebenmorgen et al. (2001) Siebenmorgen R., Krügel E., Laureijs R. J., 2001, AA, 377, 735
- Silva et al. (1998) Silva L., Granato G. L., Bressan A., Danese L., 1998, ApJ, 509, 103
- Soifer et al. (1989) Soifer B. T., Boehmer L., Neugebauer G., Sanders D. B., 1989, AJ, 98, 766
- Soifer et al. (1984) Soifer B. T., Neugebauer G., Helou G., Lonsdale C. J., Hacking P., Rice W., Houck J. R., Low F. J., Rowan-Robinson M., 1984, ApJL, 283, L1
- Somerville et al. (2001) Somerville R. S., Primack J. R., Faber S. M., 2001, MNRAS, 320, 504
- Stanev & Franceschini (1998) Stanev T., Franceschini A., 1998, ApJL, 494, L159+
- Symeonidis et al. (2007) Symeonidis M., et al., 2007, ApJL, 660, L73
- Symeonidis et al. (2008) Symeonidis M., Willner S. P., Rigopoulou D., Huang J.-S., Fazio G. G., Jarvis M. J., 2008, MNRAS, 385, 1015
- Veilleux et al. (1997) Veilleux S., Sanders D. B., Kim D.-C., 1997, ApJ, 484, 92
- Verma et al. (2005) Verma A., Charmandaris V., Klaas U., Lutz D., Haas M., 2005, Space Science Reviews, 119, 355
- Wang et al. (2006) Wang J. L., Xia X. Y., Mao S., Cao C., Wu H., Deng Z. G., 2006, ApJ, 649, 722
- Werner et al. (2004) Werner M. W., et al., 2004, ApJS, 154, 1
- Yan et al. (2004) Yan L., et al., 2004, ApJS, 154, 60
- Zheng et al. (2007) Zheng X. Z., Dole H., Bell E. F., Le Floc’h E., Rieke G. H., Rix H.-W., Schiminovich D., 2007, ApJ, 670, 301