The unusual spectral energy distribution of LBQS 0102-2713
Abstract
We have studied the spectral energy distribution of the quasar LBQS 0102-2713. The available multiwavelength data in the observers frame are one optical spectrum between 3200 and 7400 Å (Morris et al. 1991), 7 HST FOS spectra between 1700 and 2300 Å (York et al. 1990), one GALEX NUV flux density and a magnitude obtained from NED, and 3 public ROSAT PSPC pointed observations in the 0.12.4 keV energy band. The values obtained from the HST FOS-, the optical spectrum, and the ROSAT observations are -2.3 and -2.2, respectively, comparable to BAL quasars (e.g. Gallagher et al. 2006). The 2500 Å luminosity density is about a factor of 10 higher compared to the mean of the most luminous SDSS quasars (Richards et al. 2006, their Fig. 11). The 2 keV value is lower by about a factor of 10 compared to the radio loud quasars shown in Fig. 10 of Richards et al. (2006). LBQS 0102-2713 exhibits one of the steepest soft X-ray photon indices obtained so far. For a simple power law fit with leaving the free in the fit we obtain a photon index of . Fixing the value to the Galactic value the photon index still remains steep with a value of about 3.5. We argue that LBQS 0102-2713 is similar to BAL quasars with respect to their UV brightness and 2 keV X-ray weakness. However, the absorption by neutral matter is significantly lower compared to BAL quasars. The X-ray weakness is most probably not due intrinsically X-ray weakness based on the UV line strenghts which are comparable to the line strength values reported in quasar composites (e.g. Brotherthon et al. 2001, Vanden Berk et al. 2001, or Zheng et al. 1997). If the X-ray weakness will be confirmed in future observations, LBQS 0102-2713 might be indicative for a new class of quasars with an unusual combination in their UV-, X-ray, and properties.
Subject headings:
AGN: general — Quasars: individual LBQS 0102-27131. Introduction
We report on the extreme ultraviolet-to-X-ray spectral energy distribution (SED) of the quasar LBQS 0102-2713 using the spectral index . The value is defined as . The value relates the relative efficiencies of emitted ultraviolet disk photons to the hard X-ray photons. This value is therefore an important tool to provide quantitative and qualitative constrains on models of the physical association between the UV and X-ray emission. The value obtained from the HST FOS spectra (York et al. 1990), the optical spectrum (Morris et al. 1991), and the ROSAT data are -2.3 or -2.2, respectively. The values are similar compared to BAL quasars (e.g. Gallagher et al. 2006). The authors have analyzed 35 BAL quasars based on Chandra observations. Their values range between -1.65 and -2.48. The majority of the objects have values smaller than -2.0. It is argued that the X-ray weakness of BAL quasars is due to neutral intrinsic absorption with column densities between about . As more soft X-ray photons are expected for a simple neutral absorber, the absorption is assumed to be more complex. Partial covering or ionized absorbers can account for this observational fact.
Gibson et al. (2008) have analyzed Chandra and XMM-Newton observations of 536 SDSS quasars. They find that radio-quiet BAL quasars tend to have steeper values compared to non-BAL quasars (their Fig. 3). They constrain the fraction of X-ray weak non-BAL quasars and find that such objects are rare. Leighly et al. (2007) report on a value of -2.3 in the quasar PHL 1811. Miniutti et al. (2009, submitted to MNRAS) found values between -1.5 and -4.3 in PHL 1092. Similar results have been obtained by Strateva et al. (2005), Vignali et al. (2003) and Green et al. (2008). However most of the objects with values close to -2 are upper limits. The dependence on as a function of redshift and the rest frame ultraviolet luminosity has been investigated by Vignali et al. (2003), Strateva et al. (2005), and Green et al. (2008).
We also concentrate on the spectral energy distribution in the soft (0.1-2.4 keV) X-ray band based on ROSAT PSPC observations. We find that LBQS 0102-2713 might have an extreme value of the photon index of . X-ray observations have shown Narrow-Line Seyfert 1 Galaxies (NLS1s) to have steep soft X-ray spectra as a class, first reported by Puchnarewicz et al. (1992). A significant correlation between the slope of the 0.12.4 keV X-ray continua and the FWHM of the line was found for Seyfert 1 galaxies (Boller et al. 1996). The distribution of the values and FWHM show a continuous increase in the slope of the spectral continuum distribution with decreasing FWHM line width. This suggests that narrow- and broad-line Seyfert 1 galaxies form essentially the same class of objects and that there might be an underlying physical parameter which controls the distribution of objects. Smaller black hole masses could account for narrow line widths which requires that NLS1 have to be accreting at higher fractions of their Eddington rates to maintain their relatively normal observed luminosities (Boller et al. 1996). XMM-Newton observations of IRAS 13224-3809 (Boller et al. 2003) and 1H 0707-495 (Boller et al. (2003) have confirmed that a shifted accretion disc spectrum accounts for the steep ROSAT photon indices. Steep soft photon indices have also been reported by other authors (e.g. New Astronomy Reviews, 2000). Walter & Fink (1993) found values ranging between 1.5 and 3.4. Fiore et al. (1998) have used ASCA data on the quasars NAB 0205+024 and PG 1244+026 and found photon indices of , respectively. George et al. (2000) report on a photon index of in PG 0003+199. Similarly to the correlation found in the soft energy range, a correlation between the slope of the 210 keV photon index, obtained from power-law fits to ASCA observations of broad- and narrow-line Seyfert 1 galaxies, and the width of the FWHM line, has been discovered by Brandt et al. (1997). Steep 210 keV X-ray continua, with values of the photon index between 1.9 and 2.6, are characteristic of NLS1s. One possible explanation suggested is that NLS1s may exhibit a cooler accretion disc corona (Pounds et al. 1995). A more detailed description of our knowledge on NLS1s is given in: The Universe in X-rays, sections 22.2 to 22.5, Eds. Trümper & Hasinger (2008).
The multiwavelength SED of radio-loud quasars has been investigated by Richards et al. (2006), building upon the quasar SED published by Elvis et al. (1994) for radio-quiet quasars. Richards et al. (2006) use mid-infrared data based on the SpitzerSpaceTelescope, SDSS photometry as well as near-infrared, GALEX, VLA and ROSAT data. One of the most important results is the quasar SED shown in their Fig. 10. The mean radio-quiet value from Elvis et al. (1994) is -1.5, while for radio-loud objects the mean value is -1.8 (Richards et al. 2006).
LBQS 0102-2713 is a quasar at a redshift of 0.78. The object was selected from the ROSAT PSPC catalogue via the hardness ratio 1 (HR1) 111The hardness ratio 1 is defined as HR1 = ((52-102)-(11-41))/((11-41)+(52-201)) Zimmermann et al. 1994. The numbers refer to the ROSAT PSPC channels. criteria in the range from -0.5 to -0.7 derived from a reference sample of known steep spectrum AGNs. LBQS 0102-2713 showed the steepest photon index from the selected sample. Here we concentrate on 3 public ROSAT PSPC observations, an optical spectrum between the 3200 to 7400 Å observed in 1988 (Morris et al. 1991), 7 HST FOS spectra between 1700 and 2300 Å, and one GALEX NUV flux density available at NED. High energy data above 2.4 keV are not available presently. In Section 2 we describe the X-ray observations and data analysis. The results from the X-ray fitting analysis is given in Section 3. Section 4 contains the results from the analysis. The comparison with mean SED’s is given in Section 5. Models for the X-ray weakness are presented in Section 6. Section 7 contains the summary and open problems. In Section 8 we list security checks on the identification of LBQS 0102-2713 as a X-ray source. Throughout the paper we adopt and a -cosmology of .
2. X-ray observations and data analysis
The object was observed three times with the ROSAT PSPC detector in 1992 (c.f. Table 1 for the observation log file). The source is located off-axis in the PSPC detector with a separation from the pointing direction of about 0.5 degrees. The data were retrieved from the MPE archive. The PSPC data in the MPE archive were processed at MPE and copied to HEASARC. The ROSAT data in both archives are identical.
The ROSAT data were converted into FITS files using the xselect command-line interface version 2.4. The observations were converted into FITS files and a merged FITS file was created from the two longer observations (ROR numbers 700121p-0 and 700121p-2). The short observation (ROR number 700121p-1) is highly background dominated and the source is not significantly detected. Therefore the results from the spectral fitting are only presented for the two long observations and the corresponding merged data set. The xselect command-line interfaces handles RDF FITS format files. In the RDF case the events are for instance in the file rp700121a00_bas.fits file (the basic file) for ROR number 700121p-0. Using the read events command the two single observations and the merged observation the were read into xselect. ROSAT images were created via extract image and saoimage. For all three observations used for subsequent spectral fitting the source region was extracted at and . The background region was extracted at and . The source and background extraction radii are 320 arcsec. Finally using extract spectrum and save spectrum the source and background fits files were created. The corresponding ROSAT response matrix is pspcb_92mar11.rsp.
We have analyzed the ROSAT PSPC observations of LBQS 0102-2713 independently from the xselect command-line interface with the EXSAS software routines (Zimmermann et al. 1994) developed for analyzing ROSAT data based on the MIDAS software package for the two long observations 700121p-0 and 700121p-2. A merged data file was also created with the EXSAS command intape/disk. Energy channels were selected from 8 to 240 using the EXSAS prepare-spectrum programme.
3. Spectral fitting
In the ROSAT All-Sky Survey (RASS) we get 26 source counts with a mean exposure of 333 seconds. The extraction radius is 500 arcsec. For the background we get 16 counts with a mean exposure of 435 seconds and an extraction radius of 500 arcsec. This results in 10 net counts and a mean count rate of . With these numbers no reliable fits could be obtained from the RASS data. For the merged data sets of the PSPC pointings we get 1351 source counts and 741 background counts for a total exposure of 12881 seconds. This results in 610 net counts and a mean count rate of . With these numbers and the limited spectral energy resolution of ROSAT only a limited range of models can be fitted. We present the results only for a simple power law fit with cold absorption and a disk black body model. Longer X-ray observation with the present generation of X-ray satellites are required to present more advanced model fits, e.g. a smeared absorption model according to Schurch & Done (2006), or a disk reflection model following (Crummy et al. 2006).
3.1. xselect command-line interface and EXSAS spectral power law fitting
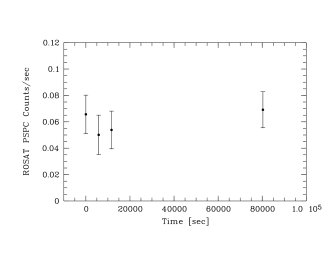
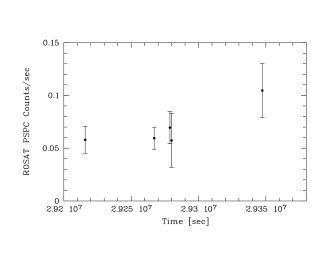
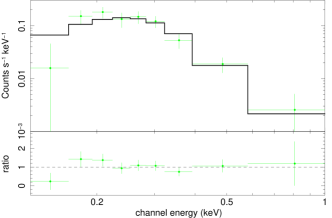
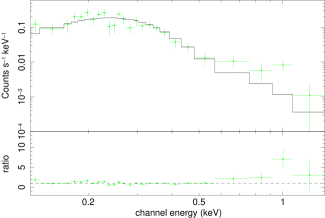
The source spectra obtained from the ROR numbers 700121p-0 and 700121p-2 using the xselect command-line interface were grouped with the grppha command with group min 10. The merged data set was grouped with group min 30. The spectral fitting was performed using XSPEC version 12.5.0. The model components were (mo = phabs (zpo)). While the light curves do not show significant variations (Fig. 1) the resulting photon indices are remarkably steep (Fig. 2). LBQS 0102-2713 might be the quasar with the steepest soft X-ray photon index, detected in two individual and the merged observations, reported so far. For the merged data set we get and for the xselect and EXSAS software packages, respectively. The spectral fitting results from the xselect command line interface and the EXSAS software routines are listed in Table 2. The spectral parameters obtained from both software systems are consistent within the errors. As a security check we have used the NASA GSFC simulation software webpimms. The simulated spectra are consistent with the ROSAT power law fits. This is an independent test, whether the calibration and response files available at the MPE site give the same results as the corresponding files produced by the NASA GSFC calibration team.
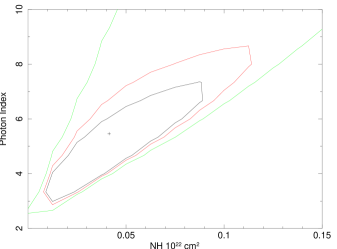
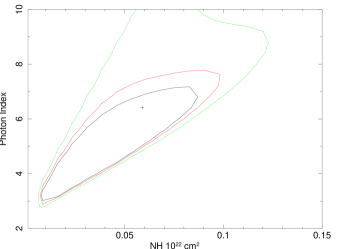
3.2. contour plots
The Galactic foreground absorption in the direction to LBQS 0102-2713 is very low with . It is known that and are correlated in ROSAT PSPC fits, such that a larger requires a steeper photon index to give a good fit. In Fig 3 we show the contour plots for the merged data set and for the ROR number 700121p-2. For the ROR number 700121p-0 no reliable contour plot could be obtained. At a 99 per cent confidence level the the photon index is about 3.5 at the Galactic value. The photon index might indeed be flatter as and the object may be less special in X-rays than it appears from the simple power law fits. However, the photon index obtained for a power law fit with the Galactic value fixed remains still steep for quasar soft X-ray spectral energy distributions (c.f. Section 1). Longer observations with the present generation of X-ray telescopes are required to confirm whether the photon index of LBQS 0102-2713 is indeed extremely steep.
3.3. Ionized absorber plus power law spectral modelling
We note that a simulation of a power law plus an ionized absorber could also result into a flatter photon index. A simulated 50 ks XMM-Newton spectrum obtained from a power law model with cold absorption plus an ionized absorber based on the grid25BIG_mt.fits model (Done, private communication) gives a photon index of for a column density of the ionized absorber ranging between and an ionization parameter range between . The parameter ranges explored range between and 10 to 1000. The flatter photon index occurs in a very narrow parameter range of the ionized absorber column density and the ionization value. When fitting the simulated data with the ROSAT PSPC response and the ROSAT exposure time, the photon index is , consistent with the ROSAT spectral fitting results for a power law model with the value leaving free in the fit.
3.4. Black body spectral fitting results
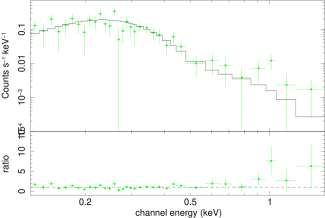
A black body fit to the merged data set does also result into an acceptable fit. The derived spectral parameters in the rest frame are: , , and at 1 keV. Due to the limited spectral resolution of ROSAT we cannot disentangle between the a power law and a black body model. We compare the derived black body temperature with other published black body temperatures and find that they are in good agreement. Crummy et al. (2006) found values for the black body temperature for an AGN sample observed with XMM-Newton between 0.009 and 0.17 keV (their Table 2). Tanaka, Boller and Gallo (2005) have analyzed NLS1 spectra observed with XMM-Newton and found for a sample of 17 objects black body temperatures between 0.09 and 0.15 keV. Fiore et al. (1998) obtain black body temperatures of 0.16 keV for PG 1244+026 and NAB 0205+024, respectively based on ASCA observations. Puchnarewicz et al. (2001) obtain a value of 0.13 keV for the NLS1 galaxy RE J1034+396.
4. Deriving the value for LBQS 0102-2713
4.1. Deriving the 2500 Å flux density from the optical spectrum
Morris et al. (1991) have published an optical spectrum of LBQS 0102-2713 in the wavelength range between 3200 and 7400 Å in the observers frame (c.f. Fig. 4). The Mg II line at 2800 Å (rest frame) is clearly visible. Applying a Gaussian fit to this line we obtain a FWHM value of about 2200 km in the rest frame. This value is very close to the artificial border line between NLS1 galaxies and broad line Seyfert galaxies of 2000 km following the definition of Osterbrock and Pogge (1985). In addition Morris et al. (1991) first noted the strong UV Fe II multiplet emission between about 2200 and 2500 Å in the rest frame. All this is typical for NLS1 galaxies and LBQS 0102-2713 can be considered as a X-ray bright NLS1 galaxy. This goes in line with the steep X-ray spectrum. In addition a strong C III] line is found at 1909 Å rest frame and a strong emission feature at about 2075 Å which is usually interpreted as a bunch of Fe III multiplets. The later feature is catalogued in the Vanden Berg quasar composite paper (2001) and is certainly present in higher signal-to-noise composites.
The observed 4450 Å flux density from the optical spectrum (c.f. Fig. 4) obtained in 1988 is about . Details of the spectroscopic measurements can be found in section 2.3 of Morris et al. (1991). To convert the units from Å to Hz we followed the relation from Hogg (2000) described in his Chapter 7. As the differential flux per unit log frequency or log wavelength is (Hogg uses S instead of f) one gets with and . The resulting observed flux density per Hz is . To correct the monochromatic flux measurements for Galactic extinction we used the Nandy et al. (1975) extinction law with . Their Table 3 gives for at 4450 Å a R value of 3.8. The E(B-V) value from the GALEX data obtained from NED is 0.02. According to Geminale & Popowski (2005) the relation between R and is . Following their extinction curves shown in Fig. 4 one obtains an value of about 0.5. The value at 4450 Å is then 0.076 and the value using the relations given above is 0.066. The value is 1.15. The extinction corrected flux and the uncorrected flux at 4450 Å are related by . The luminosity distance . The resulting rest frame UV luminosity density is . The relation between and is .
4.2. Deriving the 2500 Å flux density from the HST FOS spectra
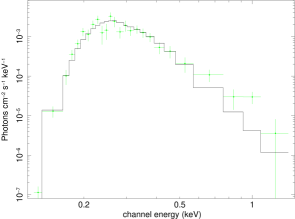
We also analyzed the 7 HST FOS spectra named as Y309010nT with n ranging from 2 to 8. The HST FOS spectra were obtained from the HST FOS proposal ID 6007: Comparison of the large scale structure in QSO absorbers and galaxies in the Galactic Poles, D. York, University of Chicago. The observed wavelength ranges between 1700 and 2300 Å. All 7 exposures obtained in 1995 agree in their flux density values and the HST FOS absolute and relative calibration is very good (M. Rosa, ESO Garching, private communication). In Fig. 5 we show the spectrum for the science exposure number Y3090102T. The line is clearly visible and marked in the spectrum. The line is blended with a low ionization line of N V at 1240 and 1242 Å in the rest frame. In addition there is emission from the line blended with the O VI line at 1032 and 1037 Å at their rest frame wavelengths.
The observed 2300 Å flux density is about . The flux density at 2500 Å rest frame is . To extrapolate the corresponding rest frame wavelength of 1292 Å to 2500 Å we have used the value of -0.5 of Richstone & Schmidt (2000). The extinction corrected flux at 2500 Å is , about a factor of 3.3 larger compared to the non-extinction corrected flux density. The slight discrepancy compared to the optical spectrum obtained by Morris et al. (1991) might be due to flux variability between the 1988 and 1995 observations or due to the extrapolation from 1292 to 2500 Å using a mean value of -0.5. The correction for Galactic extinction has been performed as described in the previous subsection. The R value at 2500 Å is 7.2 and the value is 7.2. The resulting value is 1.4. This results into a Galactic extinction correction with a factor 3.3 and the extinction corrected flux is . The resulting rest frame luminosity density is .
4.3. Deriving the 2 keV flux density from the merged ROSAT PSPC data set
The 2 keV rest frame flux density is determined following Hogg (2000) and Weedman’s Quasar Astronomy (Section 3.5, page 61, 1986). The photon index is related to the energy index via . For a photon index not equal to 2 the rest frame 2 keV flux density is given by . The unabsorbed ROSAT flux in the 0.5-2.0 keV energy band is . As the photon index derived in the previous section was 6.0, we get for a value of -5. The corresponding 2 keV and 0.5 keV frequencies are . This results into a flux density at 2 keV of . The 2 keV luminosity density is then . We note that the extremely steep photon index has to be confirmed in future observations with the present generation of X-ray telescopes given the results from the contour plots shown in Fig. 3. If the X-ray spectrum is flatter than obtained from the power law fits, this would result in a less extreme value.
For a definition of one derives values of -2.3 and -2.2.
5. Comparison with quasar SED’s
5.1. Comparison with mean SDSS quasar SED’s
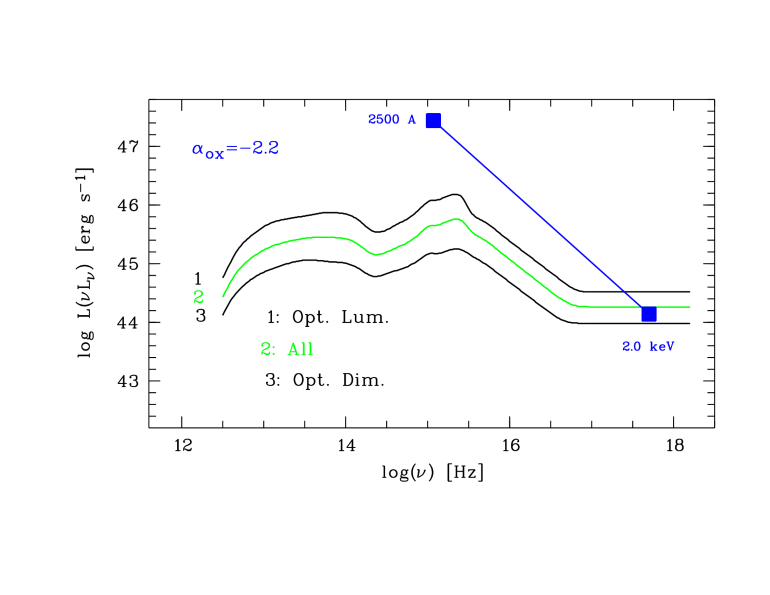
Richards et al. (2006) show the mean quasar SED’s for optically luminous SDSS-, all SDSS-, and optically dim quasars (c.f. Fig. 11 of their paper). In Fig. 6 we show an adopted version of the plot of Richards et al. (2006). The value at 2500 Å rest frame wavelength is . This is about a factor of 10 more luminous compared to the mean of the optically most luminous SDSS quasars. However there is a large dispersion in the optical magnitudes for quasars. Brotherton et al. (2001) show the distribution of the magnitudes for more than 11000 quasars (their Fig. 5). Their absolute magnitudes range between about to . LBQS 0102-2713 has a photometric IIIa-J magnitude of 17.52 mag as taken from NED at a wavelength of 4612 Å corresponding to 0.46 m. This close to the mean B wavelength of 0.40 m. The corresponding value of LBQS 0102-2713 is -25.9. This might indicate that the scatter in the 2500 Å luminosities is also large and that LBQS 0102-2713 is less extreme in the UV than one would think at first glance when comparing the UV value to the mean of the optically most luminous quasars. The corresponding 2.0 keV rest frame value of value is which is comparable to the optically dim SDSS quasars. The dispersion in the X-rays appears to be much less compared to the UV luminosities if one compares the X-ray luminosity of LBQS 0102-2713 to the X-ray luminosities as shown in the sample papers of Strateva et al. (2005), Vignali et al. (2003) or Gibson et al. (2008).
5.2. Comparison with the quasar SED for radio-loud quasars
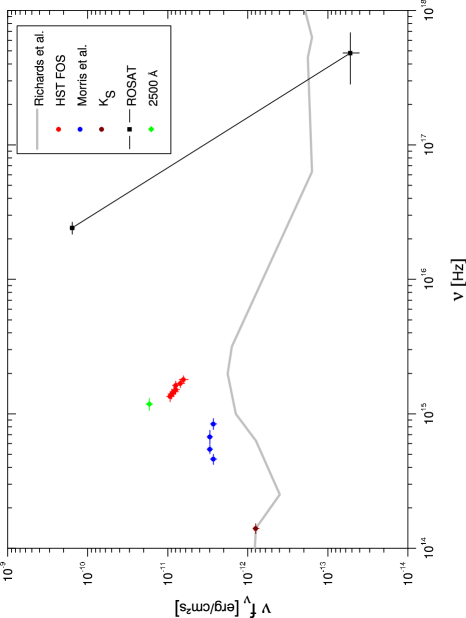
In Fig. 7 we have plotted the available multiwavelength data in units of versus the wavelength and compare these data points to the mean quasar SED for radio-loud objects from Richards et al. (2006, their Fig. 10). All data points are extinction corrected. For the ROSAT data we show only the lowest and highest energy data point. While at 2 keV the object is X-ray weak compared to the mean quasar SED, at the softest energies LBQS 0102-2713 is a very powerful emitter and the value even exceeds the 2500 Å UV value. The HST FOS data points are about a factor of 2 to 5 larger compared to the mean quasar SED. Here we note again that the scatter in the individual UV luminosities compared to the mean might be larger as pointed out in the previous subsection and that therefore the object might be less extreme in it’s UV luminosity. The optical data points and the magnitude follow the mean quasar SED. The main result from this plot is the discrepancy between the X-ray and HST FOS data points as these bands are discontinuous. The standard picture assumes that the rest frame UV photons are emitted from the accretion disc and that the hard X-ray photons are arising from the accretion disc corona. From Fig. 7 it is obvious that there is a discrepancy between the UV and the X-ray photons. The optical data from Morris et al. (1991) are also offset with respect to the HST FOS data points. This is most probably due to a significant contribution from the host galaxy and the rest frame optical photons are not expected to be related to the accretion disc. We have cross-checked the discontinuity between the UV and X-ray data points. The GALEX NUV wavelength is 2315.7 Å (c.f. Morrissey et al. 2007, their Table 1). The NUV GALEX calibrated flux from NED is 282.2 Jy. This converts into flux densities of or . The GALEX NUV flux density value is consistent with the flux density shown in the HST FOS spectrum is Fig. 5.
6. Models for the X-ray weakness
6.1. The intrinsically weakness model
Leighly et al. (2007) favor an intrinsically X-ray weakness model for the quasar PHL 1811. The 2 keV X-ray emission is intrinsically weak rather than absorbed. In this case one expects weak low ionization of semiforbidden UV lines. For the blend of the and N V lines an EW value of 15 eV is obtained. No EW values are given for the blend of and O VI. The authors argue that this points to an intrinsically weak X-ray model. The argumention for an intrinsically X-ray weakness model is based on individual lines such as Na I D, Ca II H and K and C IV. The rest frame EW values for the blend of and the O VI lines and the and the N V lines shown in Fig. 5 are about 12 and 50 Å, respectively. In the following we compare these values with quasar composite spectra. Brotherton et al. (2001) give for the plus O VI lines an EW value of 11 Å in the rest frame. For the blend of and N V the EW value is 87 Å. The corresponding values reported by Vanden Berk et al. (2001) are 9 and 94 Å respectively. Zheng et al. (1997) found values of 16 and 102 Å respectively. The EW values obtained for LBQS 0102-2713 are typical to the mean quasar composite values and the source appears not to be intrinsically X-ray weak.
6.2. Other models
There are other models in the literature which are speculative or do have a low probability to explain the X-ray weakness.
Gibson et al. (2008) present in their Fig. 2 a decreasing trend of with increasing 2500 Å UV luminosity density. This is a strong observational constraint as an increased UV luminosity density results into steeper values. In the case of PHL 1811 and LBQS 0102-2713 we indeed see lower 2 keV flux densities compared to other quasars. If one compares the UV and X-ray luminosity densities of LBQS 0102-2713 which are for the Morris et al. (1991) spectrum and obtained from the HST FOS spectra and an X-ray luminosity density of obtained from ROSAT, with Fig. 8 of Vignali et al. (2003) the X-ray weakness becomes immediately apparent. The reason for the so called global X-ray Baldwin effect is presently not known. It is speculated that a patchy or disrupted accretion disc corona is related to the UV luminosity density (Gibson et al. 2008). However there is no direct observational proof for this model.
One could speculate that UV and X-ray variability of the source might account for the low value. Assuming that LBQS 0102-2713 was in 1992 in a low X-ray flux state, then a factor of about 10 at 2 keV is required to obtain the canonical value of -1.8 for radio-loud quasar as shown in Fig. 11 of Richards et al. (2006). A factor of 10 in three years with respect to the optical observations appears unlikely as only a few AGN are known to exhibit flux variability of a factor of 10 or more. In addition, variability seems unlikely given Hook et al. (1994) who find only weak optical variability with =0.17.
7. Summary and open problems
7.1. Comparison to BAL quasars and a possible unique combination of UV brightness, X-ray weakness and low values
LBQS 0102-2713 appears to be very similar to BAL quasars which show strong UV- and weak 2 keV X-ray emission (c.f. Gallagher et al. 2006). Their values range between -1.65 and -2.48. The majority of the objects have values smaller than -2.0. They authors argue that the X-ray weakness of BAL quasars is due to neutral intrinsic absorption with column densities between about . As more soft X-ray photons are expected for a simple neutral absorber, the authors argue that the absorption is more complex. Partial covering or ionized absorbers can account for this observational fact. However, LBQS 0102-2713 do not show such high values for the neutral absorber compared to BAL quasars. The foreground absorption is about . This is at least a factor of about 20 lower compared to BAL quasars. LBQS 0102-2713 is an object which exhibits an unusual combination of UV brightness, X-ray weakness and no significant absorption by neutral matter along the line of sight. In addition, there are no significant indications that the object is intrinsically X-ray weak, in contrast to the argumentation for PHL 1811 by Leighly et al. (2007). This parameter combination is new and needs to be explained. With the present available X-ray data we are limited in providing self consistent models but would like to present these new results to the community.
7.2. LBQS 0102-2713 as a supersoft quasar
The object might exhibit the steepest photon index reported from a quasar so far. For a simple power law fit with neutral absorption left free in the fit we get photon indices of by using the xselect command line interface and the EXSAS software package, respectively. However, if the foreground value is set to the Galactic value of (Dickey & Lockman, 1990) the photon index is about 3.5 (c.f. the contour plots shown in Fig. 3). The photon index still remains steep compared to previous studies listed in Section 1. In addition, Puchnarewicz et al. (1995) applied a broken power law fit to RE J2248-511 with a photon index of up to the break energy of 0.26 keV. The Galactic value was fixed to . For the object RE J1034+396 Puchnarewicz et al. (1995) obtain for their broken power law fit a value of up to a break energy of 0.41 keV. The value was fixed to the Galactic value of . We note that the low values, although fixed to their Galactic values, result in similar steep photon indices as obtained for LBQS 0102-2713 with the value fixed in the fit.
7.3. Open problems
There are open problems which cannot be solved given the present set of multiwavelength data. First, we found that the UV emission is discontinuous to the X-ray emission, e.g. the UV photons which are expected to arise from the accretion disc appear not to be correlated with the X-ray photons. Second, if the steep soft photon index of will be confirmed by new X-ray observations this steepness needs to be explained. Based on the contour plots shown in Fig. 3, the object might not be as extreme as one would expect from the simple power law fits. Third, the UV luminosity density is about a factor of 10 more luminous compared to the mean of the most luminous SDSS quasars. However, as pointed out there is a large spread in the magnitudes for quasars and the UV brightness might also show a large scatter compared to the mean value at a certain frequency. Finally, if the 2 keV X-ray weakness is confirmed by other observations, the combination of UV brightness, X-ray weakness and the absence of significant absorption by neutral matter results into an unusual combination observational parameters which cannot be explained with the available set of multiwavelength data. Finally, what is the spectral complexity in the soft and hard X-ray band unresolvable for ROSAT? We know from observations with the present generation of X-ray telescopes that new spectral components can often be added to the fit and that the real spectrum might be more complex. We expect to see this in the soft band with higher signal-to-noise observations. In addition, observations above 2.4 keV are required to better constrain physical models for the unusual observational parameters detected in LBQS 0102-2713.
8. Security check
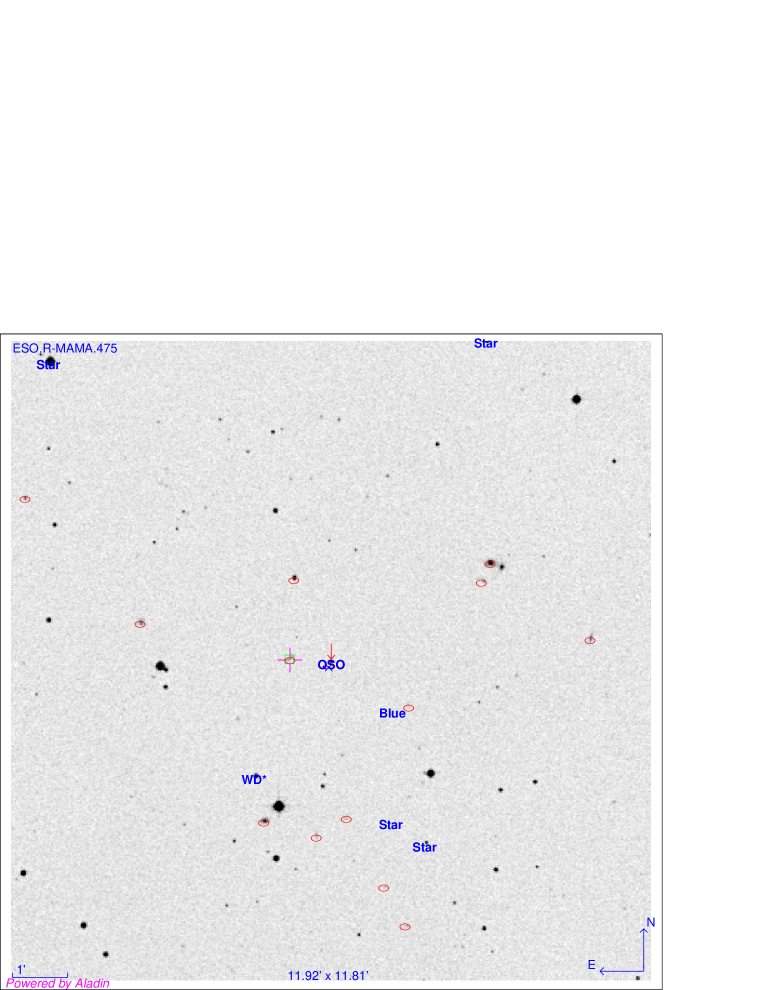
The probability that the X-rays arise from nearby sources is low. The total 1 position error of the ROSAT detection is 7 arcsec including a 6 arcsec systematic error (see Voges et al. 1999 and the link to the source catalogue entries). The nearest SIMBAD source has a distance to the position of LBQS 0102-2713 of 84 arcsec resulting into a discrepancy of 12 in the position offset. The same holds for the NED detections. The next source is at a distance of 0.8 arcmin resulting into a position error offset of about 7 . In Fig. 8 we show the optical image with the SIMBAD and NED detections overlayed. In Tables 3 and 4 we list objects within a distance of 500 arcsec to the position of LBQS 0102-2713.
References
- (1) Boller, Th.; Brandt, W.; & Fink, H.; A&A, 305, 53, 1996
- (2) Boller, Th.; Fabian, A. C.; Sunyvaev, R.; Trümper, J.; Vaughan, S.; Ballantyne, D. R.; Brandt, W. N.; MNRAS, 329, 1, 2002
- (3) Brandt, W.; Mathur, S.; & Elvis, M.; MNRAS, 285, 25, 1997
- (4) Brotherton, M. S.; Arav, Nahum; Becker, R. H.; Tran, Hien D.; Gregg, Michael D.; White, R. L.; Laurent-Muehleisen, S. A.; Hack, Warren, ApJ, 546, 134, 2001
- (5) Crummy, J; Fabian, A.C.; Gallo, L.; & Ross, R.R.; MNRAS, 365, 1067, 2006
- (6) Dickey, John M.; Lockman, Felix J., Ann. Rev. Astron. Astrophys., 28, 215, 1990
- (7) Elvis, M.; Wilkes, B.J.; McDowell, J.C.; Green, R.F.; Bechtold, J.; Willner, S.P.; Oey, M.S.; Polomski, E.; & Cutri, R.; ApJS, 95, 100, 1994
- (8) Fiore, F.; Matt, G.; Cappi, M.; Elvis, M.; Leighly, K. M.; Nicastro, F.; Piro, L.; Siemiginowska, A.; Wilkes, B. J.; MNRAS, 289, 103, 1998
- (9) Gallagher, S. C.; Brandt, W. N.; Chartas, G.; Priddey, R.; Garmire, G. P.; Sambruna, R. M., ApJ, 644, 709, 2006
- (10) Geminale, A.; & Popowski, P.; astro-ph, 2540, 2005
- (11) George, I. M.; Turner, T. J.; Yaqoob, T.; Netzer, H.; Laor, A.; Mushotzky, R. F.; Nandra, K.; Takahashi, T.; ApJ, 531, 52, 2000
- (12) Gibson, Robert R.; Brandt, W. N.; Schneider, Donald P., ApJ, 685, 773, 2008
- (13) Green, Paul J.; Aldcroft, T. L.; Richards, G. T.; Barkhouse, W. A.; Constantin, A.; Haggard, D.; Karovska, M.; Kim, D.-W.; Kim, M.; Vikhlinin, A.; Anderson, S. F.; Mossman, A.; Kashyap, V.; Myers, A. C.; Silverman, J. D.; Wilkes, B. J.; Tananbaum, H., ApJ, 690, 644, 2008
- (14) Hogg, David W.;astro-ph/9905116, 2000
- (15) Hook, I. M.; McMahon, R. G.; Boyle, B. J.; Irwin, M. J., MNRAS, 286, 305, 1994
- (16) Leighly, Karen M.; Halpern, Jules P.; Jenkins, Edward B.; Casebeer, Darrin, ApJS, 173, 1, 2007
- (17) Morrissey, Patrick; Conrow, Tim; Barlow, Tom A.; Small, Todd; Seibert, Mark; Wyder, Ted K.; Budav ri, Tam s; Arnouts, Stephane; Friedman, Peter G.; Forster, Karl; and 13 coauthors, ApJS, 173, 682, 2007
- (18) Morris, Simon L.; Weymann, Ray J.; Anderson, Scott F.; Hewett, Paul C.; Francis, Paul J.; Foltz, Craig B.; Chaffee, Frederic H.; MacAlpine, Gordon M., AJ, 102, 1627, 1991
- (19) Nandy, K.; Thompson, G.I.; Jamar, C.; Monols, A.; Wilson, R.; A&A, 44, 195, 1975
- (20) New Astromomy Reviews 44, 2000, Proceedings of the Workshop on Observational and Theoretical Progress in the Study of Narrow-Line Seyfert 1 Galaxies, held in Bad Honnef, Germany, December 8-11, 1999, WE-Heraeus-Seminar 226, Eds.: Th. Boller, W.N. Brandt, K.M. Leighly, M.J. Ward
- (21) Osterbrock, D. E.; Pogge, R. W., ApJ, 297, 166, 1985
- (22) Pounds, K. A.; Done, C.; Osborne, J. P., MNRAS, 277, 5, 1995
- (23) Puchnarewicz, E. M.; Mason, K. O.; Cordova, F. A.; Kartje, J.; Brabduardi, A. A.; Puchnarewicz, E. M.; Mason, K. O.; Cordova, F. A.; Kartje, J.; Branduardi-Raymont, G.; Mittaz, J. P. D.; Murdin, P. G.; Allington-Smith, J., MNRAS, 256, 589, 1992
- (24) Puchnarewicz, E. M.; Branduardi-Raymont, G.; Mason, K. O.; Sekiguchi, K., MNRAS, 276, 1281, 1995
- (25) Puchnarewicz, E. M.; Mason, K. O.; Siemiginowska, A.; Cagnoni, I.; Comastri, A.; Fiore, F.; Fruscione, A., ApJ, 550, 874 2001
- (26) Richards, G.; Lacy, M.; Storrie-Lombardi, L.; Fan, X.; Papovich, C.; Gallagher, S.; Hall, P.;Hines,D.; Anderson, S.; Jester, S.; Schneider, D.; Vanden Berk, D.; Strauss, M.; York, D., ApJS, 357,261, 2006
- (27) Richstone, D.O.; & Schmidt, M.; ApJ, 235, 361, 1980
- (28) Schurch, N.; & Done, C.; MNRAS, 371, 81, 2006
- (29) Strateva, Iskra V.; Brandt, W. N.; Schneider, Donald P.; Vanden Berk, Daniel G.; Vignali, Cristian, AJ, 130, 387, 2005
- (30) Tanaka, Boller & Gallo; In: Growing black holes: accretion in a cosmological context, Proceedings of the MPA/ESO/MPE/USM Joint Astronomy Conference held at Garching, Springer, ISBN 3-540-25275-4,2005
- (31) Vanden Berk, Daniel E.; Richards, Gordon T.; Bauer, Amanda; Strauss, Michael A.; Schneider, and 60 coauthors, AJ, 122, 549, 2001
- (32) York, D., HST Proposal 6007, Comparision of Large Scale Structure in QSO Absrobers and Galaxies at the Galactic Poles, 1990
- (33) Vignali, C.; Brandt, W.N.; & Schneider, D.P.; AJ, 125, 433, 2003
- (34) Voges, W.; Aschenbach, B.; Boller, Th.; Bräuninger, H.; Briel, U.; Burkert, W.; Dennerl, K.; Englhauser, J.; Gruber, R.; Haberl, F.; and 10 coauthors, A&A 349, 289, 1999
- (35) Walter, R.; & Fink, H., A&A 274, 105, 1993
- (36) Weedman, Daniel W., Quasar astronomy, 1986qa, book, 1986
- (37) Zheng, Wei; Kriss, Gerard A.; Telfer, Randal C.; Grimes, John P.; Davidsen, Arthur F., ApJ, 475, 469, 1997
- (38) Zimmermann, U.; Becker, W.; Belloni, T.; Döbereiner; S., Izzo, C.; Kahabka, P.; & Schwentker, O., MPE Report 257, 1994
| ROR number | Date | Observation duration [sec] |
|---|---|---|
| 700121p-0 | January 5, 1992 | 6157 |
| 700121p-1 | June 5, 1992 | 2191 |
| 700121p-2 | December 8, 1992 | 6724 |
| xselect | EXSAS | |||||||
|---|---|---|---|---|---|---|---|---|
| norm | norm | |||||||
| ROR number | ||||||||
| 700121p-0 | ||||||||
| 700121p-2 | ||||||||
| merge data set |
| Identifier | dist(arcsec) | type | ICRS (2000) coord. | Sp type |
|---|---|---|---|---|
| HB89 0102-272 | 0.00 | QSO | 01 04 40.94 -26 57 07.5 | - |
| 1RXS J010441.1-265712 | 5.44 | X | 01 04 41.10 -26 57 12.5 | - |
| PHL 7126 | 84.37 | blu | 01 04.60.00 -26 58 00.0 | - |
| 675 | 148.54 | WD* | 01 04 47.00 -26 59 12.0 | - |
| GEN +6.20077018 | 184.71 | * | 01 04.60.00 -27 00 00.0 | - |
| GSGP 1 | 220.57 | * | 01 04 33.30 -27 00 23.0 | - |
| CGG* SGP 51 | 384.71 | * | 01 04 28.60 -26 51 20.0 | G5 |
| GSA 55 | 425.46 | G | 01 04 27.00 -27 03.50.0 | - |
| CGG* SGP 68 | 444.42 | * | 01 05 03.80 -26 51 45.0 | G5 |
| RG 0102.6-2720 | 484.81 | * | 01 05.00.00 -27 04 00.0 | - |
| Object Name | RA | DEC | Type | z | dist |
| (arcmin) | |||||
| LBQS 0102-2713 | 01h04m40.9s | -26d57m07s | QSO | 0.780000 | 0.0 |
| 2dFGRS S212Z160 | 01h04m44.3s | -26d57m05s | G | 0.113844 | 0.8 |
| APMUKS(BJ)B010210.33-271359.0 | 01h04m34.7s | -26d57m55s | G | 1.6 | |
| 2dFGRS S213Z276 | 01h04m44.0s | -26d55m38s | G | 0.128000 | 1.6 |
| APMUKS(BJ)B010215.35-271559.7 | 01h04m39.7s | -26d59m55s | G | 2.8 | |
| 2dFGRS S213Z278 | 01h04m28.9s | -26d55m40s | G | 0.127000 | 3.0 |
| 2MASX J01044626-2659591 | 01h04m46.3s | -27d00m00s | G | 0.156813 | 3.1 |
| APMUKS(BJ)B010217.75-271619.8 | 01h04m42.1s | -27d00m16s | G | 3.1 | |
| 2MASX J01042726-2655252 | 01h04m28.2s | -26d55m20s | G | 0.128500 | 3.4 |
| 2dFGRS S213Z275 | 01h04m56.4s | -26d56m26s | G | 0.158043 | 3.5 |
| APMUKS(BJ)B010212.20-271714.6 | 01h04m36.6s | -27d01m10s | G | 4.2 | |
| 2dFGRS S212Z166 | 01h04m20.1s | -26d56m42s | G | 0.129330 | 4.7 |
| APMUKS(BJ)B010210.57-271755.8 | 01h04m34.9s | -27d01m51s | G | 4.9 | |
| APMUKS(BJ)B010241.39-271015.9 | 01h05m05.7s | -26d54m12s | G | 6.3 | |
| APMUKS(BJ)B010215.35-271953.3 | 01h04m39.7s | -27d03m49s | G | 6.7 | |
| 2dFGRS S212Z165 | 01h04m28.9s | -26d50m54s | G | 0.112910 | 6.8 |
| 2dFGRS S212Z164 | 01h04m32.8s | -26d50m11s | G | 0.128985 | 7.2 |
| APMUKS(BJ)B010245.29-270904.2 | 01h05m09.6s | -26d53m01s | G | 7.6 | |
| APMUKS(BJ)B010251.36-271413.7 | 01h05m15.7s | -26d58m10s | G | 7.8 | |
| MDS ua-01-09 | 01h04m35.0s | -27d04m54s | G | 0.611600 | 7.9 |
| APMUKS(BJ)B010224.51-270526.6 | 01h04m48.9s | -26d49m23s | G | 8.0 | |
| APMUKS(BJ)B010252.42-271158.3 | 01h05m16.7s | -26d55m55s | G | 8.1 |