Lattice model calculations on aqueous acetone and tetramethyl urea
Abstract
Self-organization of aqueous acetone and tetramethylurea, caused by lyotropic phase transformations, is studied in frames of the Ising model. Using lattice Monte Carlo simulations, the concentration dependent mixing schemes in these solutions are confirmed and the molar fractions corresponding to the transitions between the mesophases of these mixing schemes are theoretically calculated.
I Introduction
In our study, we select two mixtures, aqueous solutions of acetone and tetramethyl urea, where hydrogen bonding or the longer range dipole-dipole coupling plays an illustrative role in revealing structure properties of water.
Both these co-solvents are miscible with water over the entire concentration range and at all temperatures between ( is the gas constant) and boiling points. There is no lyotropic micellar phases, as the co-solvent molecules are rather small and globular in shape. Still, according to thermodynamic data, three composition regions can be identified in these mixtures, in each of which the mixing scheme is qualitatively different from those in other regions. The structures and interactions within these regions are certainly defined by the features of the constituent molecules, and can be roughly expressed in the following way.
In the region of low concentration of the co-solvent, a small number of AC molecules are bound together by C=O dipole attraction more tightly than in pure acetone, and for TMU solution, molecules are bound together by dipole attraction, respectively. In solution, such a cluster enhances the hydrogen bond network of in its immediate vicinity, with concomitant reduction in the hydrogen bond probability of bulk away from solute. So, such a regions were introduced as concerning to Mixing Scheme I Koga1 . In the most surfactant-rich region, AC/TMU molecules form clusters in exactly the same manner as in pure liquid AC/TMU, in which AC/TMU molecules are bound together not only by / dipole but also van der Waals interaction. To the clusters of pure AC/TMU, molecules interact as a single molecule. Hence, there is no hydrogen bond network of liquid . This is Mixing Scheme III Koga1 . Mixing Scheme II is operative, in which the solution consists of two kinds of clusters each reminiscent to I and III. The transition from Mixing Scheme I to II is associated with an anomaly in a thermodynamic quantity, and it occurs in a narrow mole fraction range.
For TMU, the effect of was studied ref3 . TMU molecules directly participate in forming the hydrogen bond network of , presumably via H donor on and H acceptor on , up to almost the saturation. Hence, the hydrogen bond connectivity is not altered by the presence of urea. However, the degree of fluctuations in entropy and volume, characteristic of liquid H2O, is reduced ref3 .
There was found Katya , that in water, two relaxation processes, differing only in activation entropy, may be due to two types of short-range order among molecules linked together by hydrogen bonds. Reorientation of the molecules occurs in structural defects, which allow the orientation of the molecules to change after the rupture a single hydrogen bond. The are two independent relaxation processes correspond to that possible types of defects.
In this work, we compare the behaviors of certain thermodynamical values (an average energy and heat capacity) of aqueous AC and TMU in frames of statistical analysis, which is useful for interpretation or confirmation of the hypotheses on mesomorphism Koga1 . In our modeling, we involve the Ising lattice version of the free energy of the systems, which was carefully studied in respect to numerical Monte Carlo methods Allen . In particular, binary water-surfactant systems are quite enough described (Widom0 -4547 ) via the low-temperature, the mean-field, and other approximations, and which are able to predict a majority mesomorphic states in aqueous solutions and can be tested numerically.
II Ising model and lattice Monte Carlo simulations
The ability to formation of one or another space geometry of phases depends including on a geometry and size of surfactant molecules, i.e. on its volume fraction in a solution. Chemical properties of heads and tails of surfactants, as well as their configuration thereupon, lead to formation of surfaces in solutions. The mesomorphism of aqueous AC and TMU also obeys universal phase behavior in lyotropic transitions, described in 4547 , but a micellar degeneracy and other of these systems is outside of our report.
The presence of some experimental values of chemical potentials of acetone at molar fraction , and for TMU at Koga1 , and in remainder ranges, calculated by the Boissonnas method, which allow as to perform a calculations in the lattice model. Through there are the estimating formulas Koga22 ; 8 on relation the between and in aqueous AC, or a while below, we omit it for the checking of validity of a lattice modeling.
Here, we apply the Ising gas lattice model 4547 , where an each lattice site is assigned a spin variable of face-centered cubic lattice (). Depending on the molar fraction of particles, distributed on a such lattice, we have a vacations, labeled as , water molecules (), and surfactant’s molecules (AC and TMU), which have assigned a variables . We leave non-occupied lattice sites, because of arithmetic demand a total number of molecules in a system should be less or equal than a total number of lattice sites, on which we distribute our system; so we rarely have their coincidence. An orientational properties of surfactants are revealed via the coordinate variable and , where vectors are assigned each s ite of a lattice, and specify the directions from lattice site to , for convenience, . The Hamiltonian of the Ising model is:
| (1) |
where denotes a summation over all distinct pairs of nearest neighbor sites and . The term with coupling represents the isotropic interactions between nearest-neighbor sites. The terms with coupling constant describe the orientation-dependent interaction between a AC/TMU molecule and a neighboring water molecule. There is agreed that correspond to a surfactant orientation with its head pointing toward a neighboring water molecule. The last term gives the chemical potential energy of the AC/TMU molecules. We remain here in the grand canonical ensemble, when the surfactant concentration is controlled by the surfactant (AC/TMU) chemical potential , rather than in the canonical ensemble where the surfactant concentration is fixed. Furthermore bellow, we will use a normalized values of excess chemical potentials , instead of . were calculated and measured (as was reported in Koga1 and references therein) depending on the surfactant mole fraction, they are only free of the linear terms. Such a substitution will not affect on our average energy during Monte Carlo circles, since according to (1), the reciprocal (first and second terms) and ’concentration’ (third term) spin variables are summed up independently from each other.
To simplify the calculations, the Hamiltonian (1) is normalized by the isotropic interactions , and came to the form:
| (2) |
Basing on the results of low-temperature expansion 4547 , we used the calculated relations between and at non-zero temperatures (, where is the Bolzmann factor, and is absolute temperature). In this case, the excess chemical potentials be considered coinciding with the standard ones.
Fortunately, the data of Koga1 and ref8 , cited in Koga1 , allow us to employ the known values of , connected with its molar fraction at as
| (3) |
where is the mole fraction of -component in solution and is the vapour pressure of pure , means AC/TMU molecules, (see Table 1 and Table 2, squeezed from Koga1 ).
| 1.000 | 0.000 | |
|---|---|---|
| 0.770 | 0.223 | |
| 0.580 | 0.580 | |
| 0.350 | 1.200 | |
| 0.223 | 2.300 | |
| 0.175 | 3.000 | |
| 0.100 | 4.000 | |
| 0.000 | 5.000 |
| 0.900 | 0.000 | |
|---|---|---|
| 0.750 | 0.100 | |
| 0.600 | 0.300 | |
| 0.500 | 0.400 | |
| 0.320 | 0.500 | |
| 0.080 | 0.550 | |
| 0.070 | 0.650 | |
| 0.020 | 0.950 | |
| 0.015 | 1.200 |
So we performed our simulations, assigning the number of MC runs per a configuration 106 and the number of thermalization steps equaling . To minimize an energy of a configuration, we used the Metropolis algorithm building-in the Fortran program.
As a trial result, to confirm the presence of a transition states, corresponding to the Ising model 4547 at high temperatures, we exhibit the temperature dependencies of specific heat (Figs. 1, 2) at , which was given from the expansion of the free energy, corresponding to the conditions of the task.


III Results and discussions
In this section, we report and discuss our numerical results based on the model expressed by (1), in order to illustrate mesomorphism of aqueous AC/TMU.
III.1 Thermodynamics and structural schemes
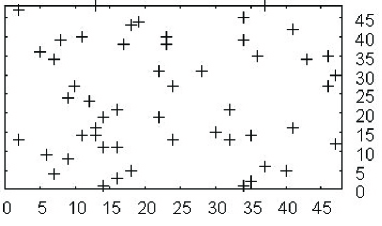
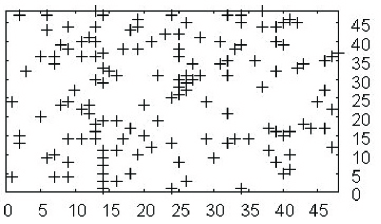
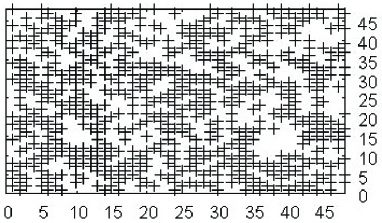
From the Gibbs energy equation, the extensive thermodynamical quantities TS-pV remain after simulations, where is the partial molar entropy, V is the volume of a given binary system. At the constant volume, behaves pro rata a free energy. From Figs. 3, 4, respective smoothness of the average energy, plotted for the aqueous AC and TMU systems, may be obvious. In the real systems, the transition from Mixing Scheme I to II starts at point X at (for AC and TMU) and ends at point Y, Koga1 . However, according to the computer simulations, for both systems, the specific heat exhibits an absent of extremum between the points X and Y (Figs. 5, 6). In our MC tests, for aqueous AC, has a sharp maximum in the vicinity of the ’II-III’ transition (at ), and remains smooth in the region of the ’I-II’ transition. Fig. 7 shows the results of our MC tests, especially some typical disordered states at the Mixing Scheme II between the revealed transitions. Because of irrelevant number of empty lattice sites, only two molecular variables 0 and 1 are visible here. The picture is similar for aqueous TMU as well. Regions with clustered acetone and clustered water molecules are clearly seen.
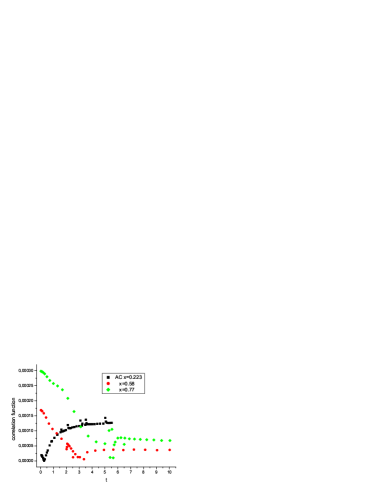
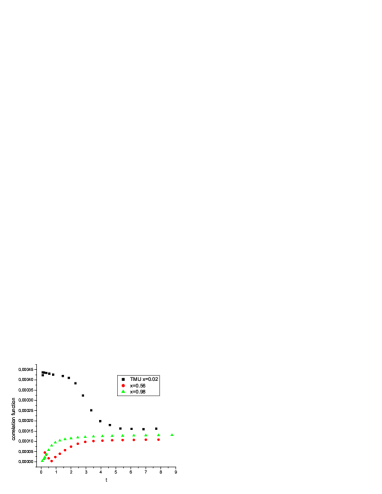
The correlation functions (Fig. 8 and 9 for the systems of ACwater and TMUwater respectively) reflect an order parameter, analogous to the magnetization in a usual Ising magnetic. So, for ACwater, they show the temperature dependence taken at points of a molar fraction x corresponding to the mixing schemes.
At low content of the solvent, 0.2, the order parameter reveals a non-smooth deep phase transition, which promptly reaches a plateau asymptotic with appreciable fluctuations. At an increase of concentration of AC, extremum indicated a phase transition is shifted to an increase of temperature, and an each curve becomes monotonic at a lower value of amplitude, than the foregoing one.
For the AC−water system, our numerical results are comparable with such of 13 , noted in Koga1 , for the concentration dependence of the excess partial molar volume in the ’I-II’ transition point.
For illustration, the results of the AC−AC volumetric interaction function are reported in Koga1 , we note, that the presence of water in our system as additional futures of the diagram of Fig. 8. Analogously for aqueous TMU (Fig. 9), the correlation functions demonstrate three different types of phase behavior, which correspond to three different mixing schemes.
III.2 Experimental evidence of clusterization for aqueous axcetone
For the ’I-II’ transition in AC, the MC results have qualitative correspondence with the statements of Katya , obtained from the dielectric relaxation measurements and chemical analysis, that this is just the phase transition, connected with the second relaxation process at 0.4, at a reorientation of the water molecule, involving a disruption of the inter-molecular hydrogen bonds in the dense structure. However, it is difficult to compare them directly because of different temperature, in which the chemical potentials were determined, and also thereupon that, in Koga1 and references therein, experimental excess chemical potentials were reported, while their total values were used in Katya . For the system ’water – acetone’, coincidence of the calculated above and reported in Katya data for minimum of the free energy at about 0.8 was revealed.


Improvement neutron small-angle scattering measurements and theoretical treatments via the angle-averaged radial distribution functions technique 8 allow us to compare the hypothesis by Koga with the real states of molecular bonding in the case of the ACEwater system.
More exotic independent data on aqueous AC have been reached with positron annihilation spectroscopy 15 ; 16 , where it was confirmed not only the mixing regions of the Koga’s studies, but the mechanism of clusterization was proposed in frames of atomic interactions (hydrogen bonding and so on).
IV Conclusion
In polar aprotic solvents, the links with water are not strong, they are caused, in particular, by hydrogen bonding Katya . This paper answers the question about the role of this bonding in mesomorphism of the whole system. With regards to above statistical analysis, one may confirm the data on dielectric relaxation Katya by revealing of the phase transition at high AC (and TMU) concentrations, and at once, received an absent of coincidences at the low-concentration region. Viz., at the lyotropic structure rearrangement, there is not a distinct phase transition in a system completely. Therefore, the expected structures stay beyond the Ising model description in the region of high molar fraction of AC and TMU, even if it possesses more sensitivity to a transition. In this problem, it is important to separate a knowledge on pure water aggregates (hydrogen networks and cluster structures [3, 4]) and on binary water mixtures (aqueous AC or TMU), comparison the behavior of hydrogen bonding in water with that in solutions may stimulate further advance in the theory of water. Other aqueous aprotic solvents might be also used to contribute such data.
Acknowledgements. The author thanks Balassi Institute for the schoolarship financial supporting and the Neutron Spectroscopy Department of Research Institute for Solid State Physics and Optics of the Hungarian Academy of Sciences for hospitality, and Dr. L. Almásy for useful discussion and his help in writing of the manuscript.
References
- (1) D. H. C. Chen, P. M. Chu, S. H. Tanaka, E. C. H. To, Y. Koga, Fluid Phase Equilibria 175 (2000) 35.
- (2) E. C. H. To, J. Hu, C. A. Haynes, Y. Koga, J. Phys. Chem. B 102 (1998) 10958.
- (3) M. I. Shakhparonov and N. V. Chekalin, Zhurnal Structurnoi Khimii (translated from Russian by Springer) 11 (1970) 599.
- (4) M. P. Allen and D. J. Tildesley, Computer simulation of liquids, Oxford (1987).
- (5) B. Widom, J. Chem. Phys. 84 (1986) 6943.
- (6) M. Laradji, H. Guo, and M. Zukkermann, J. Phys.: Cond. Matt Rev. E. 6 (1994) 2799.
- (7) A. Linhananta and D. E. Sullivan, Phys. Rev. E. 57 (1998) 4547.
- (8) Y. Koga, J. Phys. Chem. 100, 5172 (1996).
- (9) A. Perera, F. Sokolić, L. Almásy, P. Westh, Y. Koga, J. Chem. Phys. 123 (2005) 024503.
- (10) W. G. Beare, G. A. McVicar, J. B. Ferguson, J. Phys. Chem. 34 (1930) 1310.
- (11) A. N. Smirnov, V. B. Lapshin, A. V. Balyshev, I. M. Lebedev, and A. V. Syroeshkin, Electrinoc Journal Issledovano v Rossii (2004) 413–428, zhurnal.ape.relarn.ru/articles/2004/038.pdf, in Russian.
- (12) L. Boje, Aa. Hvidt, J. Chem. Thermodyn 3, 663 (1971).
- (13) J. Talamoni, J. C. Abbe, G. Duplatre, L. Kawka, A. Haessler, Radiat. Phys. Chem. 19, (1982) 467.
- (14) V. M. Byakov, V. I. Grafutin, O. V. Ilyukhina, G. G. Myasischeva, F. G. Nichiporov, S. V. Stepanov, O. P. Stepanova, Yu. V. Funtikov, Khimiya Vysokih Energii (in Russian) 38, (2004) 471.