WinBioinfTools: Bioinformatics
Tools for Windows High Performance Computing Server 2008
A Joint Project between Microsoft Egypt, Cairo Microsoft Innovation
Center, and Nile University
Abstract
Open source bioinformatics tools running under MS Windows are rare to find, and those running under Windows HPC cluster are almost non-existing. This is despite the fact that the Windows is the most popular operating system used among life scientists. Therefore, we introduce in this initiative WinBioinfTools, a toolkit containing a number of bioinformatics tools running under Windows High Performance Computing Server 2008. It is an open source code package, where users and developers can share and add to. We currently start with three programs from the area of sequence analysis: 1) CoCoNUT for pairwise genome comparison, 2) parallel BLAST for biological database search, and 3) parallel global pairwise sequence alignment. In this report, we focus on technical aspects concerning how some components of these tools were ported from Linux/Unix environment to run under Windows. We also show the advantages of using the Windows HPC Cluster 2008. We demonstrate by experiments the performance gain achieved when using a computer cluster against a single machine. Furthermore, we show the results of comparing the performance of WinBioinfTools on the Windows and Linux Cluster.
Availability:
WinBioinfTools is open source package available at the Nile University Bioinformatics Server (http://www.nubios.nileu.edu.eg/tools/WinBioinfTools) and at CodePlex (http://winbioinftools.codeplex.com).
1 Introduction
Recent research in molecular biology requires strong computational support to cope with the ever increasing amount of biological data. Bioinformatics is the area of science concerned with the development of computational tools and methods for the analysis and management of biological data. Currently many biologists use bioinformatics tools as an essential part of their analysis either to generate hypotheses before going to lab or to analyze the resulting data. This practice is clearly of great benefit to speed up research process. However, it is in many cases not feasible due to two reasons: First, most bioinformatics tools are written for Unix/Linux operating systems, whereas life scientists are familiar more with the windows environment. Second, these tools are not easily adapted to run under compute cluster, which hinders the running of compute intensive jobs.
In this paper, we introduce WinBioinfTools, a toolkit containing a number of bioinformatics software tools running under Windows HPC cluster 2008. WinBioinfTools is the result of an interoperability project between some open source projects (CoCoNUT and others) that were already developed for the community by Mohamed Abouelhoda (from Nile University) and between Microsoft Egypt and Cairo Microsoft Innovation Center. In this pilot phase of WinBioinfTools, we decided to start with three basic tools used in analyzing and comparing genomic sequences. These tools include
-
1.
CoCoNUT, which is used for comparing whole genomic sequences,
-
2.
BLAST, which is used for searching biological databases, and
-
3.
An implementation of the standard sequence alignment algorithm.
In this paper we discuss how the tools mentioned above were ported to run under Windows and how they were adapted to run over the cluster architecture. Moreover, we present some experimental results showing that the performance of the tools on a cluster is superior to that on a single machine. Furthermore, we report results about comparing the performance of the Windows based versions of these tools to the corresponding Linux versions.
Advantages of using Windows HPC Server 2008
The experimental results we obtained and our experience in using the Linux and Windows platform show the following advantages for Windows HPC server 2008:
-
•
It is easier to download than Linux based systems; ant out of the box solution with rich and informative documentation
-
•
It is very user friendly, even the layman whose focus is on using readymade tools and focusing solely on data analysis can handle it in a straightforward way. Moreover, the GUI saves user time and relieves those users with no computational background from writing sophisticated command lines.
-
•
The Windows cluster management tools and the job scheduler is very user friendly with intuitive interface and efficiency in practical implementation.
-
•
The MS-MPI (Microsoft implementation of MPI) runs smoothly through the Visual Studio, i.e., easy to compile and run. It also has the feature to run virtually over many cores. Furthermore, the debugging features of the Visual Studio 2008 which support development of parallel algorithms are very helpful and speed up the development cycle, compared to the traditional Linux based MPICH2 and the native Linux debuggers.
Regarding performance, we noticed that the Windows versions of these tools are comparatively equal to the Linux versions and in some instances slightly slower. The latter observation is in large part attributed to differences in the underlying IO methods of the operating system and not to the High Performance Computing components. (HPC components are basically responsible for communication between nodes and the job scheduler.) It is also attributed to some extent to the fact that the native code of those applications was written specifically on Linux. Hence, more tweaking of the code is needed after porting to optimize the performance.
2 Overview of the tools and algorithms
2.1 Sequence alignment
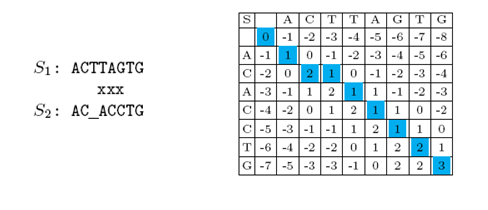
In computer science terminology, a DNA sequence is a string over an alphabet of 4 characters, where each character corresponds to a chemical unit called nucleotide. A protein sequence is also modeled as a string over an alphabet of 20 characters, where each character corresponds to a chemical unit called amino acid. A basic problem in bioinformatics is to find the regions of sequence similarity and difference among biological sequences. In biology, similar regions refer to common function and origin, while different regions refer to traits unique to the respective organism. Biologists call the differences between sequences mutations, where in a mutation event one nucleotide (character) replaces another one in the other sequence or one nucleotide (character) is deleted/inserted from/in a sequence. In computer science, these types of differences are modeled as edit operations, where replacements are called mismatches if the characters are different, insertion/deletions are called indel (or also gaps),and common characters are called matches. The computational model of identifying the differences is called alignment, where one sequence is drawn on a line and the other on another line such that the matching/mismatching characters are put above each other, and gaps are represented by a special symbol, like ”-” or ”_”. Figure 1 (left) shows an example of two sequences aligned together. If each of the edit operations is assigned a score, then the alignment can be scored by summing the individual edit operation scores. An optimal alignment is the one of highest score. For example, if a match scores 1, a mismatch scores -1, and a gap scores -1, then an optimal alignment will maximize the characters matching each other.
The algorithm of Needleman and Wunsch [6] is based on the dynamic programming paradigm to efficiently compute an optimal alignment for two sequences, where an optimal alignment can be decomposed into optimal sub-alignments. More precisely, for two sequences (of length ) and (of length ), the alignment at position in and in R can be computed in terms of optimal alignment at positions and . Let denote the cost of a match, denote the cost of a mismatch, and denote the cost of a gap, and let denote the score of an optimal alignment ending at position in and in . Let , , for all , , the following recurrence computes an optimal alignment.
The intermediate optimal scores of this recurrence can be stored in a table (2D alignment matrix), where an entry tabulates the optimal score at positions in and in . The matrix is filled starting from the cell in a row-wise, column-wise, or diagonal-wise fashion until reaching position , where the optimal alignment score is retrieved. Note that according to the recurrence given above, computing the score at position in the matrix depends on the score at positions , , . Figure 1 (right) shows an example of an alignment matrix.
The running time and space consumption of this algorithm is quadratic, and a computing cluster provides a good solution to this problem, especially when memory consumption presents a bottle neck.
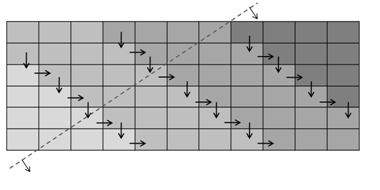
The idea of a cluster based algorithm is to divide the alignment matrix over the cluster nodes and let each node compute the recurrence for that portion of the matrix [5]. The matrix can be filled in a diagonal-wise fashion, where the master node can synchronize the diagonal moves between all nodes. Note that at the boundaries of the matrix portions, some nodes need to exchange messages to find out the values in certain cells. Figure 2 illustrates the process of filling the alignment matrix over four cluster nodes.
Parallel sequence alignment on Windows HPC Server 2008
We developed a version of the global sequence alignment algorithm that runs under cluster platform. Note that this type of using cluster platform is categorized as compute cluster where the cluster nodes cooperate and exchange messages to solve the problem. We used MPI to share values among the cluster nodes and to synchronize the tabulation process. We implemented a Linux based version and a Windows based version and compared the performance of one version to the other on a single machine and on a cluster of four nodes, see Section 4.
2.2 CoCoNUT
The genome is the total DNA in a cell. In higher organisms, like humans, the genome is divided into many units called chromosomes. Genome comparison boils down to identifying regions of similarity and difference among two or multiple genomes, where the common regions should have common function and the different regions can refer to features unique to the respective genome. The task of comparing genomes is complicated by three factors:
-
•
Large genome sizes, where the simplest bacterial genomes are in the range of Mega characters and higher organisms can reach the multi Giga character range.
-
•
Rearrangement events, where segments of the genome change order and direction.
-
•
Mutation events, where the similar regions might contain character replacement, and/or deletion/insertion.
To cope with the large genomic sequences, CoCoNUT [1] finds regions of high similarity using the anchor-based strategy that is composed of three phases:
-
1.
Computation of fragments (short exact matches among genomic sequences). This step is efficiently carried out using the enhanced suffix array (implemented in third party packages like Vmatch or genometools).
-
2.
Computation of highest-scoring chains of collinear fragments (chains are defined below). Each of these highest scoring chains corresponds to a region of similarity. The fragments in each of such chains are the anchors. These chains are efficiently computed using the program CHAINER [2].
-
3.
Post processing the resulting chains, which includes, e.g., visualizing and aligning the regions between the anchors of a chain using the standard dynamic programming algorithm.
The rationale of generating fragments is that the regions harboring fragments are regions of potential similarity, while those regions containing no fragments are different and are excluded from further processing. To assert that the fragments actually constitute regions of similarity and did not appear by chance, they are further processed by the chaining algorithms.
The chaining step is the core of the CoCoNUT system. Here we explain more about the chaining problem and the algorithm solving it. Given two genomes, a fragment is a similar region between the two genomes. More precisely, we use fragments of the type maximal exact matches defined as follows. If is the string representing the first genomic sequence and , a maximal exact match is a pair of substrings and such that the characters of these two strings are identical (i.e., and and , i.e., the match cannot be extended to the left and to the right in the two strings simultaneously. For a fragment corresponding to the maximal exact match of the substrings and , we write to denote the position at which the fragment starts in the first genomic sequence and write to denote the position at which the fragment ends in the second genomic sequence. In a two dimensional space, where the first sequence is the -axis and the second sequence is the -axis, a fragment can be represented by a rectangle whose extreme corner points are and . In the first phase of CoCoNUT we compute all maximal exact matches of length at least using the genometools package.
A chain of fragments is a sequence of fragments such that for any two successive fragments and , we have and . The score of this chain is , where is its length, i.e., . The chaining problem (also known as sparse dynamic programming problem) is to find, given a set of fragments, a chain C with highest score. The program CHAINER can find this highest scoring chain using techniques from computational geometry. It uses the line sweep paradigm, where the fragments are scanned with respect to one dimension. When a start point of a fragment is scanned we search for a fragment at which a highest scoring chain ends. The end point of this fragment should lie in the region bounded by the origin point and the currently scanned start point. This search is carried out efficiently by arranging the end points of the fragments in a kdtree and using a range maximum query over it, see [2, 1] for more details.
Porting CoCoNUT to run on Windows HPC Server 2008
CoCoNUT was originally written to run on Linux. Therefore, we need to port it to the Windows environment. The porting of CoCoNUT involves three modules: 1) fragment generation, 2) chaining, and 3) and plot generation to the windows environment. These modules are integrated in a single program interface written in Perl. The Perl based interface handles options and module parameters, and performs also input/output format transformation needed to integrate the different modules. The details of porting the three modules to Windows are as follows.
-
1.
The first module is based on a third party package called genometools, which is open source package available at www.genometools.org. For compiling and building this package to run under windows, we investigated the application of the SUA tool distributed with the Windows HPC Server 2008 and open source package Cygwin. Using Cygwin, the genometools package could be compiled with minor modifications in the compilation options (basically we switched off the fpic option). Once compilation is completed, genometools can run through either the Cygwin or SUA interface. (SUA can be used to compile Linux/Unix native applications, but this did not work smoothly with genometools, because of some missing libraries.)
-
2.
The second module is based on the program CHAINER, which was readily compiled using SUA and Cygwin, or any gcc compiler under Windows. A version of it was also compiled using Visual Studio.
-
3.
The third module currently visualizes the resulting chains by producing a 2D plot of the comparison. This visualization step is achieved by running the open source gnuplot program. In next version, we plan to add a module for producing detailed alignment.
The correctness of the porting steps was verified by comparing the results of the windows version to the Linux based version. Performance comparison over a single node and a cluster of four nodes was also done and the results will be reported in the next section.
The system CoCoNUT was wrapped to run under Windows cluster to distribute all pairwise comparisons, given two multi-chromosomal genomes, on the cluster nodes (i.e., running in a load balancing mode). The job scheduler of the Windows HPC Server 2008 was used as the underlying cluster engine to achieve this task. Another version of the cluster based CoCoNUT was implemented to run under Linux Cluster. We compared the performance of the two versions of CoCoNUT by comparing human chromosomes to mouse chromosomes. The two versions run on the same hardware. The result of this comparison is given in the results section.
3 BLAST
A biological database is a collection of DNA or protein sequences. Given a biological sequence, usually a short one, the program BLAST is used to find sequences similar to it. Note that searching a database can be done using the standard alignment algorithm mentioned above, where the query sequence is aligned to each sequence in the database. But the running time is prohibitive, so the program BLAST [3], which implements a heuristic algorithm, is used for this task. BLAST finds the similar sequences in a time proportional to the database length and it is very fast in practice. BLAST is the most popular software tool in Bioinformatics and it is available as open source.
In biological applications, the program BLAST is required to answer millions of queries, emerging either from remote users or from certain newly sequenced DNA/protein segments. Since the time in which BLAST finds similar sequences to a query is proportional to the database length, it is ideal to use compute clusters to divide (segment) the database and distribute each query job over the cluster nodes; the results are then collected back to the master node [4].
Parallel BLAST on Windows HPC Server 2008
We developed a wrapper for BLAST (called parallel BLAST) that runs under Windows cluster. Specifically, we wrote a program that performs database segmentation and distributes the queries over the cluster nodes. We implemented two versions of this program to run under the Windows cluster: one using MPI and one using the job scheduler. We also implemented another version running under Linux and based on the MPI. In fact, handling BLAST queries can be done through the job scheduler with no need to write a specific MPI program. But the reason why we used MPI here is to measure communication time for answering queries, a parameter that cannot be measured through job schedulers. The result of comparing the two versions based on MPI is given in the section about the experimental results.
4 Experimental results
We performed experiments to compare the running time of the Windows cluster versions of our programs to the corresponding versions running under Linux Cluster. The experiments we performed addressed the load balancing feature of the Windows cluster by testing the Windows job scheduler and they also addressed the compute cluster feature by testing the Microsoft MPI implementation against the open source MPI implementation MPICH2. We used Visual Studio 2008 for compiling MPI based applications with the option ”Profile Guided Optimization” set on. The programs were executed on Windows with the option ”-affinity” set on in the job submission command line. The hardware setting for the experiments is given in Appendix I. The cluster setting for Windows is as follows: Windows HPC Server 2008 (production version), MS-MPI with Network direct for running MPI applications, affinity was set to 8 on each node (we have 2 Quad core processors). (We did not use OpenMPI in our code.) The Linux cluster runs on the same hardware, where the Windows cluster runs (dual boot configuration). We used openSUSE Linux 10.3 as Linux operating system and used MPICH2 v.1.0.8 for MPI. We used MPD as process manager within MPICH2. In the coming subsection, we present the results of testing the load balancing feature. Then in the next subsection we show the results of testing the MPI feature.
| Database | Type | Description | Size (GB) |
|---|---|---|---|
| Drosph | DNA | Sequences from the drosophila genome | 0.12 |
| pataa | Protein | Patented protein database | 0.17 |
| est_others | DNA | EST database without human/mouse entries | 0.37 |
| env_nr | Protein | Environmental protein sequences | 1.6 |
| nr | protein | Non-redundant protein database | 4 |
4.1 Testing load balancing features of the Windows HPC Server 2008
Querying BLAST
Table 1 shows the different databases we used to test the parallel version of BLAST. From each database, we sampled 1000 query sequences; these were taken at random from the database. We then launched each query back over the respective database. The running times are the time of answering the total 1000 query. This experiment was conducted over a single node and a cluster of four nodes, see Table 2. The communication time was the time needed to send the queries to the four cluster nodes. From the table, we can see that the running times on both operating systems are comparable, and the Linux version is faster for larger databases. But we think that this advantage of the Linux Cluster becomes less relevant as more nodes are added to the cluster due to the following. The query time is proportional to the database size and the higher the number of nodes, the less database size on individual nodes, and the more reduced query time, which will ultimately lead to almost equal running time. Unfortunately we could not verify this claim, because the number of nodes available at CMIC is four.
| Database | One node | 4 nodes with com. time | 4 nodes without com. time | com. time | ||||
|---|---|---|---|---|---|---|---|---|
| Win | Linux | Win | Linux | Win | Linux | Win | Linux | |
| Drosoph | 0.08 | 0.06 | 0.038 | 0.023 | 0.0235 | 0.0188 | 0.0145 | 0.0042 |
| Pataa | 0.5 | 0.4 | 0.1344 | 0.1 | 0.0184 | 0.014 | 0.116 | 0.086 |
| est_others | 1 | 0.8 | 0.5799 | 0.421 | 0.0343 | 0.035 | 0.5456 | 0.386 |
| env_nr | 18 | 15 | 4.0308 | 3.5132 | 0.5308 | 0.5132 | 3.5 | 3 |
| Nr | 27 | 24 | 7.2077 | 6.1163 | 0.4077 | 0.6163 | 6.8 | 5.5 |
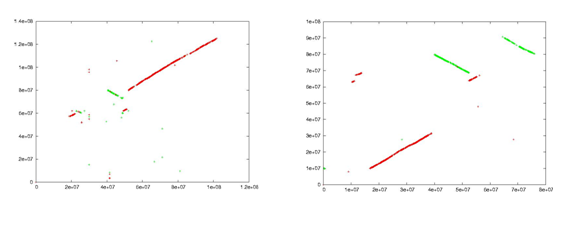
All against all comparisons using CoCoNUT
We compared some of the human chromosomes to some of the mouse chromosomes. We have a total of 20 comparisons. Figure 3 contains the resulting 2D plots showing the common regions between some chromosomes; these plots were automatically generated based on gnuplot. On the windows machine, the total time on a single node was about 47 hours, while on four nodes it was about 12 hours. On the Linux machine, the total time on a single node was about 40 hours, while on four nodes it was 9 hours. The jobs were submitted based on a shell script to run the program on each node over the designated data, which were pre-distributed over the nodes. This time difference between Linux and Windows versions is basically attributed to the fragment generation phase done by genometools, which must be compiled under Cygwin. Although we ran the resulting code using the SUA component of the Windows server 2008, the running time was still higher than that of the Linux version. We think that this is attributed to some wrapping done by Cygwin/SUA around genometools functions. In coming Windows version of CoCoNUT, we plan to replace genometools with our own implementation that compiles and runs directly on Windows without any intermediate layer to reduce the time difference.
4.2 Testing the MPI implementation of the Windows HPC Server 2008
The task of sequence alignment, as mentioned before, requires that the cluster nodes participate in tabulating the optimal partial results until reaching the final optimal result. We implemented a parallel version of this algorithm using MPI. We generated random sequences of different sizes and compared the Windows cluster based implementation against the Linux based implementation. Table 3 shows the running times in seconds for different sequence lengths and with/without the communication time. From the table, it can be seen that the version on the Linux cluster is slightly faster, and this is not attributed to the underlying cluster technology but to the time on the single nodes.
5 Conclusions and future work
Windows HPC Server 2008 is a very useful tool for research and development labs. It gives researchers the opportunity to actually focus their time and effort on research itself, leaving all the technical details and setup for the system. Its ease of download and installation underlines the ”out-of-the-box reputation” it has, unlike Linux systems, where command line and script knowledge is needed to setup the system and the applications running on it. Also, running a job on Windows HPC server 2008 can be achieved through an intuitive GUI, which leaves time for the researchers to focus on the analysis.
For developers building parallel programs, the debugging capabilities of Visual Studio 2008 are very attractive. They allow and support the development of parallel algorithms and speed up the development cycle of new applications.
As for the speed of execution on Windows HPC server 2008, it is comparative to that on Linux. In our specific experiments, the results show that the speed on Windows HPC server is impacted, in some instances, by the use of intermediate layers instead of having a code that compiles directly in Windows and by intensive I/O and memory access.
Extension and follow-up work
After completing this stage of the project, we think that the following extensions will improve the performance and usage of the tool.
-
•
It is planned to build a standalone fragment generation package with multi-core and cluster architecture support to replace or enhance the currently used genometools. This package will be faster, light weight, and run directly on Windows without the need to any middleware, like SUA or Cygwin. This tool can be provided to the users as a standalone package, which could be used in applications other than CoCoNUT.
-
•
It is desirable to provide other options of CoCoNUT such as detailed alignment on the character level, multiple genome comparison, repeat analysis, and EST/cDNA mapping.. We hope to develop these features in a future version.
| Length | One node | 4 nodes with com. time | com. time | 4 nodes without com. time | ||||
|---|---|---|---|---|---|---|---|---|
| Win | Linux | Win | Linux | Win | Linux | Win | Linux | |
| 0.0034 | 0.0023 | 0.0018 | 0.001 | 0.0362 | 0.0161 | 0.0007 | 0.0001 | |
| 0.04 | 0.039 | 0.014 | 0.01 | 0.1527 | 0.0177 | 0.005 | 0.003 | |
| 3.9 | 2.67 | 1 | 0.8 | 0.1423 | 0.152 | 0.3 | 0.2 | |
| 8.4 | 7 | 2.6 | 2 | 1.19 | 1.28 | 1.1 | 0.7 | |
| 18 | 16 | 8 | 7 | 3.679 | 3.7939 | 2 | 2 | |
| 40 | 37 | 15 | 13.3 | 4 | 3.8 | 11 | 9.5 | |
Acknowledgement
We would like to thank Nohal Radi and Ahmed Al-Jeshi for their support in establishing a mutual lab and in “putting in action” the interoperability “capabilities” between the different systems and entities involved. We thank also Tamer Shaalan for administrating the cluster in CMIC and Ayman Kaheel for his support from CMIC. And special thanks to the Microsoft HPC development team for their useful guidance and feedback. This project was funded by a grant from Microsoft.
References
- [1] M. Abouelhoda, S. Kurtz, and E. Ohlebusch. CoCoNUT: An efficient system for the comparison and analysis of genomes. BMC Bioinformatics, 9:476, 2008.
- [2] M.I. Abouelhoda and E. Ohlebusch. CHAINER: Software for comparing genomes. In Proc. 12th International Conference on Intelligent Systems for Molecular Biology/3rd European Conference on Computational Biology, 2004.
- [3] S. F. Altschul, W. Gish, W. Miller, E. W. Myers, and D. J. Lipman. A basic local alignment search tool. Journal of Molecular Biology, 215:403–410, 1990.
- [4] A.C.E. Darling, L. Carey, and W.-C. Feng. The design, implementation, and evaluation of mpiBLAST. In Proceedings of the 4th International Conference on Linux Clusters: The HPC Revolution and ClusterWorld Conference & Expo, 2003.
- [5] A.R. Galper and D.R. Brutlag. Parallel similarity search andalignment with the dynamic programming method. Technical Report KSL 90-74, Stanford University, 1990.
- [6] S. B. Needleman and C. D. Wunsch. A general method applicable to the search for similarities in the amino-acid sequence of two proteins. Journal of Molecular Biology, 48:443–453, 1970.
Appendix I
Hardware specs of the cluster at Cairo Microsoft Innovation Center
We used NEXXUS Personal Cluster, model number NEXXUS4080AL, with total memory of 64 GB and total storage of 1750 GB. The details are as follows:
| Item Type | Item Description | Qty |
|---|---|---|
| Chassis | NEXXUS 4080AL Desk-side Chassis | 1 |
| Compute Shelve | Compute Shelve AL/EN (Including Power Supply) | 4 |
| Motherboard | Intel S5000AL Motherboard - 1333MHz FSB | 4 |
| Processor | Xeon Quad-Core E5410 2.33 12M 1333 MHz - 80W | 8 |
| Memory Type 1 | 2GB FBDIMMS DDR2 667 ECC/Reg. | 32 |
| Hard Drive | HDD Raid 500GB, 7200rpm, 16MB, SATA II NCQ | 2 |
| Hard Drive | HDD Raid 250GB, 7200rpm, 16MB, SATA II NCQ | 3 |
| Heat Sink | High Performance Passive Heat Sink | 8 |
| Riser Card | PCI/Express Riser Card | 4 |
| KVM/USB | Integrated KVM/USB Switch | 1 |
| Gigabit Switch | Integrated 16 Port GigE Switch | 1 |
| Power Cord | Power Cord USA/JPN 15Amp ROHS Compliant | 1 |