X-ray spectral evolution of the extragalactic Z-source, LMC X-2
Abstract
We present the results obtained by a detailed study of the extragalactic Z source, LMC X-2, using broad band Suzaku data and a large ( ksec) data set obtained with the proportional counter array (PCA) onboard RXTE. The PCA data allows for studying the complete spectral evolution along the horizontal, normal and flaring branches of the Z-track. Comparison with previous study show that the details of spectral evolution (like variation of Comptonizing electron temperature), is similar to that of GX 17+2 but unlike that of Cyg X-2 and GX 349+2. This suggests that Z sources are heterogeneous group with perhaps LMC X-2 and GX 17+2 being member of a subclass. However non monotonic evolution of the Compton y-parameter seems to be generic to all sources. The broad band Suzaku data reveals that the additional soft component of the source modelled as a disk blackbody emission is strongly preferred over one where it is taken to be a blackbody spectrum. This component as well as the temperature of seed photons do not vary when source goes into a flaring mode and the entire variation can be ascribed to the Comptonizing cloud. The bolometric unabsorbed luminosity of the source is well constrained to be ergs/sec which if the source is Eddington limited implies a neutron star mass of 1.6 M⊙. We discuss the implications of these results.
keywords:
accretion,accretion discs - X-rays:binaries - X-rays:individual:LMC X-21 Introduction
Low-mass X-ray binaries containing accreting weakly magnetised neutron stars exhibit luminosity and spectral variations on time scale of hours to days and are usually divided into two classes: Z and atoll sources (Hasinger and van der Klis, 1989). This classification relies upon the path traced out by individual sources in the X-ray colour-colour diagram (CD) or hardness-intensity diagram (HID). CD is constructed by plotting the hard colours (ratio of count rates in two largest energy bands) against soft colours (ratio of count rates in two lowest energy bands). HID is constructed by plotting hard colour against intensity. Z-sources trace out an approximate ‘Z’ shaped path in the CD and HID with the three branches named as the horizontal branch (HB), the normal branch (NB) and the flaring branch (FB). Spectral analysis of UV data which is modelled as reproduced X-ray emission from an outer disk, indicates that the bolometric luminosity and hence the mass accretion rate increases along the Z-track from HB to FB through NB (Hasinger et al., 1990; Vrtilek et al., 1990). However, more direct estimation of the bolometric luminosity has proved to be difficult since that requires both broad band data and a reliable distance estimate. Nevertheless, there are indications that Z-sources have luminosities comparable to the Eddington limit. There are nine Z-sources known, including the recent discovery of a transient galactic X-ray binary (Homan et al., 2007). Two of them LMC X-2 (Smale and Kuulkers, 2000; Smale, Homan & Kuulkers, 2003) and RX J0042.6+4115 (Barnard et al., 2003) are extragalactic ones.
The radiative processes that produce the X-ray spectra of neutron star LMXBs are not well constrained. While, there have been attempts to have detailed theoretical model based on the accretion flow (e.g. Psaltis Lamb & Miller, 1995), in general, two different phenomenological approaches have been adopted to model their spectra. In both these approaches, the spectrum is modelled as sum of two main components, one arising from an accretion disk and the other from the boundary layer between the disk and the neutron star surface. In the first approach (sometimes referred to as the “Western” approach), the accretion disk is considered to be a standard cold disk emitting a soft component, while the boundary layer radiates the harder Comptonized component (Mitsuda et al., 1984, 1989; Di Salvo et al., 2002; Agrawal and Sreekumar, 2003). In the second approach (called the “Eastern” approach), the boundary layer emits a cool black body emission while the harder Comptonized component arises from an hot inner disk (White et al., 1986; Di Salvo et al., 2000, 2001). There is also evidence for a variable hard power-law component in the spectra of five Z-sources (Asai et al., 1994; Di Salvo et al., 2000, 2001, 2002; D’Amico et al., 2001). The two approaches are difficult to distinguish primarily due to the absence of good quality low energy (- keV) data and the uncertainty in the absorption column density.
To understand the phenomenology of these sources, it is important to study their complete spectral evolution in order to confirm any generic behaviour and to see if there are sub-classes of sources that have similar spectral evolution. There is already some evidence that Z-sources may not be an homogeneous group. This was first indicated by Kuulkers & van der Klis (1996); Kuulkers et al. (1997) who classified them into ’Sco’ and ’Cyg’ like sources. Detailed study of spectral evolution along the Z-track has been carried out for GX 349+2 (Agrawal and Sreekumar, 2003), Cyg X-2 (Di Salvo et al., 2002), GX 17+2 (Di Salvo et al., 2000) and GX 340+0 (Church, Halai & Blaucinska-Church, 2006). In general, there is considerable variation of the spectral parameters as a source moves along the Z-track and the variations are not always similar in all sources, indicating that Z sources are not an heterogeneous group. For example, as Cyg X-2 moves from the HB to NB, the optical depth of the Comptonized component decreases while the electron temperature increases dramatically from to keV. A more modest increase in electron temperature from to is seen in GX 349+2. On the other hand, for GX 17+2 the temperature decreases along the same track. Along the flaring branch, detailed spectral evolution study has only been undertaken for GX 349+2 (Agrawal and Sreekumar, 2003) where the temperature increases along the track. While these results indicate that the physical parameters and conditions for these sources are different, what seems to be generic is that the effect of Comptonization decreases along the normal branch while it increases along the flaring branch. This is revealed by the variation of the Comptonization parameter , where kTe is electron temperature, me is rest mass of electron, is speed of light, and is optical depth of corona. The Comptonization parameter decreases along the normal branch and increases along the flaring one, a behaviour clearly seen in GX 349+2.
| OBSID | Start Date | End Date | Duration |
|---|---|---|---|
| (ksec) | |||
| 50041-01-01-** | 2001 Feb 10 | 2001 Feb 14 | 145 |
| 60027-01-01-** | 2001 Aug 30 | 2001 Sep 3 | 144 |
| 60027-01-02-** | 2001 Dec 13 | 2001 Dec 16 | 122 |
| 60027-01-03-** | 2002 Feb 01 | 2002 Feb 06 | 148 |
| 70017-01-**-** | 2002 Aug 22 | 2002 Oct 30 | 185 |
The temporal properties of Z-sources are also known to correlate with the position of the source in the Z-track. Three different kinds of quasi-periodic oscillations (QPOs) have been seen in these sources. QPO with frequency 15-100 Hz, which appear in the horizontal branch (but sometimes seen up to the upper part of the normal branch), are called horizontal branch oscillations (HBO). The frequency of an HBO increases from top left to bottom right of the horizontal branch (Homan et al., 2002; Wijnands et al., 1997). QPO with frequency 5-15 Hz are observed in the normal and the flaring branch, and are called normal-flaring branch oscillations (Homan et al., 2002). These low frequency oscillations have been seen in all the galactic Z-sources except GX 349+2 where instead broad peaked noise is observed (Agrawal and Bhattacharyya, 2003; O’Neill et al., 2002). The third type of QPO are kHz ones (300-1200 Hz) which are observed in all the branches. The frequency of kHz QPO increases along the Z-track from HB to FB (van der Klis, 2000)
Early observation of LMC X-2 showed that its luminosity varies from to 1038 erg s-1 (Market & Clark, 1975). LMC X-2 was identified as a Z-source when it traced out a complete Z-track during 2001-2002 RXTE observations (Smale, Homan & Kuulkers, 2003). Its optical counterpart is a faint blue star (Pakull, 1978) typical of other LMXB. Simultaneous optical and X-ray observations of this source have revealed that X-ray and optical emission are correlated with a time delay of 20 s (McGowan et al., 2003). A brief ( ksec) XMM-Newton observation of this source can be described by a disk blackbody, with inner disk temperature Tin keV and a blackbody component with temperature 1.5 keV (Lavagetto et al., 2008). However, the source is bright enough to cause pile up in XMM-Newton observations, making such spectral analysis difficult. No QPO has been detected in LMC X-2, perhaps due to low statistics data.
 |
 |
 |
 |

 |
 |
LMC X-2 provides an unique opportunity to understand the spectral evolution of Z sources and the radiative processes that occur in such sources. The distance ( kpc) to the source (Freedman et al., 2001; McClintock and Remillard, 2003) is much less uncertain than those of galactic sources enabling a more accurate estimation of its intrinsic luminosity. The Galactic column density along the line of the source is cm-2. This provides a firm lower limit to the absorption which can provide constrains on spectral models. The source has been extensively observed by the Rossi X-ray Timing Experiment (RXTE) for a good time duration of ksec. This allows the construction of elaborate CCD and HID diagrams and a detailed study of its spectral evolution. In addition, a ksec observation by Suzaku reveals the broad band spectrum (- keV) of this source which allows models to be differentiated and the bolometric luminosity to be estimated.
In this paper, we report the results of spectral analysis of RXTE in §2 and Suzaku data in §3. In §4, we summarise the main results and discuss the implications.
2 RXTE OBSERVATIONS
2.1 Colour-Colour and Hardness Intensity Diagrams
LMC X-2 was observed by RXTE during 2001-2002 for a total good time of 750 ksec. The Observation log is shown in Table 1. We have analysed the data collected by Proportional-Counter-Array (PCA) which operates in 2-60 keV energy band and consists of five proportional counter units with a total effective area of 6500 cm2 (Jahoda et al., 1996). The analysis was done using PCA standard-2 mode data. Since only two of the five proportional counter units (PCU0 and PCU2) were reliably on all through the observation, only data from these PCUs were selected for analysis. We define soft colour as ratio of count rates in the 4.5-6.5 keV and 2.5-4.5 keV energy bands and hard colour as that in the 9.8-18.5 keV and 6.5-9.8 keV bands. The CD, generated using 512 sec average counts, for different observations are plotted in Figure 1. In Figure 2(a), the combined CD for all the observations is plotted. The result is similar to that obtained by Smale, Homan & Kuulkers (2003), except that the present analysis is for a larger data set. We define overall colour as ratio of count rates in the 6.5-18.5 keV and 2.5-6.5 keV bands. The Hardness Intensity Diagram (HID) was constructed by plotting the overall colour against the 2.5-18.5 keV counts/sec/2PCUs and is plotted in Figure 2(b). Since there was no gain changes after 2000 there was no need to normalise the intensities and colours.
As seen in Fig 2(a), the horizontal branch (HB) for this source is neither horizontal nor distinct. The classification requires study of other spectral relationships like HID which is shown in Fig 2(b). The HID of LMC X-2 is quite similar to that seen for another well studied Z-source GX 17+2 (see Fig.1 of Homan et al. 2002). In the HID of GX 17+2, the slanted branch (almost vertical) at the top left is called the horizontal branch and we do a similar identification for LMC X-2. We divide the HB in the HID, into two region HB1 and HB2 and mark the corresponding location in the CD. The normal and flaring branch are distinct in the CD. Thus, we are able to identify all three branches for LMC X-2. For spectral studies, the Z-curve has been divided into eight regions. Two for the horizontal branch (HB1 and HB2), two for the normal branch (NB1 and NB2), a normal/flaring branch vortex point (N/FBV) and three regions for the flaring branch (FB1, FB2 and FB3). All eight regions have been marked out in Fig 2(a).
2.2 Spectral Evolution
We extracted spectra corresponding for the eight regions in the CD to carry out a a detailed spectral evolution study. We added 1 % systematic error to all the spectra to take in to account the uncertainty in the PCA response matrix.
A single component Comptonization model (compTT in XSPEC; see Titarchuk 1994) with absorption provided adequate fit to all the PCA spectra in the energy range - keV. Since the data is for energies keV, the absorbing column density is not well constrained. Hence we adopt a constant value of N based on the Suzaku analysis reported in section 3. An iron emission line centred at 6.4 is also required to improve the fit. In the top panel of Fig.3 we show the observed count rate spectrum for HB1, along with the best fit model. The residuals (in units of ), with and without inclusion of systematic error are shown in the middle and bottom panels respectively. The PCA data suggests that the soft component, originating either from the disk or from the boundary layer, is absent above 3 keV.
The spectral parameters of compTT component evolve significantly as the source moves along the Z-track. The best fit parameters at different parts of Z-track have been listed in Table 2 and evolution along the track has been plotted in Fig. 4. The electron temperature decreases as the source evolves from HB to lower part of FB. This variation is different from that seen in GX 349+2 (Agrawal and Sreekumar, 2003) and Cyg X-2 (Di Salvo et al., 2002) where the opposite behaviour was found. On the other hand it is similar to that observed in GX 17+2 (Di Salvo et al., 2000). As LMC X-2 moves along the flaring branch the temperature increases which again is in contrast to the behaviour observed for GX 349+2 where the temperature decreases. However what seems to generic is that effect of Comptonization decreases along the normal branch while it increases along the flaring branch. This is revealed by variation in Comptonization parameter y=4(kTe/mec2) which decreases along the normal branch and increases along the flaring one (Fig. 4) a behaviour also seen in GX 349+2. In the flaring branch as increases the spectrum is that of saturated Comptonization with peak 6 keV.
| HB1 | HB2 | NB1 | NB2 | N/FBV | FB1 | FB2 | FB3 | |
|---|---|---|---|---|---|---|---|---|
| 0.47 | 0.55 | 0.61 | 0.62 | 0.59 | 0.61 | 0.62 | 0.58 | |
| 2.74 | 2.60 | 2.45 | 2.24 | 1.95 | 1.94 | 2.00 | 2.07 | |
| 13.37 | 12.90 | 12.59 | 12.99 | 14.47 | 15.71 | 16.51 | 18.13 | |
| 3.83 | 3.38 | 3.04 | 2.96 | 3.19 | 3.74 | 4.26 | 5.32 | |
| /dof | 17.7/29 | 17.2/29 | 15.5/29 | 12.7/29 | 30.1/29 | 15.6/29 | 16.2/29 | 19/29 |
3 SUZAKU OBSERVATION
3.1 Colour-Colour Diagram and Light curves
Suzaku observed LMC X-2 for a good time duration of 119 ksec on 2006 April 24 and 25. The observatory (Mitsuda et al., 2007) consists of two different types of instrument, the X-ray Imaging Spectrometer (XIS; Koyama et al. 2007) and Hard X-ray Detector (HXD; Takahashi et al. 2007 ).
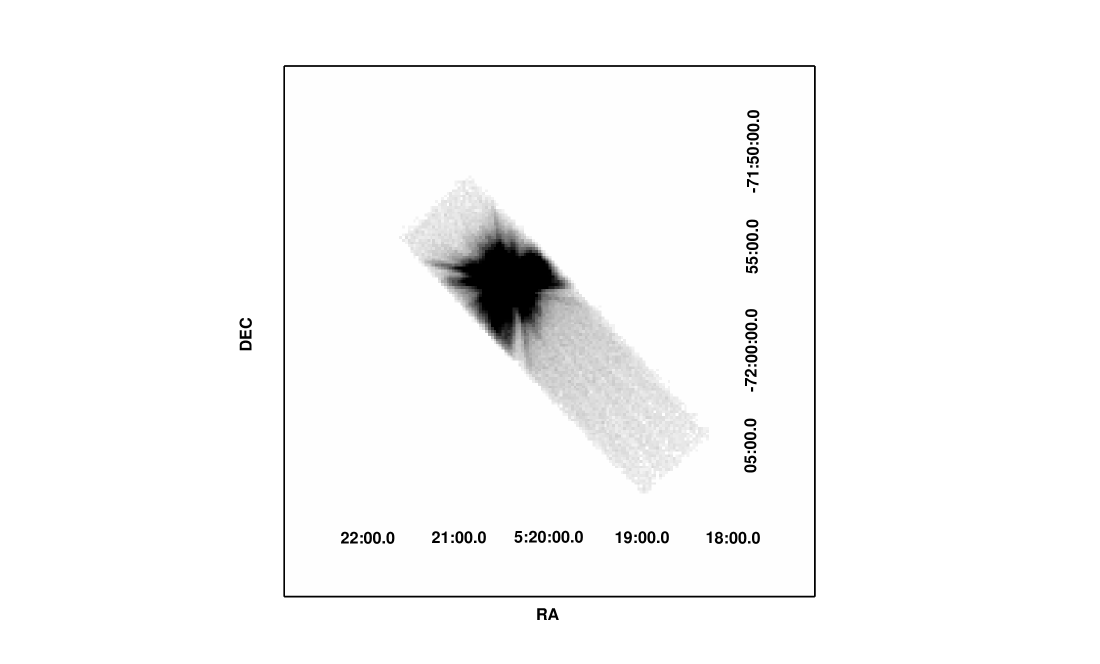
There are four XIS units (named XIS0, XIS1, XIS2, XIS3), each of them is a 1024 1024 pixel CCD and covers an energy range of 0.3-12 keV. HXD consists of two types of detectors, the Si diode detector (PIN) and the Gadolinium silicate crystal (GSO). The PIN diode covers an energy range of 10-70 keV while the GSO scintillators are sensitive in 40-600 keV band. The XIS data were collected in normal mode with 1/4 window option. The minimum bin time available in this mode is 2 seconds. The cleaned XIS event files were used to obtain the light-curves and spectra. The XIS image is shown in Fig. 5. The source light-curves were extracted using 4 radius centred at source position.

.

.
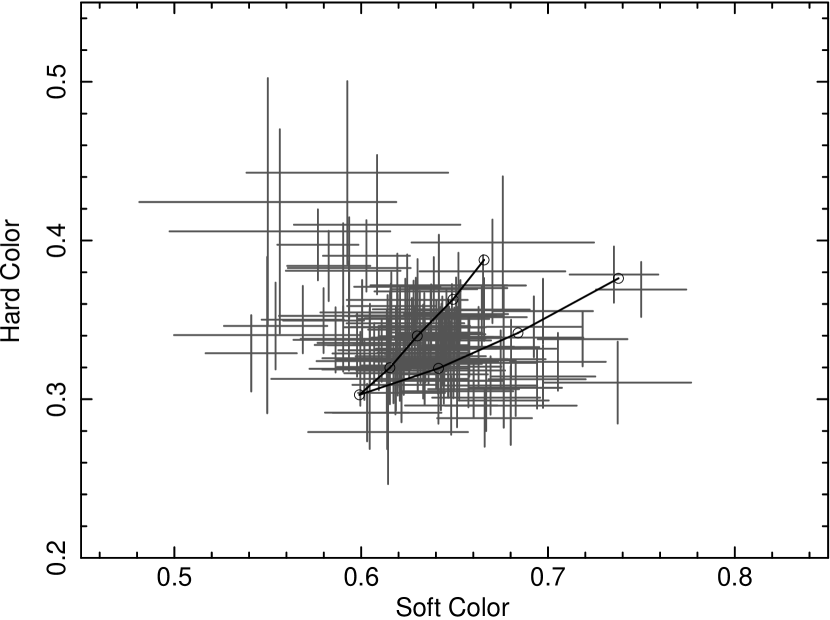
To compare with RXTE observations, we study the colour and intensity properties of the counts at energies 3 keV. Fig. 6 shows the colour-colour diagram for the Suzaku data using three energy bands defined as 3-4.5 keV, 4.5-6.5 keV and 6.5-10 keV. The data points corresponds to 512 sec averages. Superimposed on the figure is the simulated colour-colour diagram, obtained using the best fit PCA spectral parameters and XIS0 response matrix. In particular, eight fake X-ray spectra were created using the best fit RXTE model parameters (Table 2) using the Suzaku XIS response matrix. The count rates in three energy bands (3-4.5, 4.5-6.5, 6.5-10 keV) were calculated for these eight simulated spectra and the simulated colour-colour diagram was computed. The simulated CD is represented by a solid line connecting the eight points. While it is difficult to differentiate the different branches, the Suzaku data points are consistent with simulated ones. Note that statistical error for these data points are significantly larger than for RXTE data because the 3-10 keV count rates for Suzaku ( 6 counts/sec) is smaller than that for RXTE, 60-150 counts/sec/2PCUs. Comparison with hardness intensity plot generated using RXTE data is more difficult because apart from the statistical uncertainty of Suzaku points, the absolute calibration between the PCA and Suzaku may differ.
The XIS0 light-curve created using 3-10 keV energy band is shown in the top panel of Fig. 7. There are clear flaring like activity where the rate increases by 30 %. Moreover the spectra hardens during the flares as revealed in the bottom panel of Fig. 7 where overall colour is plotted as function of time. The overall colour is ratio of count rates in 5-10 and 3-5 keV energy bands. Thus, we divided the data in two states, a flaring state where the count rate is 7 counts/sec and a non flaring one corresponding to rates 7 counts/s. The low statistics of the data does not allow for more reliable divisions. We identify the flaring state with the flaring branch and the low count rate state as the normal branch.

3.2 Spectral Evolution
We extracted source and background spectra for the flaring and non flaring parts for each of the four XIS units. The latest calibration database was used to create the XIS response. The response matrix files were generated using FTOOLS task xisrmfgen and ancillary response files were generated using the FTOOLS task xissimarfgen.
To analyse the HXD data first we checked for the process version. Since the HXD process version was 2.0.6.13, we reprocessed the data as recommended by the Suzaku team. As a first step to reduction, we ran the command hxdtime to calculate HXD event arrival time correction. Then invariant pulse-heights (PI) were determined using hxdpi. The HXD event grades were calculated using the task hxdgrade. We used standard screening criteria (given in Suzaku ABC guide) to obtain the filtered PIN event files. We also excluded the telemetry saturation period while creating filtered event files. The filtered PIN files were used to create the source spectra for the different flux level and dead time correction was performed to the PIN spectra. As suggested by the HXD team, we used version 1.2 (Method = LCFIT(bgd_d)) background file to create PIN background spectra. Since the PIN background was simulated with a ten times scaled level to decrease the Poisson noise, we have modified exposure keyword by entering a new exposure ten times the original. Since we do not have enough counts above 30 keV, we restricted our analysis to 30 keV and did not use GSO data. We added the data, background and response matrices from the FI (front illuminated) XIS CCDs. We used 0.5-10 keV FI CCDs data, 0.3-10 keV BI (back illuminated) CCD data and 10-30 keV for PIN HXD for combined spectral fitting. We grouped the XIS data to get 3 channel per resolution and added 2 % systmatic error to take into account the uncertainty in the XIS response matrix. While spectral fitting, we allow for calibration uncertainties between FI CCDs, BI CCDs and PIN HXD.
| Para. | NB | FB |
|---|---|---|
| ( cm-2) | ||
| (eV) | 213 | 215 |
| (eV) | 528 | 530 |
| (eV) | 2180 | 2190 |
| 14.05 | 14.75 | |
| (keV) | 6.4 (fixed) | 6.4 (fixed) |
| (keV) | 0.27 | 0.27 (fixed) |
| EqWidthb (eV) | 20 | 9 |
| Ftest Probc | 7 10-3 | 0.11 |
| d | 0.740.35 | e |
| /dof | 463/375 | 442/374 |
aThe column density was restricted to be larger than the Galactic value of 6.3 1020 cm-2. bThe Equivalent Width of the Iron line. cThe F-test probability for the presence of the Gaussian Iron line. dThe flux of iron line in unit of 10-12 erg/s/cm2. e 90% confidence upper limit on the iron line flux
| Para. | NB | FB |
|---|---|---|
| ( 1020 cm-2) | 8.6 | 8.35 |
| (eV) | 394 | 397 |
| (km) | 993 | 955 |
| (eV) | 660 20 | 67020 |
| (eV) | 2600 | 2490 |
| 11.30 | 12.40 | |
| (keV) | 6.4 (fixed) | 6.4 (fixed) |
| (keV) | 0.56 | 0.44 |
| EqWidtha (eV) | 72 | 36 |
| Ftest Probb | 7.1 10-9 | 2.5 10-4 |
| 1.830.11 | 1.950.12 | |
| 2.100.13 | 2.230.12 | |
| 0.590.04 | 0.600.04 | |
| 1.510.03 | 1.630.03 | |
| 2.60 | 2.98 | |
| 0.54 | 1.73 | |
| /dof | 380/375 | 356/373 |
aThe Equivalent Width of the Iron line. bThe F-test probability for the presence of the Gaussian Iron line. cTotal absorbed luminosity. dTotal unabsorbed luminosity. eUnabsorbed luminosity of disk black body component. fUnabsorbed luminosity of Comptonized component. gThe Comptonization parameter. hThe flux of iron line in unit of 10-12 ergs/s/cm2
The broad band spectra of Suzaku allows for a two component fit to the data. We use a blackbody and Comptonization model (XSPEC model COMPTT) to represent the “Western” model and fit both the flaring and normal branch data sets. A Gaussian representing iron line emission is statistically significant for the normal branch. Since the Galactic neutral hydrogen column density in the direction of LMC X-2 is 6.3 1020 cm-2, we impose this as a lower limit to . The results of spectral fits are shown in Table 3. The best fit gets pegged to the lower limit for both the data sets. The spectral variation is entirely due changes to Comptonization.
We repeat the spectral fitting using disk black body (XSPEC model DISKBB) and the same Comptonization model to represent “Eastern” model. The best fit spectral parameters are shown in Table 4. Here, the column density turns out to be 9 1020 cm-2 above the galactic lower limit. For the normal branch /d.o.f = 380/375 which is significantly better than the one obtained for the “Western” model = 463/375. A similar trend is seen for the flaring branch, where the “Eastern” model gives better /d.o.f = 356/373 as compared to /d.o.f = 442/374. Thus spectral fitting of Suzaku data strongly prefers the interpretation where the soft component is disk emission rather than simple black body. Note that this distinction is possible because of the imposed lower limit on the absorption column density. If the column density is allowed to have any value then a reasonable fit using the black body component is possible. For the model with black body emission, the best fit column density turns out to be 0.013 1022 cm-2 with a /dof = 367/375. For Galactic sources, the column density is more uncertain and hence such distinction would not have been possible even with broad band data.

The spectral fit to the non-flaring state is shown in Fig. 8. Also plotted are the residuals with and without the addition of a systematic error of 2%. The column density is well constrained to 9 1020 cm-2 and it is this value that has been used for fitting RXTE data (Table 2). The inner disk temperature , and the inner disk radius as well as the soft photon input temperature remain invariant between the flaring and normal branches. A broad Iron line is significantly detected for both branches. The electron temperature decreases during the flare, which is consistent with behaviour seen by RXTE, although Suzaku data requires an higher temperature. More significantly it is the Compton y-parameter which is seen to increase during the flare, which is again consistent with the RXTE observations. Using a distance of 50 kpc, the unabsorbed luminosities of flaring and normal branch turn out to be 2.1 1038 ergs/s and 2.2 1038 ergs/s, which for a neutron star correspond to 1.1 and 1.15 of the Eddington value.
4 DISCUSSION
A detailed spectral analysis of the extragalactic source LMC X-2, has been undertaken using broad band data from Suzaku and from a large ( 750 ksec) data set obtained using RXTE-PCA.
From the PCA data the complete Z-track evolution was obtained and spectra at eight representatives position were analysed. In the energy band of the PCA (3-20 keV), a single component Comptonization fit adequately represents the spectra from all the track branches. This is unlike other Z-sources (GX 349+2: Agrawal and Sreekumar 2003; Cyg X-2: Di Salvo et al. 2002), where an additional soft component is required in the RXTE energy band. The temperature of Comptonizing cloud, is found to decrease from the horizontal to the normal branch (see Fig. 4) which is similar to what is observed for GX 17+2 (Di Salvo et al., 2000), but is in contrast to results from Cyg X-2 (Di Salvo et al., 2002) and GX 349+2 (Agrawal and Sreekumar, 2003) where the opposite behaviour was found. Along the Flaring branch, the temperature increases for LMC X-2, which is again different from GX 349+2 where the temperature decreases. On the other hand, for LMC X-2 the Compton y-parameter decreases along the horizontal and normal branch and increases along the flaring branch. This is consistent with what is observed for GX 349+2 and it seems to be a generic feature of Z-sources.
These results confirm that while details of the spectral evolution are different for each source, there are generic behaviour like the evolution of Compton y-parameter which seems to be similar in all Z-sources. The hard component evolution similarity between LMC X-2 and GX 17+2 suggests that there could be sub groups within Z sources where similar physical conditions are met. The observed similarity in the spectral evolution seen in these two sources is also suggested in the near identical colour and hardness intensity diagrams of these sources. Similar diagram are also observed in Sco X-1. Hence, our results are consistent with the idea that Z sources can be further divided into two subclasses, ’Sco’ and ’Cyg’ like sources (Kuulkers & van der Klis, 1996; Kuulkers et al., 1997) with LMC X-2 being a member of the ’Sco’ like class. While it was suggested earlier that the difference between ’Sco’ and ’Cyg’ like sources may be due to inclination angle (Kuulkers & van der Klis, 1996), the spectral differences between LMC X-2 and other sources, suggest instead a more intrinsic difference between the two classes. Analysis of Z source XTE J1701-462 reveales that the source evolves from ’Cyg’ like to ’Sco’ like Z-source, suggesting that diffence between these two classes is not caused by difference in the inclination angle (Lin, Remillard & Homan, 2009; Homan et al., 2007) .
The Suzaku data provides broad band spectral and luminosity evolution of the source from the NB to the FB. As expected the data requires an additional soft component. This additional component was represented as a black body (emitted from boundary layer) and as emission from multicolour disk. The multi-colour disk approach (sometimes called the “Eastern” approach) provides significantly better fit to the data. This spectral distinction is possible because the Galactic neutral hydrogen column density along the direction of the source is = 6.3 1020 cm-2 and hence the fitted absorption column density was restricted to be larger than this value. Such a constrain is usually not available for Galactic sources.
The distance to LMC X-2 (502 kpc) is better constrained than those of Galactic sources and hence broad band Suzaku data provides a better estimate of the bolometric luminosity. The unabsorbed luminosity of the source for the normal branch is 2.1 1038 erg/s and for the flaring branch is 2.23 1038 erg/s. Taking into account the uncertainty in the spectral fitting ( 5%), the distance( 5 %) and calibration of different instrument ( 10 %), one can put a highly conservative error estimate of % on these luminosities. If the source reaches its Eddington limit on the normal branch, this would imply that the mass of neutron star is 1.500.1 M⊙. If instead the source is Eddington limited in the flaring branch one obtains a slightly higher mass of 1.610.09 M⊙.
The phenomenological spectral models used in this analysis, a single temperature Comptonized component and a multi-colour disk emission, is adequate considering the statistics of the available data and the uncertainties regarding theoretical models. However, considering that the system is a near Eddington neutron star source, it is expected that the actual radiative processes would be considerably more complicated with possibly quantitative and qualitative differences as compared to the simple model adopted here. For example, detailed structural analysis of the boundary layer reveals a temperature and density stratified extended region (Popham & Sunyaev, 2001).
A fairly detailed model for Z sources is where soft photons produced by electron cyclotron emission in the neutron star magnetosphere are Comptonized primarily in a hot central corona (Psaltis Lamb & Miller, 1995; Psaltis & Lamb, 1997). The outer accretion disk gets converted into a radial flow which also Comptonises the outgoing photons. The phenomenological description in this analysis is broadly consistent with this picture with the temperature and optical depth of the Comptonizing component identified as the average temperature and optical depth of the hot central corona. The source of seed photon for Comptonization which is assumed to be a black body with temperature, in the XSPEC model COMPTT, will then be the electron cyclotron emission. Finally the multi-colour disk component is the outer disk. Note that from Table 4, the seed photon temperature, keV is different from the inner disk temperature, keV and hence in this interpretation the seed photons are not produced by the outer disk. This is consistent with the above model, where the seed photons are produced in the magnetosphere.
A straightforward interpretation of the analysis is that the inner disk radius, does not vary significantly when the source is in a flaring state and at km is about ten times the neutron star radius. The radius may be larger if the colour factor is significantly greater than unity as is assumed for the radius estimation. The luminosity of the disk emission is nearly 25% of the total luminosity and hence gravitational energy dissipation is not sufficient to power the disk. At ten times the star radius, the gravitational energy dissipated should be only 10% or less of the total dissipation. Instead the disk is probably heated by the inner corona and hence radiates such high luminosities. This is expected if the disk is truncated due to the radiation pressure of a near Eddington inner corona. However, contrary to what is seen, in such a scenario, one would expect the inner disk radius and its luminosity should vary as the source goes into a flaring mode. The large inferred inner disk radius argues against the possibility that the broad Iron line detected arises from the disk. Instead, it may be speculated that it arises perhaps from the neutron star surface. Unfortunately, the line is weak (with equivalent width of eV) and hence the statistics is not sufficient to test these ideas by modelling the line profile.
It may also be that the phenomenological models used in this analysis do not sufficiently approximate the complex radiative process of the system. In particular, the soft seed photon input is assumed here to be a black body and this may not be the case. While the high energy spectrum is largely independent of the shape of the seed photon spectrum, the low energy spectrum will depend on its shape. In the framework of a model, the magnetosphere emission could be more complex than a black body. Moreover there could be additional source of seed photons from the outer disk. Such complexities may vary the disk emission parameters or even eliminate the need for the component. However, an arbitrary seed photon spectral shape will not be falsifiable by spectral analysis, since some shape will always be a good representation of the data. A theoretically motivated spectral shape for the seed photon is required. Despite these caveats, the spectral analysis shown in this work does reveal the overall behaviour of the source. Model independently one can still conclude that the lower energy part of the spectrum (which in this case is the seed photon source and the disk component) do not vary as the source flares and the entire variation can be ascribed to the Comptonizing cloud.
The low statistics of the Suzaku data did not allow for a detailed broad band spectral study of the source at it evolves along the Z track. Instead the data was split into two broad parts representing the flaring and non flaring periods. This is unfortunate, because such a broad band evolution study would have been able to test whether the bolometric luminosity increases monotonically along the track as expected by theoretical models and inferred by UV observations. The two main flares observed by Suzaku seem to be of similar strength (Fig 7), however, clearly this needs to be confirmed by longer duration observations. This will have important implications on whether the source is Eddington limited during the flares or not. These deficiencies may be alleviated by a longer duration Suzaku observations undertaken simultaneously with RXTE. The PCA data would distinguish the different track positions, while Suzaku would provide broad band spectra for each position. Alternatively, such results can be obtained by a long duration observation of the source by the forthcoming multi-wavelength satellite, ASTROSAT. The proportional counter array on board (LAXPC) would determine the Z-track, while the UV and other X-ray instruments would give simultaneous broad band coverage.
References
- Agrawal and Sreekumar (2003) Agrawal V.K., Sreekumar P., 2003, MNRAS, 346, 933
- Agrawal and Bhattacharyya (2003) Agrawal V.K., Bhattacharyya S., 2003, A&A, 398, 223
- Asai et al. (1994) Asai K. et al., 1994, PASJ, 46, 479
- Barnard et al. (2003) Barnard R., Kolb U., Osborne J.P., 2003, A&A, 411, 553
- Church, Halai & Blaucinska-Church (2006) Church M.J., Halai G.S., Blaucinska-Church M., 2006, A&A, 460, 233
- D’Amico et al. (2001) D’Amico F., Heindl W.A., Rothschild R.E., Gruber D.E., 2001, ApJ, 547, L147
- Di Salvo et al. (2000) Di Salvo T. et al., 2000, ApJ, 544, L119
- Di Salvo et al. (2001) Di Salvo T. et al., 2001, ApJ, 554, 49
- Di Salvo et al. (2002) Di Salvo T. et al., 2002, A&A, 386, 535
- Freedman et al. (2001) Freedman W.L., Madore B.F., Gibson B.K. et al., 2001, ApJ, 553, 47
- Hasinger and van der Klis (1989) Hasinger G., van der klis M., 1989, A&A, 225, 79
- Hasinger et al. (1990) Hasinger G., van der klis M., Ebisawa K., Dotani T., Mitsuda K., 1990, A&A, 235, 131
- Homan et al. (2002) Homan J., van der Klis M., Jonker P.G., Wijnands R., Kuulkers E., Mendez M., Lewin W.H.G., 2002, ApJ 568, 878
- Homan et al. (2007) Homan J., et al., 2007, ApJ, 656, 420
- Jahoda et al. (1996) Jahoda K, Swank J.H., Giles A.B., Stark M.J., Strohmayer T., Zhang W., Morgan E., 1996, SPIE, 2808, 59
- Koyama et al. (2007) Koyama K., et al., 2007, PASJ, 59, 23
- Kuulkers & van der Klis (1996) Kuulkers E., van der Klis M., 1996, A&A, 314, 567
- Kuulkers et al. (1997) Kuulkers E., van der Klis M., Oosterbroek T., van Paradijs J., Lewin W.H.G., 1997, 287, 495
- Lavagetto et al. (2008) Lavagetto G., Iaria R., D’Al A., Di Salvo T., Robba N.R., 2008, A&A, 478, 181
- Lin, Remillard & Homan (2009) Lin D., Remillard R.A., Homan J., astroph/0901.0031
- McClintock and Remillard (2003) McClintock J.E. & Remillard R.A., 2003, to appear in Compact Stellar X-ray Sources, eds. W.H.G Lewin and M. van der klis, Cambridge University Press
- Market & Clark (1975) Market T.H., & Clark G.W., 1975, ApJ, 196, L55
- McGowan et al. (2003) McGowan K. E., Charles P.A., O’Donoghue D., Smale A.P., 2003, MNRAS,345, 1039
- Mitsuda et al. (1984) Mitsuda K., et al., 1984, PASJ, 36, 741
- Mitsuda et al. (1989) Mitsuda K., Inoue H., Nakamura N., Tanaka Y., 1989, PASJ, 41, 97
- Mitsuda et al. (2007) Mitsuda K., et al., 2007, PASJ, 59, 1
- O’Neill et al. (2002) O’Neill P.M.,Kuulkers E., Sood R. K., van der Klis M., 2002, MNRAS, 336, 217
- Pakull (1978) Pakull M.W., 1978, IAU Circ., 3313
- Popham & Sunyaev (2001) Popham R., Sunyaev R., 2001, ApJ, 547, 355
- Psaltis Lamb & Miller (1995) Psaltis D., Lamb F.K., Miller G.S., 1995, ApJ, 454, L137
- Psaltis & Lamb (1997) Psaltis D., Lamb F.K., 1997, ApJ, 488, 881
- Smale, Homan & Kuulkers (2003) Smale A.P., Homan J., Kuulkers E., 2003, ApJ, 590, 1035
- Smale and Kuulkers (2000) Smale A.P., Kuulkers E., 2000, ApJ, 528, 702
- Takahashi et al. (2007) Takahashi T., et al., 2007, PASJ, 59, 35
- Titarchuk (1994) Titarchuk L., 1994, ApJ, 434, 313
- van der Klis (2000) van der Klis M., 2000, ARA&A, 38, 717
- Vrtilek et al. (1990) Vrtilek S.D., Raymond J.C., Garcia M.R., Verbunt F., Hsinger G., Kurster M., 1990, A&A, 235, 162
- White et al. (1986) White N. E., et al., 1986, MNRAS, 218, 129
- Wijnands et al. (1997) Wijnands R., van der Klis M., Kuulkers E., Asai K., Hasinger G., 1997, A&A, 323, 399