Empirical regularities of opening call auction in Chinese stock market
Abstract
We study the statistical regularities of opening call auction using the ultra-high-frequency data of 22 liquid stocks traded on the Shenzhen Stock Exchange in 2003. The distribution of the relative price, defined as the relative difference between the order price in opening call auction and the closing price of last trading day, is asymmetric and that the distribution displays a sharp peak at zero relative price and a relatively wide peak at negative relative price. The detrended fluctuation analysis (DFA) method is adopted to investigate the long-term memory of relative order prices. We further study the statistical regularities of order sizes in opening call auction, and observe a phenomenon of number preference, known as order size clustering. The probability density function (PDF) of order sizes could be well fitted by a -Gamma function, and the long-term memory also exists in order sizes. In addition, both the average volume and the average number of orders decrease exponentially with the price level away from the best bid or ask price level in the limit-order book (LOB) established immediately after the opening call auction, and a price clustering phenomenon is observed.
keywords:
Econophysics; Order-driven markets; Opening call action; Limit-order book; Microstructure theoryPACS:
89.65.Gh, 02.50.-r, 89.75.Da1 Introduction
Call auction and continuous auction are two main trading mechanisms used in order-driven financial markets. In the call auction market, the orders arriving during the period of opening call auction are batched and executed with a single price, i.e., the opening price established immediately after the opening call auction, while the continuous auction is a process of continuous matching of arriving orders on a one-by-one basis. Much effort has been devoted to study the market performance under these two different types of trading mechanism. Compared with the continuous auction, the call auction has two major advantages. Schnitzlein compared the call and continues auction under asymmetric information in laboratory asset market constructed based on the Kyle model [1], and found that the informed noise traders spend lower costs in the call auction [2]. Qualitatively similar results have been obtained by utilizing different modeling approaches [3, 4]. Theissen further confirmed that in experimental asset market incorporating heterogeneous information the call auction provides lower execution costs [5]. On the other hand, the opening price in the call auction market is closer to the true value of the asset than the opening price in continuous market [5]. These two advantages are also regarded as the goal of market construction [6], and it has been proposed that an electronic call auction could be incorporated into the continuous market to make it more efficient [7].
Nowadays, the call action has been widely used as the opening or closing procedure in most electronic continuous markets. For example, the New York Stock Exchange (NYSE), London Stock Exchange (LSE), Euronext Paris, Frankfurt Stock Exchange (FWB), Tokyo Stock Exchange (TSE), Hong Kong Stock Exchange (HKEX). In this paper we mainly focus on the opening call auction in the Chinese stock market. According to the situation of market transparency defined as “the ability of market participants to observe the information in trading process”, the opening call auction is divided into two categories, i.e., close call (or blind) auction and open call auction. Before July 1, 2006, the opening call auction of the Shenzhen Stock Exchange was close call auction wherein the information about submitted orders is not observable for market participants. It is well accepted that in a sufficient large market the transparency can improve the market efficiency [8, 9]. After July 1, 2006, the opening call auction of the Shenzhen Stock Exchange turned to be open call auction in which the information is opened to market participants the same as the many foreign stock exchanges, e.g. LSE, Euronext Paris, FWB, and HKEX.
Not much work has been done to the study of the opening call auction in the Chinese stock markets. Pan et al. proposed a theoretical model of close call auction, and further analyzed the data of Shanghai Stock Exchange to confirm their theoretical results that the market should increase the transparency in the opening call auction [10]. Li et al. empirically studied the influence of open call auction on the market volatility in the opening of Shenzhen Stock Exchange [11]. Up to now, the close call auction in the opening of Shenzhen Stock Exchange has not been extensively analyzed. The study of the close call auction has potential significance for understanding the influence of transparency on market volatility.
In this paper, we study the statistical regularities of opening call auction for 22 liquid stocks traded on the Shenzhen Stock Exchange in 2003 when the close call auction was adopted. The rest of the paper is organized as follows. In Section 2, we describe briefly the database we analyzed. Section 3 presents the statistical regularities of the order prices in opening call auction. In Section 4, we further analyze the order size in opening call auction. Then we study in Section 5 the limit-order book established by the unexecuted orders left at the end of the opening process. Section 6 summarizes the results.
2 Data sets
The Shenzhen Stock Exchange (SZSE) was established on December 1, 1990 and started its operations on July 3, 1991. It contains two independent markets, A-share market and B-share market. The former is composed of common stocks which are issued by mainland Chinese companies. It is opened only to domestic investors, and traded in CNY. The latter is also issued by mainland Chinese companies, while it is traded in Hong Kong dollar (HKD). It was restricted to foreign investors before February 19, 2001, and since then it has been opened to Chinese investors as well. At the end of 2003, there were 491 A-share stocks and 57 B-share stocks listed on the SZSE. In the year 2003, the opening call auction is held between 9:15 am and 9:25 am, followed by the cooling periods from 9:25 am to 9:30 am, and the continuous auction operating from 9:30 am to 11:30 am and 13:00 pm to 15:00 pm.
Our analysis is based on a database recording the order flows of 22 liquid stocks extracted from the A-share market on the SZSE in the whole year of 2003 when the close call auction was adopted in the opening procedure. The trading system did not show any information about the order flows, and traders submitted orders only according to the closing price of last trading day. The database contains the price, size and associated time of each submitted order recorded in the opening call with the time stamps accurate to 0.01 second. For more details, refer to Ref. [12]. Table 1 depicts the basic statistics of order flows in the opening call auction for 22 stocks. Remarkably, for all the stocks the number of sell orders is larger than the number of buy orders , and the ratio of to varies within the range with the mean value . Moreover, the ratio of the average size of sell orders to the average size of buy orders varies within the range with the mean value . The relative order size is larger than 1 for all the 22 stocks, which indicates that the total size of sell orders is larger than the total size of buy orders. This phenomenon was indeed observed in the bear market during the year 2003 that the market participants were more willing to sell.
| Code | ||||||||
|---|---|---|---|---|---|---|---|---|
| 000001 | 72,685 | 45,719 | 1.59 | 1,800 | 1,428 | 1.26 | 3,630 | 495 |
| 000002 | 48,296 | 24,098 | 2.00 | 2,896 | 2,427 | 1.19 | 290 | 303 |
| 000009 | 41,028 | 19,766 | 2.08 | 2,574 | 1,990 | 1.29 | 1,031 | 253 |
| 000012 | 18,192 | 8,368 | 2.17 | 1,843 | 1,599 | 1.15 | 393 | 112 |
| 000016 | 14,568 | 7,276 | 2.00 | 1,830 | 1,677 | 1.09 | 407 | 91 |
| 000021 | 24,387 | 13,239 | 1.84 | 1,727 | 1,435 | 1.20 | 861 | 157 |
| 000024 | 12,631 | 5,640 | 2.24 | 1,877 | 1,765 | 1.06 | 357 | 77 |
| 000027 | 35,007 | 13,435 | 2.61 | 2,386 | 2,002 | 1.19 | 349 | 203 |
| 000063 | 23,800 | 10,394 | 2.29 | 1,923 | 1,533 | 1.25 | 179 | 144 |
| 000066 | 19,860 | 9,532 | 2.08 | 1,503 | 1,174 | 1.28 | 599 | 122 |
| 000088 | 8,645 | 3,092 | 2.80 | 1,547 | 2,052 | 0.75 | 66 | 49 |
| 000089 | 19,313 | 9,519 | 2.03 | 3,996 | 6,456 | 0.62 | 147 | 122 |
| 000429 | 13,505 | 7,045 | 1.92 | 2,513 | 2,195 | 1.14 | 347 | 86 |
| 000488 | 15,104 | 9,095 | 1.66 | 4,088 | 1,738 | 2.35 | 680 | 101 |
| 000539 | 13,718 | 5,030 | 2.73 | 5,534 | 4,593 | 1.20 | 313 | 79 |
| 000541 | 12,936 | 7,034 | 1.84 | 2,305 | 2,580 | 0.89 | 258 | 83 |
| 000550 | 20,427 | 9,936 | 2.06 | 2,323 | 2,455 | 0.95 | 563 | 127 |
| 000581 | 13,531 | 5,115 | 2.65 | 1,990 | 2,303 | 0.86 | 308 | 78 |
| 000625 | 23,481 | 12,516 | 1.88 | 3,032 | 3,821 | 0.79 | 1,501 | 151 |
| 000709 | 27,200 | 13,324 | 2.04 | 3,818 | 2,881 | 1.33 | 530 | 170 |
| 000720 | 16,433 | 9,536 | 1.72 | 3,118 | 2,318 | 1.35 | 257 | 110 |
| 000778 | 22,771 | 8,858 | 2.57 | 2,415 | 2,639 | 0.92 | 575 | 132 |
3 Order price
3.1 Probability distribution of relative order prices
In the opening call auction, we define the relative order price as the relative difference between the price of a submitted order and the closing price of last trading day,
| (1) |
where is the price of a submitted order at time , and is the closing price of last trading day111Ref. [13] gives a wrong definition of relative price in the opening call auction, since the virtual transaction price is not observable for traders.. The relative price describes the aggressiveness of a submitted order. For buy (sell) orders, positive value of means that the trader is eager to buy (sell) and thus place an order at a price higher (lower) than the closing price of last trading day. Because of the 10% price limit trading rule in the Chinese market, the value of the relative price is restricted to the range .
We first compute the probability distribution of relative order prices to investigate how the traders who are only informed of the closing price of last trading day place their orders in opening call auction. Since all the 22 stocks have similar probability distributions, we aggregate the data and treat all the stocks as an ensemble. Fig. 1 illustrates the PDFs of relative order prices for both buy orders and sell orders.
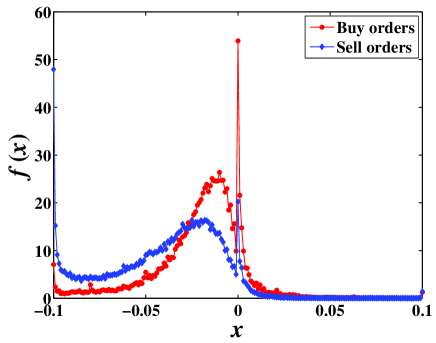
To determine the order price, the trader faces a dilemma and has to balance the certainty of execution on one hand and the potential benefit on the other hand. For buy orders, displays a sharp peak exhibiting a maximum at , and displays a relatively wide peak at negative price as shown in Fig. 1. There are many traders who are eager to execute their trades and place aggressive orders at price close to the closing price to increase the chance of execution, while most of the traders are rational to reduce the cost by placing their orders at prices lower than the closing price. The curve for sell orders shows similar behavior, but exhibits a maxima at which implies that more traders want to sell and place orders at the highest price to minimize investment loss in the bear market. In general, the distributions for both buy orders and sell orders are asymmetric and skewed to the negative part. The congregation of orders placed at may suggest that the closing price of last trading day plays an important role in order price determination in the close call auction.
3.2 Memory effect of relative order prices
Another important characteristic feature of the financial time series is the memory effect. There are many different methods to examine the memory effect in time series analysis. Here we use the detrended fluctuation analysis (DFA) method [14, 15] to investigate the temporal correlation of the relative order price. is expected to scale with as
| (2) |
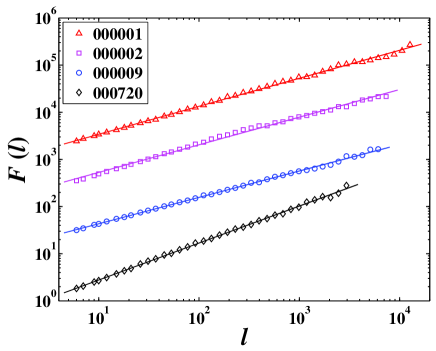
where is known as the Hurst exponent. For the time series is long-term correlated, and for the time series is uncorrelated. In Fig. 2, the fluctuation functions of relative order prices in the opening call auction for four representative stocks are plotted.
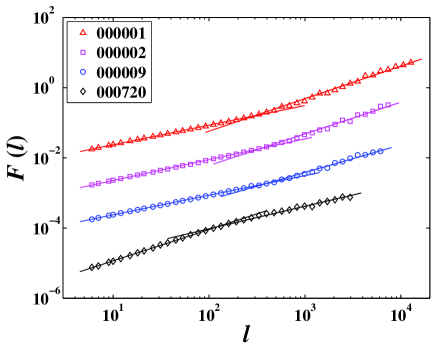
In Fig. 2, we find that the fluctuation function shows two scaling regions for all the four stocks. The solid lines are power-law fits in small scale and large scale regions respectively. To estimate the crossover point which separates the two power-law regions, a simple least-squares estimation method is applied by minimizing the square distance between and its best power-law fits in small scale and large scale regions. For stock 000001, we obtain , and the Hurst exponents are estimated to be in small scale region and in large scale region. Using the same method we obtain and separated at for stock 000002, and separated at for stock 000009, and and separated at for stock 000720. Table 2 depicts the Hurst exponents of relative order prices in both small scale and large scale regions for 22 stocks in the opening call auction.
| Code | Code | ||||||||
|---|---|---|---|---|---|---|---|---|---|
| 000001 | 294 | 0.54 | 000089 | 71 | 0.60 | ||||
| 000002 | 345 | 0.57 | 000429 | 153 | 0.59 | ||||
| 000009 | 397 | 0.55 | 000488 | 180 | 0.64 | ||||
| 000012 | 209 | 0.59 | 000539 | 141 | 0.64 | ||||
| 000016 | 162 | 0.56 | 000541 | 149 | 0.59 | ||||
| 000021 | 253 | 0.54 | 000550 | 211 | 0.57 | ||||
| 000024 | 136 | 0.59 | 000581 | 146 | 0.64 | ||||
| 000027 | 221 | 0.56 | 000625 | 122 | 0.58 | ||||
| 000063 | 235 | 0.59 | 000709 | 134 | 0.59 | ||||
| 000066 | 162 | 0.56 | 120 | 0.82 | |||||
| 000088 | 66 | 0.65 | 000778 | 237 | 0.58 |
According to Table 2, the Hurst exponent in small scale region is slightly larger than 0.5 except for the stock 000720 marked with , which indicates that a relatively weak memory exists in relative order prices. The crossover point varies within the range , where is the average number of daily orders for each stock as depicted in Table 1. This implies that the weak memory effect in the small scale region persists for one or two days and then a crossover occurs. We assume that in the small scale region mainly describes the memory effect of relative order prices within a day. To verify this, we calculate the average daily Hurst exponent , which is defined as follows
| (3) |
where is the daily Hurst exponent calculated by using the relative order prices in the opening of trading day for stock , and is the number of trading days for stock . As shown in Table 2, has values similar to , and consequently verify our assumption. In large scale region, the Hurst exponent has values apparently larger than 0.5 except for the stock 000720. This implies that the memory effect of relative order prices is quite strong within a period of more than one day. It is probably due to the arrival of important news or events which affects investors’ trading behavior and makes them continuously buy or sell within a period of several days or weeks.
4 Order size
4.1 Number preference of order sizes
We then study another ingredient of submitted orders, i.e., order size. The order size plays an important role in the dynamics of price formation [16, 17, 18, 19, 20], as a well-known adage says “it takes volume to move stock prices.” In Fig. 3, we plot the number of submitted orders which have the same size as a function of the order size using the aggregated data of the 22 stocks.
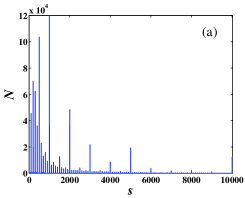
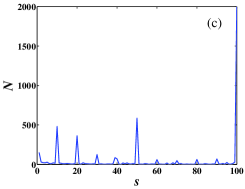
In Fig. 3, one observes that there exists several layers of spikes in the histogram plots of order sizes at different scales. It may be caused by the number preference phenomenon of order sizes similar to the trade size clustering phenomenon which universally exists in finance markets [21, 22, 23, 24]. We name it as order size clustering phenomenon. The traders usually prefer to place orders with size following the formula , where and are integers. Fig. 3 (a) shows the histogram plot of order sizes in a large scale region , and a layer of spikes is displayed with spikes located at , . Fig. 3 (b) shows the histogram plot of order sizes in a smaller scale region , and another layer of spikes is displayed with spikes located at , . The histogram plot of order sizes in a small scale region is shown in Fig. 3 (c), and a similar layer of spikes is observed with spikes located at . It mainly describes the regularity of sell orders, because in Chinese stock markets buy orders must be in a board lot of 100 shares or their multiples, while sales of stocks with less than 100 shares could be made in one order. This phenomenon for call auction is the same as that for continuous double auction [24].
4.2 Probability distribution of order sizes
We normalize the order size by dividing its average value for each stock as , thus the normalized order size is in units of the average order size. We treat the 22 stocks as an ensemble and aggregate the data. The empirical PDFs of normalized order sizes for both buy orders and sell orders are shown in Fig. 4.
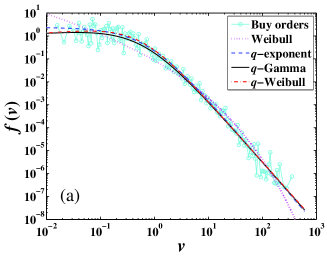
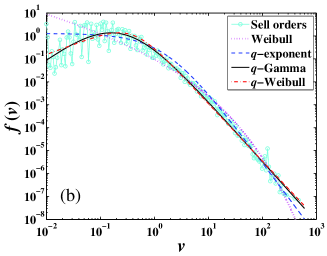
Four types of distribution functions are applied to fit the empirical PDFs using the least-squares method. We first use the Weibull distribution function [25, 26, 27] which follows
| (4) |
where and . The parameters fitted from the empirical PDFs are estimated to be and with the error sum of squares for buy orders, and and with for sell orders.
A -exponential distribution function [24, 28, 29, 30, 31] is defined as
| (5) |
where and . We then use this function to fit the empirical PDFs, and obtain the parameters and with for buy orders, and and with for sell orders.
We also use a -Gamma distribution function [24, 30, 31, 32, 33] defined as
| (6) | |||
where , , , and is a normalized constant. The parameters are estimated to be , and with for buy orders, and , and with for sell orders.
Finally, we use a -Weibull distribution function [27, 31] , which has a form
| (7) |
where , and . We obtain the parameters , and with for buy orders, and , and with for sell orders.
In Fig. 4, the fitted curves of these four types of distributions are also illustrated. It is obviously that the Weibull distribution fits the empirical distribution worse than the -type distributions for both buy orders and sell orders, and it is further manifested by the fact that of the Weibull distribution shows values larger than that of the -type distributions. The -Gamma and -Weibull distributions show very similar behaviors, and they can better approximate the empirical distribution than -exponent distribution especially for small order size. Among all these four types of distributions, the -Gamma distribution can best fit the empirical distribution, since it has the smallest value of .
4.3 Memory effect of order sizes
We also apply the DFA method to investigate the temporal correlation of order sizes. Fig. 5 illustrates the fluctuation functions of order sizes in the opening call auction for four representative stocks. A power law is clearly observed in the whole region of the order size. The Hurst exponent is estimated to be for stock 000001, for stock 000002, for stock 000009, and for stock 000720. Table 3 depicts the Hurst exponents of order sizes in the opening call auction for 22 stocks. The Hurst exponents for all the stocks are larger than 0.5, which indicates that the long-term memory also exists in order sizes.
| Code | Code | Code | |||
|---|---|---|---|---|---|
| 000001 | 000063 | 000550 | |||
| 000002 | 000066 | 000581 | |||
| 000009 | 000088 | 000625 | |||
| 000012 | 000089 | 000709 | |||
| 000016 | 000429 | 000720 | |||
| 000021 | 000488 | 000778 | |||
| 000024 | 000539 | ||||
| 000027 | 000541 |
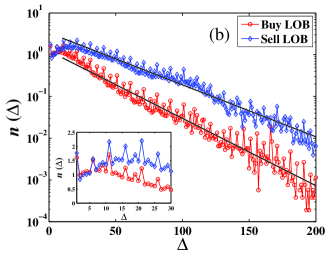
5 Averaged shape of limit-order book (LOB)
At the end of the opening procedure of each trading day, a LOB is established based upon the unexecuted orders left in the open call auction. Price levels are discrete in the LOB. In the Chinese stock market, the tick size defined as the difference between two neighbored price levels is 0.01 CNY. As with this tick size, we define the price level as the distance between the order we considered and the best bid or ask,
| (8) |
where is the order price in the LOB, and and are the best bid price and best ask price respectively. According to Eq. (8), stands for the position at the best bid (ask) in the buy (sell) LOB. We define () as the order size placed at price level in the buy (sell) LOB at day for stock . We aggregate the data of 22 stocks, and calculate the average order size as follows
| (9) |
where is the number of trading days for stock and is the number of stocks analyzed. In our study, . We also consider the number of orders placed at each price level in the LOB. Denote the variable () as the number of orders placed at price level , and the average number of orders () is defined as
| (10) |
We plot the average order size and the average number of orders for both buy LOB and sell LOB in Fig. 6.
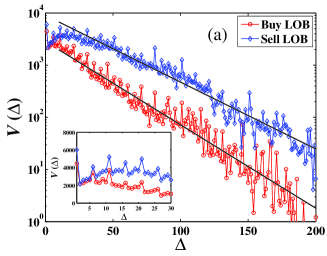
In Fig. 6 (a), follows a linear decrease in linear-log coordinates which implies it may decrease exponentially for both buy LOB and sell LOB
| (11) |
We obtain that for the buy LOB and for the sell LOB. It is clear that the curve for buy LOB decreases more rapidly than the curve for sell LOB and the average order size of sell orders is larger than that of the sell orders especially for large . This is consistent with the fact that the Chinese stock market in 2003 was bearish and more market participants tended to sell their shares. Take a more careful look at , one observes that there are more orders placed at the price level than other price levels in both buy LOB and sell LOB as illustrated in the inset plot of Fig. 6 (a). This is distinctly different from the shape of LOB in the continuous auction [34, 35, 36]. In addition, a series of periodic peaks are displayed at for , which might be related to the trader’s irrational preference of some numbers like 5, 10 or their multiples in order price placement, known as the price clustering phenomenon [34, 37, 38, 39]. Some large peaks presented at higher price levels in sell LOB may due to the burst of total order size of sell orders at as illustrated in Fig. 1.
As shown in Fig. 6 (b), shows a similar exponentially decreasing tendency as
| (12) |
and we obtain that for the buy LOB and for the sell LOB. For both buy LOB and sell LOB, the values of are very close to the values of . This may suggests that the average order size placed at each price level is independent of the order price, and crucially depends on the number of orders.
6 Conclusion
Based on the order flow data of 22 liquid stocks traded on the Shenzhen Stock Exchange in 2003, we analyze the statistical regularities of the relative order price, the order size in the opening call auction and the LOB shape immediately after it. The PDF of the relative order price is asymmetric, and displays a sharp peak at and a relatively wide peak at negative . the congregation of orders placed at implies the importance of closing price of last trading day in order price determination in the close call auction. We use the DFA method to investigate the memory effect of relative order prices, and find the fluctuate function shows two scaling regions. in the small scale region describes the relatively weak memory effect of relative order prices within one day, while in the large scale region describes quite persistent memory effect within a period of several days or weeks.
We then analyze the order size in the opening call auction. Layers of spikes are clearly observed in the histogram plot of order sizes, which may be caused by the number preference phenomenon existing in the order submission. We further apply four types of distribution functions to fit the PDF of normalized order sizes and find that -Gamma distribution gives a better fit than Weibull distribution, -exponential distribution and -Weibull distribution. The Hurst exponent of order sizes is larger than 0.5, which indicates the long-term memory also exists in order sizes. Considering the shape of the LOB established immediately after the opening call auction, we find that both the average order size and the average number of orders follow exponential decays with similar exponents.
Acknowledgments:
This work was partially supported by the Shanghai Educational Development Foundation (2008CG37 and 2008SG29), the National Natural Science Foundation of China (70501011 and 70502007), and the Program for New Century Excellent Talents in University (NCET-07-0288).
References
- [1] A. S. Kyle, Continuous auctions and insider trading, Econometrica 53 (1985) 1315–1335.
- [2] C. R. Schnitzlein, Call and continuous trading mechanisms under asymmetric information: an experimental investigation, J. Financ. 51 (1996) 613–636.
- [3] A. Madhavan, Trading mechanisms in securities markets, J. Financ. 2 (1992) 607–641.
- [4] M. Pagano, A. Röell, Transparency and liquidity: A comparison of auction and dealer markets with informed trading, J. Financ. 51 (1996) 579–611.
- [5] E. Theissen, Market structure, informational efficiency and liquidity: An experimental comparison of auction and dealer markets, J. Financ. Markets 3 (2000) 333–363.
- [6] P. S. Schreiber, R. A. Schwartz, Price discovery in securities markets, J. Portfolio Management 12 (1986) 43–48.
- [7] N. Economides, R. A. Schwartz, Electronic call market trading, J. Portfolio Management 21 (1995) 10–18.
- [8] A. Madhavan, Security prices and market transparency, Journal of Financial Intermediation 5 (1996) 255–283.
- [9] S. Baruch, Who benefits from an open limit-order book?, J. Business 78 (2005) 1267–1306.
- [10] D. Pan, T. Liu, H. L. Liu, C. F. Wu, Trading strategies in blind call auction: Models and empirical analysis of Shanghai stock exchang, Sys. Engin. Theory Prac. (in Chinese) 24(1) (2004) 1–10.
- [11] X. C. Xu, P. Li, Y. Zeng, Empirical analysis of the influence of open call auction on volatility in Chinese stock markets, J. Financ. Res. (in Chinese) 07(A) (2007) 151–164.
- [12] G.-F. Gu, W. Chen, W.-X. Zhou, Quantifying bid-ask spreads in the Chinese stock market using limit-order book data: Intraday pattern, probability distribution, long memory, and multifractal nature, Eur. Phys. J. B 57 (2007) 81–87.
- [13] G.-F. Gu, W. Chen, W.-X. Zhou, Empirical regularities of order placement in the Chinese stock market, Physica A 387 (2008) 3173–3182.
- [14] C.-K. Peng, S. V. Buldyrev, S. Havlin, M. Simons, H. E. Stanley, A. L. Goldberger, Mosaic organization of DNA nucleotides, Phys. Rev. E 49 (1994) 1685–1689.
- [15] J. W. Kantelhardt, E. Koscielny-Bunde, H. H. A. Rego, S. Havlin, A. Bunde, Detecting long-range correlations with detrended fluctuation analysis, Physica A 295 (2001) 441–454.
- [16] J. M. Karpoff, The relation between price changes and trading volume: A survey, J. Financ. Quart. Anal. 22 (1987) 109–126.
- [17] K. Chan, W. M. Fong, Trade size, order imbalance, and the volatility-volume relation, J. Financ. Econ. 57 (2000) 247–273.
- [18] F. Lillo, J. D. Farmer, R. Mantegna, Master curve for price impact function, Nature 421 (2003) 129–130.
- [19] M. Lim, R. Coggins, The immediate price impact of trades on the Australian Stock Exchange, Quant. Financ. 5 (2005) 365–377.
- [20] W.-X. Zhou, Universal price impact functions of individual trades in an order-driven market, http://arxiv.org/abs/0708.3198v2 (2007).
- [21] P. C. Moulton, You can’t always get what you want: Trade-size clustering and quantity choice in liquidity, J. Financ. Econ. 78 (2005) 89–119.
- [22] L. S. Hodrick, P. C. Moulton, Liquidity: considerations of a portfolio manager, http://www.bnet.fordham.edu/pmoulton/Liq08292007.pdf (2007).
- [23] G. J. Alexander, M. A. Peterson, An analysis of trade-size clustering and its relation to stealth trading, J. Financ. Econ. 84 (2007) 435–471.
- [24] G.-H. Mu, W. Chen, J. Kertész, W.-X. Zhou, Preferred numbers and the distributions of trade sizes and trading volumes in the Chinese stock market, Eur. Phys. J. B 68 (2009) 145–152.
- [25] A. C. Cohen, Maximum likelihood estimation in the Weibull distribution based on complete and on censored samples, Technometrics 7 (1965) 579–588.
- [26] K. Goda, H. Fukunaga, The evaluation of the strength distribution of silicon carbide and alumina fibres by a multi-modal Weibull distribution, J. Materials Sci. 21 (1986) 4475–4480.
- [27] S. Picoli Jr., R. S. Mendes, L. C. Malacarne, q-exponential, Weibull, and q-Weibull distributions: an empirical analysis, Physica A 324 (2003) 678–688.
- [28] I. W. Burr, Cumulative frequency functions, Ann. Math. Stat. 13 (1942) 215–232.
- [29] C. Tsallis, Possible generalization of Boltzmann-Gibbs statistics, J. Stat. Phys. 52 (1988) 479–487.
- [30] S. M. D. Queiros, On the emergence of a generalised Gamma distribution: Application to traded volume in financial markets, Europhys. Lett. 71 (2005) 339–345.
- [31] S. Nadarajah, S. Kotz, On the -type distributions, Physica A 377 (2007) 465–468.
- [32] C. Tsallis, C. Anteneodo, L. Borland, R. Osorio, Nonextensive statistical mechanics and economics, Physica A 324 (2003) 89–100.
- [33] S. M. D. Queiros, L. G. Moyano, J. de Souza, C. Tsallis, A nonextensive approach to the dynamics of financial observables, Eur. Phys. J. B 55 (2007) 161–167.
- [34] G.-F. Gu, W. Chen, W.-X. Zhou, Empirical shape function of limit-order books in the Chinese stock market, Physica A 387 (2008) 5182–5188.
- [35] J.-P. Bouchaud, M. Mézard, M. Potters, Statistical properties of stock order books: empirical results and models, Quant. Financ. 2 (2002) 251–256.
- [36] M. Potters, J.-P. Bouchaud, More statistical properties of order books and price impact, Physica A 324 (2003) 133–140.
- [37] V. Niederhoffer, Clustering of stock prices, Oper. Res. 13 (1965) 258–265.
- [38] V. Niederhoffer, A new look at clustering of stock prices, J. Business 39 (1966) 309–313.
- [39] C. A. Ball, W. N. Torous, A. E. Tschoegl, The degree of price resolution: the case of the gold market, J. Fut. Markets 5 (1985) 29–43.