Complexity in small-scale dwarf spheroidal galaxies
Ludwig Biermann Award Lecture 2008
Andreas Koch
Department of Physics & Astronomy
University of Leicester
University Road, Leicester, LE1 7RH, UK
ak326@astro.le.ac.uk
Abstract
Our knowledge about the dynamics, the chemical abundances and the evolutionary histories of the more luminous dwarf spheroidal (dSph) galaxies is constantly growing. However, very little is known about the enrichment of the ultra-faint systems recently discovered in large numbers in large sky surveys. Current low-resolution spectroscopy and photometric data indicate that these galaxies are highly dark matter dominated and predominantly metal poor. On the other hand, recent high-resolution abundance analyses indicate that some dwarf galaxies experienced highly inhomogenous chemical enrichment, where star formation proceeds locally on small scales. In this article, I will review the kinematic and chemical abundance information of the Milky Way satellite dSphs that is presently available from low- and high resolution spectroscopy. Moreover, some of the most peculiar element and inhomogeneous enrichment patterns will be discussed and related to the question of to what extent the faintest dSph candidates could have contributed to the Galactic halo, compared to more luminous systems.
1 Introduction
Dwarf spheroidals (dSphs) are the most common type of galaxies in the Local Group and generally found in the proximity (typically closer than 300 kpc) of larger galaxies like the Milky Way (MW) or the Andromeda galaxy, M31. Their very low luminosities ( mag) and low surface brightnesses ( mag arcsec-2) also render them the faintest galaxies known to exist in the universe. They are further characterized by total masses of a few 107 and a puzzling deficiency of gas, with upper limits on their H I masses of typically . This is far below the values expected from red giant mass loss even on the time scale of several Gyr (see Grebel et al. 2003, and references therein, for a recent review of the properties and possible origins of the more luminous dSphs). Moreover, the dSphs are fairly metal poor systems, with mean metallicities [Fe/H] reaching from ca. 1 to 2 dex, while individual stars are found as metal poor as almost dex.
All nearby dSphs, for which sufficiently deep data are available, the MW and the Magellanic Clouds share a common epoch of ancient star formation (SF) within the measurement accuracy (Grebel & Gallagher 2004). Some of the dSphs contain dominant intermediate age populations as well (e.g., Gallart et al. 1999), or even signs of some recent SF. In those galaxies that host distinct sub-populations in age and/or metallicity, there is evidence of population gradients (Harbeck et al. 2003; Tolstoy et al. 2004; Ibata et al. 2006) in the sense that the metal rich and younger populations are more centrally concentrated than the old and metal poor ones. This is interpreted through deeper potential wells in their centers, which can retain the gas for longer times, thus allowing for prolonged chemical enrichment in these regions. This extended enrichment also results in a number of intriguing scaling relations, such as the well established metallicity-luminosity relation (Dekel & Woo 2003; Kirby et al. 2008a).
Finally, their flat velocity dispersion profiles, their lack of any significant rotation and the lack of a depth extent of the dSphs have led to the notion that these galaxies are most likely the most dark matter dominated galaxies known to exist (e.g., Gilmore et al. 2007). Their mass to light (M/L) ratios derived under simplified assumptions thus reach up to several hundred in Solar units, although the role of Galactic tides in the interpretation of the dSphs’ nature and evolution is still under debate (Kroupa 1997; Read et al. 2006; Muñoz et al. 2008; Peñarrubia et al. 2008a).
In an oft-shown plot of magnitude versus the galaxies’ radius, however parameterized (Fig. 1; see also Gilmore et al. 2007; van den Bergh 2008; Martin et al. 2008), the dSphs and the Galactic globular clusters (GCs) clearly separate: while the GCs cut off at sizes of 30 pc, the dSphs exhibit typical radii in excess of 70 kpc. An attractive explanation is that the dSphs contain large amounts of dark matter, which forms cored mass distributions of a characteristic scale length of the latter size, while the GCs do not (eg., Gilmore et al. 2007).
The recently discovered ultrafaint dSphs extend the aforementioned extremes even further, with absolute magnitudes well above , and stellar masses in the regime of a mere several thousand to a few ten thousand solar masses. Typical core- or half-light radii of these galaxies are of the order of 70 to a few hundred kpc as well (Fig. 1), with the exception of a few objects that progressively scatter into the gap and the nature of which is yet unclear (see Sect. 1.1). Also these galaxies contain old populations of at least 12 Gyr and they are more metal poor on average than the previously known, more luminous counterparts; their mean metallicities reach as low as dex (Simon & Geha 2007). While no star more metal poor than [Fe/H] dex has been found in any of the classical dSphs (e.g., Koch et al. 2006;2007a,b), several such metal poor stars, down to dex have been detected in the ultrafaint galaxies (Kirby et al. 2008a).
Deep photometric studies have revealed complex individual properties of both the more luminous and the ultrafaint dSphs. Spectroscopy, though sparse, has become available for even the fainter stars in the luminous dSphs and in a few of the faintest satellites. Yet, the detailed properties of these latter galaxies remain poorly investigated until now. How and on what time scales does SF proceed in the faintest, lowest-mass galaxies? How did galactic winds, outflows or infall of gas, or mixing influence their evolution and what role did external effects such as Galactic tides play?
Cosmological simulations like CDM predict a wealth of small-scale substructure that gradually merges to hierarchically form large-scale structures like present day galaxies such as the MW or M31. As a consequence, our Galaxy is expected to be surrounded by a large number (hundreds) of dark matter halos. It has been conjectured, whether the present-day dSphs could be related to these predicted building blocks, but over the years a number of strong arguments against such a simplistic view have arisen (Moore et al. 1999). One notion was that the number of observed satellites is too low by a factor of several hundred too small compared to the theories. This missing satellite discrepancy is nowadays much alleviated, if one accounts for the wealth of newly discovered satellites (Section 1.1) and efficient mechanisms to suppress SF in the dark matter halos at early times, before and during re-ionization (Robertson et a. 2005; Font et al. 2006; Moore et al. 2006; Simon & Geha 2007; Strigari et al. 2007; Tollerud et al. 2008). At what redshifts were the “true” stellar building blocks then accreted and how do they relate to the observed population of surviving dSphs; thus: how and when did the (ultrafaint) dSphs form and evolve and how do they fit into the cosmological CDM models? In particular, what fraction of dSph-like systems contributed to the build-up of the stellar halo of the MW?
In this paper, I will review the most recent results that can be gleaned from spectroscopy both in the traditional, more luminous dSphs and the (ultra-) faint companions to the MW. This will reveal a high degree of complexity of these intriguing systems, not only in terms of their individual properties and evolution, but also in the context of their rôle for our understanding of cosmological structure formation. I will start by attempting a present census of the traditional and ultrafaint dSphs. In Section 2, the kinematic properties of the dSphs will be summarized and a brief account of their dark matter properties will be given. Section 3 first focusses on the general metallicity distributions of the dwarfs that are predominantly obtained from low-resolution spectroscopy, before discussing in detail their chemical abundances from high-resolution data. Section 4 finally summarizes the overall findings with a perspective for future observations.
1.1 A census
The dSphs have always been characterized as very low-luminosity systems, with absolute magnitudes fainter than 14 mag. For instance, by the time of its discovery (Cannon et al. 1977), the Carina dSph was among the faintest galaxies ever known in the Universe (). Thirty years later, the advent of large-scale sky surveys like the Sloan Digital Sky Survey (SDSS; Stoughton et al. 2002) or ambitious wide field surveys using, e.g., CTIO’s MegaCam (Martin et al. 2006), the INT/WFC instrument (Irwin et al. 2007) or the KPNO Mosaic imager (Majewski et al. 2007), has led to the discovery of a vast number of even fainter dSph satellites to the MW (Willman et al. 2005a,b; Belokurov et al. 2006a, 2007a; Zucker et al. 2006a,b; Walsh et al. 2007; Grillmair 2008) and M31 (Zucker et al. 2004, 2007, 2008; Martin et al. 2006; Majewski et al. 2007; McConnachie et al. 2008), thereby tracing the galaxy luminosity function further down to the ultrafaint end (e.g., Koposov et al. 2008). Table 1 lists the main properties of the currently known dSph candidates of the MW system that are relevant for this review.
| D⊙ | vrad | (M/L)V | ||||||
| dSph | [kpc] | [pc] | MV | [km s-1] | [km s-1] | [Fe/H] | [Fe/H] | [(M/L)⊙] |
| Sagittarius | 283 | 500 | 13.4 | 149.40.6 | 9.60.4 | 0.5 | 0.8 | 22 |
| Fornax | 1388 | 400 | 13.2 | 55.20.1 | 11.70.9 | 1.3 | 0.5 | 14.88.3 |
| Leo I | 25030 | 330 | 11.9 | 284.21.0 | 9.91.5 | 1.3 | 0.2 | 23.54.5 |
| Sculptor | 794 | 160 | 11.1 | 111.40.1 | 9.21.1 | 1.5 | 0.5 | 15833 |
| Leo II | 20512 | 185 | 9.6 | 79.10.6 | 6.61.5 | 1.7 | 0.2 | 335.75 |
| Sextans | 864 | 630 | 9.5 | 224.30.1 | 7.91.3 | 1.9 | 0.4 | 7010 |
| Carina | 1015 | 290 | 9.3 | 222.90.1 | 6.61.2 | 1.7 | 0.3 | 11624 |
| Ursa Minor | 663 | 300 | 8.9 | 245.2 | 12.0 | 1.9 | 0.7 | 27535 |
| Draco | 765 | 22116 | 8.8 | 290.7 | 13.0 | 2.0 | 0.7 | 29060 |
| Canes Venatici I | 21810 | 56436 | 8.6 | 30.92.0 | 7.60.4 | 2.1 | 0.5 | 221108 |
| Hercules | 13212 | 330 | 6.6 | 45.01.1 | 5.10.9 | 2.6 | 0.5 | 332221 |
| Boötes I | 663 | 242 | 6.30.3 | 99.02.1 | 6.5 | 2.1,2.5 | 0.3 | 680275 |
| Ursa Major I | 974 | 318 | 5.5 | 55.31.4 | 7.61.0 | 2.3 | 0.5 | 1024636 |
| Leo IV | 160 | 116 | 5.0 | 132.31.4 | 3.31.7 | 2.6 | 0.8 | 151177 |
| Canes Venatici II | 160 | 74 | 4.9 | 128.91.2 | 4.61.0 | 2.2 | 0.6 | 336240 |
| Ursa Major II | 305 | 14025 | 4.2 | 116.51.9 | 6.71.4 | 2.4 | 0.6 | 17221226 |
| Coma Berenices | 444 | 7710 | 4.1 | 98.10.9 | 4.60.8 | 2.6 | 0.5 | 448297 |
| Boötes II | 464 | 5612 | 2.70.9 | 117.05.2 | 10.57.4 | 1.8 | 0.1 | … |
| Willman I | 387 | 25 | 2.70.7 | 12.32.5 | 4.3 | 1.5 | 0.4 | 500 |
| Segue 1 | 231 | 29 | 1.5 | 206.01.2 | 4.31.3 | 3.3 | … | 13202680 |
| SDSS J1058+2843 | 24 | 22 | 0.2 | … | … | … | … | … |
| Leo T | 40738 | 17839 | … | 38.12.0 | 7.51.6 | 2.0 | 0.5 | 13871 |
| Boötes III | 461 | 1000 | … | … | … | … | … | … |
As Fig. 1 implies, many of these new satellites are comparable in magnitude to the (Galactic) GCs, while their spatial extent can extend to up to two orders of magnitude higher. The resulting very low surface brightnesses render it obvious that they have been so elusive from past shallower sky surveys.
And yet the terminology regarding this new generation of satellites is often misleading: In the literature, “ultrafaint” is generally applied to those dSphs recently discovered in the SDSS or other sky surveys. One should keep in mind, though, that some of these objects are still relatively bright; for instance CVn I (Zucker et al. 2006b) is as luminous as the “traditional” dSph Draco, and with a half light radius of 560 pc also the most extended MW dSph, while the Hercules dwarf (Belokurov et al. 2007a), at , has about one tenth of Draco’s luminosity. Thus, for a clear distinction, the label “ultrafaint dSph” should strictly be applied to systems fainter than a magnitude cut off at mag. Throughout this review, the more luminous dSphs, meaning those known in the pre-SDSS era, will also be referred to as the “traditional” or “classical” dSphs.
A number of the faintest galaxies have total absolute magnitudes that are comparable or even fainter than the absolute magnitude of the tip of (theoretical) red giant branches (RGBs; dashed line in Fig. 1) and their color magnitude diagrams (CMDs) show only a handful of evolved stars. At such low magnitudes, these galaxy-contenders are reminiscent of the faintest, peculiar halo clusters (AM 4, Palomar 1, Kop 1, 2; Inman & Carney 1987; Rosenberg et al. 1998; Koposov et al. 2007) that stand out through their absence of any significant RGB, although the dSph radii are larger by a factor of up to ten. Considering this sparsity in color-magnitude space and the fact that a few of these objects occupy the gap or transition region in the magnitude vs. radius plot (Fig. 1), the actual nature of the faintest stellar overdensities (Segue 1, Willman 1, Boötes II) remains unclear (see also Liu et al. 2008). In particular, their relatively small radii have prompted suggestions that these systems may be inflated star clusters, dense parts of tidal streams or heavily tidally stripped dwarf galaxies rather than classical old and metal poor dSphs. Other interpretations argue that these ultrafaint objects could be the stripped remnants from larger satellites such as the disrupted Sagittarius system (Ibata et al. 1994; Koch et al. 2009).
At present, there are nine luminous dSph satellites known to belong to the MW and of the order of 12–15 faint to ultrafaint satellites, modulo the aforementioned uncertainties in the classification of some of the faintest candidates. The count of M31 satellites, on the other hand, has reached as far as And XX (McConnachie et al. 2008), although it should be noted that And IV turned out to be a background galaxy (e.g., Ferguson et al. 2000), and And VIII is likely a tidal disrupted system and associated with M31 halo streams (Morrison et al. 2003). In either case, the discovery rate is proceeding at a fast pace and a wealth of new such objects is expected in the near future.
2 Kinematics
Radial velocities of the dSphs are usually measured from the Doppler shifts of prominent absorption features in red giant spectra. Depending on the spectrographs’ wavelength coverage and the achieved signal-to-noise ratios, the most common spectral reference features are the magnesium triplet lines at 5150Å (e.g., Walker et al. 2007) and the near-infrared calcium triplet (CaT) lines at 8500Å (e.g., Kleyna et al. 2002; Koch et al. 2007a,c; see also Fig. 3). Nowadays individual radial velocities in dSphs are published for several thousand stars in all of the more luminous galaxies, e.g., Fornax (Walker et al. 2009) or Carina (Koch et al. 2006; Muñoz et al. 2006a; Walker et al. 2009), a few hundred in the classical Sextans, Draco, Ursa Minor and Sculptor (Kleyna et al. 2004; Wilkinson et al. 2004; Battaglia et al. 2008a; Walker et al. 2007,2009) and of the order of 50–200 in the fainter and/or remote dSphs like Boötes I, CVn I, Leo I and II (Muñoz et al. 2006b; Ibata et al. 2006; Koch et al. 2006a,c). Reassuringly, present-day accurate radial velocity dispersion profiles from the numerous data sets have practically confirmed mass estimates from earliest measured central dispersion values (e.g., Aaronson 1983).
Typically, the stellar velocity dispersions in the traditional dSphs are of the order of 10 km s-1; their radial velocity dispersion profiles remain essentially constant out to the last observed data points. In fact, most of the dSph profiles have been mapped out to the large radii, typically a few tens of arc minutes (see also Fig. 1), at which their surface brightnesses level off into the background111Under a common misconception, this is often paraphrased as the “tidal” radius, although a simple term as “stellar limiting radius” seems more appropriate in the context of tides and the dSphs (see, e.g., discussions in Koch et al. 2007a; Gilmore et al. 2007).. Given the low stellar densities in the outer parts, however, the outer radial bin in the profiles usually contains only few stars, leading to larger uncertainties for these outermost data points. Deviations from a flat dispersion profile have been reported for individual cases, such as Ursa Minor (Wilkinson et al. 2004) with a significantly colder population in the outer parts, or Leo I (Koch et al. 2007a), which shows an indication of a rising profile in the innermost parts (cf. Sohn et al. 2007; Walker et al. 2007). Yet all the observed profiles are statistically consistent with simple, single-population mass models (Gilmore et al. 2007), without the need to invoke superpositions of multiple stellar populations with different dispersions or scale lengths (e.g., McConnachie et al. 2006).
In the ultrafaint satellites the RGB becomes progressively fainter and sparser and much of the observing time is spent of vetting Galactic foreground contamination, unless methods are used for target selection that permit dwarf/giant separation, such as Strömgren photometry (e.g., Faria et al. 2007), Washington photometry (e.g., Majewski et al. 2000) or photometric combinations (e.g., Koch et al. 2008c). This aggravates the measurability of accurate velocity distributions and mostly inhibits determinations of spatially resolved, i.e., radial, velocity dispersion profiles. Typically, a handful to a few dozens of member stars are measured within each of the ultrafaint galaxies (e.g., Simon & Geha 2007; Geha et al. 2008; Koch et al. 2009). As a result, the ultrafaint dSphs exhibit lower velocity dispersions on average, typically in the range of 3–7 km s-1 (Table 1).
Coupled with the declining surface brightness profiles in the dSphs, their flat radial dispersion profiles are inconsistent with simple mass-follows-light models, but rather indicate that the dSphs are embedded in massive dark matter halos. Estimates of their total masses from the central dispersion, , which scales as (with core radius ; King 1996; Illingworth 1976) already imply masses for the traditional dwarfs of a few times M⊙ and of the order of a few times M⊙ for the ultrafaint dSphs. Coupled with the very low luminosities of these galaxies, this further indicates high mass-to-light (M/L) ratios of up to several hundred in Solar units (see also Mateo 1998; Table 1; and references therein). These extreme values have led to early conjectures that the dSphs are likely the most dark matter dominated objects to exist on small scales. Alternative views to interpret the observed dynamics of the dSphs, however, leave room for modified gravity theories (MOND; e.g., Łokas 2001,2002) or to identify them as tidal remnants (e.g., Kroupa 1997), both without the need to invoke dark matter. In particular the latter is, however, at odds with the lack of a depth extent of the dSphs, as shown by Klessen et al. (2003).
Detailed mass profiles are then derived from the radial velocity dispersion profiles. The most straightforward approach applies the Jeans equations to relate the underlying total mass distribution to the observed brightness profiles and kinematics of the tracers, viz. the red giants (Binney & Tremaine 1987), although sophisticated nonparametric models are progressively developed (e.g., Wang et al. 2005; Strigari et al. 2007). Although widely applied, the mass determinations via the Jeans equations should be taken with caution, given the number of simplifications that enter the modeling. Amongst these are the assumption of spherical symmetry, velocity isotropy and the assumption of dynamical equilibrium, that is, neglect of Galactic tides. That these are mostly too simplistic is illustrated, e.g., by the cases of Hercules, which shows an unusually large elongation that may be of tidal origin (Coleman et al. 2007; Martin et al. 2008), Ursa Maior II with its irregular shape (Zucker et al. 2006a; Belokurov et al. 2007b; Fellhauer et al. 2007) and relatively high velocity dispersion (Martin et al. 2007; Simon & Geha 2007), and the prime example of Sagittarius, which is clearly undergoing tidal disruption during its accretion onto the MW (Ibata et al. 1994). Moreover, the anisotropy parameter in the models is degenerate with the shape of the (inner) density profile; the fits of present-day velocity dispersion profiles are unable to statistically differentiate between constant or radially varying velocity anisotropy (e.g., Łokas 2002; Koch et al. 2007a,c; Battaglia et al. 2008a), nor can they conclusively distinguish between cored or cusped density profiles unless higher moments of the velocity distributions are taken into account (e.g., Łokas 2009). Although purely kinematic data are not yet sufficient to resolve the controversy of cosmologically motivated cusped (Navarro et al. 1997) versus empirical, cored density profiles (e.g., Hernquist 1990; Łokas 2002; Kleyna et al. 2003; Read & Gilmore 2005; Sanchez-Salcedo et al. 2006), other pieces of evidence favor cored inner mass distributions. In particular, phase-space substructures in some dSphs resembling star clusters (Kleyna et al 2003) or even an intact GC system like in Fornax (Goerdt et al. 2006) would have quickly dispersed in the presence of an inner density cusp. Also, in cases where tentative evidence of two or more subpopulations may be present, whether distinct in kinematics, metallicity and/or age (as, e.g., claimed for Sculptor or CVn I; Tolstoy et al. 2004; Ibata et al. 2006), single-population Jeans modeling may not yield accurate results (McConnachie et al. 2006; Battaglia et al. 2008a).
On the other hand, apart from the few clear cases discussed above that are in a state of tidal disruption, dSphs are pressure supported systems in which no net rotation has been detected to date (Koch et al. 2007a,c; Gilmore et al. 2007; but see also Sohn et al. 2007; Muñoz et al. 2008; for an alternate view), which again argues in favor of them being dark matter dominated objects. However, any significant tidal stirring would predominantly act only at large radii that are mostly outside the presently targeted areas (e.g., Peñarrubia et al. 2008b). Another important notion regarding Galactic tides, if acting, is that they efficiently remove mass from the dSphs over their life times (e.g., Read et al. 2006; Muñoz et al. 2008). Thus the observed total mass and mass profiles are not necessarily representative of the initial mass, as usually nothing is known about their mass loss history. This permeates the interpretation of the dSphs’ whole evolutionary histories: If a galaxy started with a much larger initial (stellar) mass, it will have experienced a much different (viz. prolonged) chemical enrichment. Thus such heavily affected systems would seem too metal rich for their present day mass or luminosity so that they tend to deviate from well-defined scaling relations like the metallicity-luminosity relationship. This is in fact seen in a few of the ultrafaint candidates such as Boötes II (Koch et al. 2009; see also Sect. 3.1).
One of the earliest notions on the masses of the dSphs was that of Mateo et al. (1993) and Mateo (1998), namely that M/L scales with the galaxies’ luminosity. This was confirmed with the new and better measurements of the luminous dSphs and expanded to the (ultra-) faint regime. Fig. 2 shows an updated version of the Mateo-plot using the presently available data.
The narrow trend that is outlined by the more luminous satellites implies a common underlying dark matter halo mass scale, in which the dSphs are embedded. Depending on an assumed stellar M/L (usually chosen as 1–3 (M/L)⊙), the present data are consistent with a halo mass of a few times M⊙ (gray shaded area in Fig. 2). The ultrafaint galaxies, however, deviate from the trend in Fig. 2 and Simon & Geha (2007) argue that those systems are rather embedded in dark matter halos of a smaller mass. That is, if there was a physical minimum mass scale for dark matter halos, it is smaller than those scales sampled by the present-day luminous- and ultrafaint dSph data. Walker et al. (2007) find that the mass within a radius of 600 pc lies in this limited range for those luminous dSphs in their study, while Strigari et al. (2008) suggest that such a common mass scale is well manifested in the galactic mass integrated within 300 pc and found both for the traditional, more luminous dSphs and the ultrafaint satellites. In either case, all studies to date suggest an order of magnitude of M⊙; the existence of such a mass scale at all can be interpreted as due to either the possibility that dark matter halos with baryons below this limit simply do not exist, or that star and galaxy formation is suppressed in halos below this mass scale. Accurate mass modeling, in particular at the low-luminosity end, has to efficiently establish the characteristic clustering scale for dark matter as to ultimately constrain the properties of dark matter particles (Gilmore et al. 2007).
3 Chemistry
The chemical element distribution of stars in dSphs is invaluable for studying their chemical enrichment histories: while the overall metallicity222In spectroscopic studies, “metallicity” is generally paraphrased as “iron abundance” [Fe/H], while strictly the “true metallicity” [/H] accounts for all heavy elements and has non-negligible contributions from the -elements (Section 3.2.1). In the following I will use the notation “[Fe/H]” for both terms synonymously. distributions (MDFs) are well suited to derive the overall, integrated SF and enrichment history of a system, knowledge of the detailed chemical element abundance trends is required to get estimates of the time scales for enrichment and to isolate the predominant modes of SF in these low-mass objects.
3.1 Metallicities
Metallicities of stars in the faint dSphs are not easily measurable. First estimates of the systems’ overall metal content are usually obtained by matching sets of theoretical isochrones or empirical fiducials of Galactic GCs with known ages and metallicities to the CMDs. While this procedure yields satisfactory results for the more luminous galaxies, there are several aggravating factors in the ultrafaint dSphs. Firstly, many of the galaxies do not have well populated RGBs and/or are remote and faint so that the age-sensitive main sequence turn-offs are generally not discernible. Secondly, in those galaxies that also host stellar populations significantly younger than 10 Gyr besides the omnipresent old populations, age and metallicity are degenerate on the RGB. As a result, metal poor and old tracks occupy the same region in the CMD as the young and metal rich ones (e.g., Koch et al. 2006). For such cases, stellar spectroscopy is the only viable tool to break undesired degeneracies and to obtain accurate metallicity estimates. As Fig. 3 indicates, this is well achievable for the brighter red giants in the more luminous dSphs.

On the other hand, this becomes more problematic for the ultrafaint satellites, which either do not contain any significant RGB populations that could be easily vetted from foreground stars, or which have RGBs that are to faint to be reliably targeted (see also Fig. 1). However, recent studies have demonstrated that sufficient signal-to-noise ratios for stars down to V20 mag are achievable employing current state-of-the-art spectrographs at 8–10 m class telescopes (e.g., Koch et al. 2006; Simon & Geha 2007; Koch et al. 2009) and by applying sophisticated measurement techniques (Kirby et al. 2008b; Koch et al. 2008c).
The traditional dSph galaxies are fairly metal poor system that cover a broad range in mean metallicity, depending on their overall luminosity. As Table 1 illustrates, typical values reach from the more rich systems like Fornax (at a mean [Fe/H] of dex) to predominantly metal poor systems like Draco, at dex. The discovery and follow-up photometry of the ultrafaint systems already indicated, however, that these galaxies are even more metal poor on average, as for some of them was confirmed from low-resolution spectroscopy.
Traditional ways to measure the spectroscopic metallicity of dSph red giants are spectral synthesis, using spectral indices such as the Mg triplet index (Muñoz et al. 2006; Walker et al. 2009) or the wide-spread, empirical calibration of the near-infrared CaT onto metallicity [Fe/H]. The latter method has first been established for simple stellar populations such as the GCs (Armandroff & Zinn 1988; Armandroff & Da Costa 1991; Rutledge et al. 1997a,b). Over the past years, however, the calibrations have been successfully applied to mixed-age populations as the dSphs (e.g., Suntzeff et al. 1993; Côté et al. 1999; Koch et al. 2006, and references therein). In practice, the equivalent widths of the prominent lines of the singly ionized calcium ion at 8498, 8542, 8662Å are correlated with the stellar magnitude above the horizontal branch, by which undesired dependences of line strength with effective temperature and surface gravity are removed to first order (e.g., Rutledge et al. 1997a; Cole et al. 2000). The resulting line index (W′) is almost entirely a function of stellar metallicity and has been accurately calibrated onto reference scales using red giants in Galactic GCs of known metallicity (Zinn & West 1984; Carretta & Gratton 1997; Kraft & Ivans 2003). The original calibrations were strictly only defined in a limited age and metallicity range, dictated by the GCs of the calibration sample. However, recent studies have extended the calibration range towards the metal poor regime (Battaglia et al. 2008b), towards metal rich populations (Cole et al. 2004; Carrera et al. 2007) and over a broad age range (Cole et al. 2004) through open clusters.
Despite the straightforward measurement (as strong features in a wavelength region easily accessible using present-day instruments), a number of caveats have emerged in the literature, such as the unknown age dependence of the horizontal branch in mixed stellar populations (see discussions in Koch et al. 2006), or the vague first-order transition from the calcium line strength to general metal, or [Fe/H], abundance: by calibrating dSph stars onto a Galactic GC scale one strictly presupposes that the [Ca/Fe] ratio in the dSphs is the same as in the Galactic calibrators, while the abundance ratios in the dSphs are either a priori unknown or depleted with respect to the GC stars by up to 0.4 dex (Bosler et al. 2007; Koch et al. 2008a; Section 3.2.1). Reassuringly, stars that have both low-resolution CaT metallicities and high-resolution iron abundances available agree well to within the uncertainties. Systematic deviations (of the order of 0.1 dex) occur only above and more metal poor than dex (Battaglia et al. 2008b; Koch et al. 2008a). In any case the CaT method has proven a useful tool to rank the galaxies’ metallicities and to construct their overall MDFs.
Spectroscopic MDFs now exist for almost all of the Galactic satellites: Fornax (Pont et al. 2003, Battaglia et al. 2006); Leo I (Bosler et al. 2007; Koch et al. 2007a); Sculptor ( Tolstoy et al. 2004; Battaglia et al. 2008b); Leo II (Bosler et al. 2007; Koch et al. 2007b); Sextans (Helmi et al. 2006); Carina (Koch et al. 2006); and Muñoz et al. (2006); Ibata et al. (2006); Martin et al. (2007); Simon & Geha (2007); Kirby et al. (2008a); Koch et al. (2009) for the most recently detected faint to ultrafaint dSphs. Although analysed in detail in high-resolution abundance studies (see Sect. 3.2; and references therein) MDFs for the classical Ursa Minor and Draco dwarf galaxies are only available from broad- and narrow band photometry (e.g., Bellazzini et al. 2002; Faria et al. 2007). In Fig. 4 I show exemplary MDFs of four Galactic satellites, covering a wide range in luminosities.
While each individual dSph has experienced a unique SF history and no two dSphs are alike (Grebel 1997), there are important similarities in the overall shapes of their MDFs (e.g., Koch et al. 2007b) and I note the following characteristics:
(1) Metal poor mean: The low values of the mean [Fe/H] indicate a low SF efficiency in the dSphs with only a small supernovae (SNe) rate to enrich the interstellar medium (ISM) out of which the subsequent generations of stars are born (e.g., Lanfranchi & Matteucci 2004; see also Sect. 3.2.1). A problem with the low SF rates is, though, that these leave a reservoir of gas at the end of the last epoch of SF in the model predictions. To explain the observed gas deficiency in all dSphs efficient gas removal mechanisms have then to be invoked, such as tidal stripping (Ikuta & Arimoto 2002; Gallagher et al. 2003; Grebel et al. 2003).
As already indicated by the slight shift in the MDF peaks in Fig. 4, dSphs follow a well defined luminosity-metallicity relation (Dekel & Woo 2003; Grebel et al. 2003): since the more luminous galaxies have deeper potential wells, they retain their metals for longer time scales, thus allowing for stronger or prolonged enrichment (e.g., Dekel & Silk 1986). Given the larger uncertainties on the ultrafaint dSph MDFs and their very broad spreads (see item 2) it is yet unclear, whether this relationship extends to the least luminous galaxies (Kirby et al. 2008a) or whether one actually observes a leveling off above (Simon & Geha 2007). On average, all ultrafaints measured so far have mean metallicities below 2 dex, with two exceptions: Firstly, Willman 1 is possibly a star cluster (Willman et al. 2005b). Secondly, Boötes II may be a heavily stripped object or a star cluster from the Sgr system (Fig. 4; Koch et al. 2009). For both cases, the present-day observed mass and luminosities would be much smaller than in their initial state, which would be more representative of the observed higher metallicities.
In the models of Salvadori & Ferrara (2008), the gas paucity and very low SNe rate in the ultrafaint dSphs essentially results in their evolving as closed boxes, which does not hold for the luminous ones (Helmi et al. 2006; Koch et al. 2006, 2007b; see item 3). As a consequence these galaxies would retain their metals and get enriched to “higher” metallicities than expected from the canonical luminosity-metallicity relation. Their still comparably low mean metallicites below 2 dex would then be explicable if these ultrafaint systems formed very early on, at a time when the available gas was not yet enriched to the higher values. This would require a formation well before re-ionization (; Simon & Geha 2007; Salvadori & Ferrara 2008).
(2) Broad metallicity range: Another important notion is that the dSphs have very broad abundance spreads with formal 1 widths (that is, after correction for broadening through measurement uncertainties) of approximately 0.5 dex and large spreads of up to 0.8 dex in the ultrafaint ones. The whole range covered in a given dSph is, however, very large and usually at least 1 dex wide (Fig. 4). In particular cases like the Carina dSph, stars are found covering a full range from nearly 3 dex up to near-Solar (Koch et al. 2006). Carina is a special case, though, since it has experienced episodic SF (Smecker-Hane et al. 1994; Monelli et al. 2003) that led to the occurrence of multiple stellar populations distinct in metallicity and thus an efficient broadening of the MDF. Other contenders that were claimed to host populations distinct in spatial distribution, kinematics and metallicity are Sculptor (Tolstoy et al. 2004) and CVn I (Ibata et al. 2006).
One possible explanation for the broad metallicity ranges despite the low luminosities is again that the dSphs contain large amounts of dark matter (Sect. 2) so that they retained their metals over a long period, leading to a broad range in enrichment. This view is very simplistic, though, as nothing is known about the mass loss history of the dSphs and thus their initial masses. It is just as conceivable that they started as systems with much higher stellar mass than observed today, which was progressively lost – masses that could lead to the same amount of enrichment. Alternatively, the broad ranges could be explained by highly localized, highly inhomogeneous enrichment (e.g., Marcolini et al. 2006).
(3) Metal rich tail: A feature seen in the MDFs and predicted by models is that the distributions cut off more sharply at the metal rich end compared to the metal poor tail. This indicates the occurrence of strong outflows in the form of galactic winds, typically several times the SF rate (Lanfranchi & Matteucci 2004, 2007). These strong and continuous winds efficiently drive out metals, preventing further enrichment towards the metal rich tail. In general, galactic winds and gas outflows play an important role in the chemical evolution of the dSphs and in shaping their MDFs (e.g., Mac Low & Ferrara 1999; Hensler et al. 2004).
(4) Lack of metal poor stars: Finally, I note the lack of any stars more metal poor than 3 dex in all of the the more luminous dSphs studied to date. That is, these galaxies suffer from a pronounced G-dwarf problem, or, given the evolved nature of the targeted stars, a K-giant problem (Shetrone et al. 2001, 2003; Koch et al. 2006; 2007a,b; Helmi et al. 2006). Targets for measuring MDFs are generally selected from large samples of often several hundred stars to cover the full RGB color range without any observational bias or a priori knowledge of their metallicities – in that way one ensures to include potential very metal rich or extremely metal poor stars, if present. The fact that still no very metal poor stars below 3 dex are found then indicates that this appears to be a real absence in the luminous dSphs. Thus it seems that SF and enrichment in these systems clearly proceeds differently from, e.g., the Galactic halo, which contains a few handful of such extremely metal poor stars from 5 to 3 dex, though incompletely sampled (e.g., McWilliam et al. 1995; Beers & Christlieb 2005; Cohen et al. 2008). As a consequence it can be ruled out that these dSphs evolved according to a closed box scenario, but it is rather accepted that they have experienced an early “prompt” pre-enrichment (e.g., Tinsley 1975), leading to an initial non-zero metallicity. The question of the origin of such pre-enrichment of the initial gas phase is still under debate, but a likely scenario is an early enrichment to higher metallicities by pregalactic Population III stars (e.g., Larson 1998; Schneider et al. 2002; Bromm & Larson 2004). However, this leaves the question of why then there are extremely metal-poor stars present in the Galactic halo.
Interestingly, there is recent evidence that the ultrafaint dSphs may in fact host stars as low as dex with a distribution that resembles that of the Galactic halo (Kirby et al. 2008b). This is an important finding as it reinforces the idea envisioned in the original hierarchical formation scenario (Searle & Zinn 1978). Thus the metal poor halo of the Galaxy could have been donated by dissolving objects like the ultrafaint dSphs, while it is unlikely that it experienced any contribution from disrupted satellites like the more luminous dSphs with their absence of metal poor stars (see also Sect. 3.1).
Finally, I note that, where ever old and intermediate age populations and/or a spread in metallicity is present in a dSph, population gradients have been detected in the sense of a central concentration of the metal rich, younger populations compared to the more extended old and metal poor component (Harbeck et al. 2001). The amplitude of this effect is, however, very different for individual galaxies: while for instance the Sculptor and Carina dSphs exhibit clear radial separations of their stellar populations (Hurley-Keller et al. 1999; Harbeck et al. 2001; Tolstoy et al. 2004; Koch et al. 2006), other systems like Leo II do not show any significant radial metallicity nor age gradients (Koch et al. 2007b).
3.2 Chemical elements from high-resolution studies
Given the faintness of the dSphs, these galaxies have long since evaded observations with high-resolution spectrographs, which are invaluable to perform detailed chemical abundance studies and to gain insight in the dominant modes and time scales of SF in the dSphs. This changed with the advent of larger telescopes of the 8-m class, and the first ground breaking study was that of Shetrone et al. (2001, 2003) who targeted 32 stars in seven of the nine luminous dSphs known at that time. Since then, the number of abundance data from high-resolution studies has vastly increased, and yet the information is sparse compared to the low-resolution metallicity measurements. As of today, chemical element ratios in approximately 100 red giants in all of the nine luminous dSphs have been published in the literature (Shetrone et al. 2001, 2003, 2009; Sadakane et al. 2004; Geisler et al. 2004; Monaco et al. 2005; Koch et al. 2007d, 2008a). In the following plots we also include the data of Letarte (2007) for 82 stars in the Fornax dSph. The situation for the ultrafaint galaxies is much sparser at present and only two stars in the faint Hercules dSph have been published to date in high-resolution mode (Koch et al. 2008b; Fig. 3), although many ambitious programs are underway and the census is bound to increase quickly.
3.2.1 The elements
The -elements (O,Mg,Si,Ca,Ti) are produced in core-collapse SNe of type II that constitute the end phases, read: deaths, of massive stars above 8 M⊙ on negligible time scales. Iron can be formed in both SNe Ia and, in lesser amounts, in SNe II. SNe Ia are a consequence of mass transfer from giant companions on C/O white dwarfs so that one is dealing with a much lower mass regime and consequently longer lifetimes. Thus most of the iron at Solar metallicities originates from the long lived Ia, while in metal poor stars it derives from SNe II, since the former were not present to enrich the early generations of stars, yet.
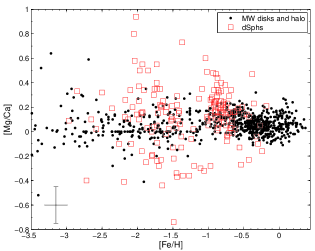
Literature comparisons often group together the light element abundances into a single [Mg,Si,Ca,Ti/Fe] ratio, which is perilous since the individual elements can be produced through different channels. In particular, Mg and O are formed during the hydrostatic C- and ensuing Ne-burning phases in the massive progenitors, while Si, Ca, and (presumably) Ti are formed explosively during the SN event itself (e.g., Timmes 1995; Woosley & Weaver 1995; McWilliam 1997). As pointed out by Shetrone et al. (2003), Venn et al. (2004; and reference therein), each of the -element to iron ratios follows slightly different trends; for instance the [Mg/Fe] ratio shows a broader, presumably real, cosmic scatter than the elements Ca or Ti (see also Koch et al. 2008a). In Fig. 5 I thus show the [Ca/Fe] ratio as representative of the -elements.
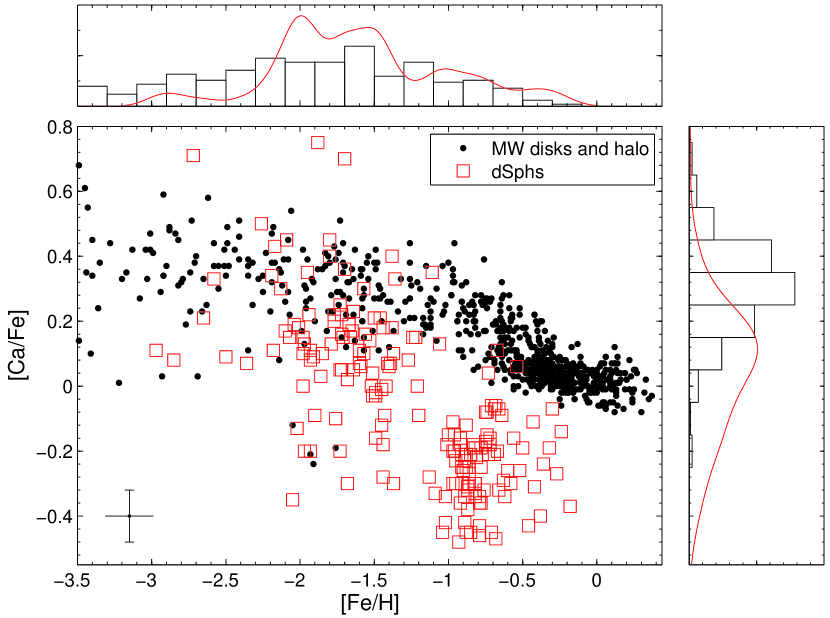
Abundance studies carried out by different groups necessarily apply different techniques and input data, in particular regarding atomic parameters (such as values vs. differential abundance studies that do not rely on these insecure values; Koch & McWilliam 2008), model atmospheres (spherical vs. plane-parallel, Kurucz vs. MARCS) or the choice of atomic line lists. Throughout the following plots I did not attempt to homogenize the abundance data from the literature accounting for these various approaches in the analyses. This will ultimately lead to an increased scatter among the dSph stars’ abundances, of the order of the measurement uncertainties (Venn et al. 2004).
The Galactic abundance distribution (black dots in Fig. 5) is well explicable in terms of a simple time delay model of chemical evolution (Tinsley 1979; Matteucci 2003; see also the review by McWilliam 1997). In this context, the enhanced value of [/Fe] dex in the halo at low metallicities, widely dubbed the “plateau”, is consistent with an early SF burst in the halo, which led to a high rate of early SNe II that produced a high amount of -elements and little iron. After a delay of ca. 1 Gyr, the longer lived SNe Ia started contributing, thereby enriching the ISM and subsequent generations of stars with iron without producing -elements, which ultimately reflects in a decline of the [/Fe] abundance ratio. In the halo, this downturn occurs at [FeH] dex. Ultimately, this ratio is a delicate function of the initial mass function (IMF), the galaxies’ SF histories, the involved SNe time scales, as well as the time scale for mixing the SNe ejecta into the ISM (Matteucci (2003)
One of the first and unprecedented notions of Shetrone et al. (2001) was that the [/Fe] abundance ratios in the dSph stars are systematically lower than those in Galactic halo stars of the same [Fe/H]. The natural explanation for the low [/Fe] is the much lower SF rate in the dSphs (Unavane et al. 1996; Matteucci 2003; Lanfranchi & Matteucci 2004; Sect. 3.1). Since SF was merely simmering in these galaxies, they had simply fewer SNe II to start with and thus much less -elements were produced for the first generations of stars. By the time the SNe Ia started exploding, the ISM had not been enriched with iron from the SNe II to as high metallicities as in the halo. Consequently, the “knee” in the dSphs occurs at relatively low [Fe/H], e.g., at dex in Sculptor (Geisler et al. 2007) or in Carina (Fig. 6; Lanfranchi & Matteucci 2006; Koch et al. 2007d,2008a). Alternatively, the low -abundances at intermediate metallicities are explicable through SF events with only low total masses involved. In events forming only a few 1000 M⊙, very massive stars are unlikely to form at all (assuming a standard IMF). Since these stars are an efficient nucleosynthetic source of the -elements, their absence would lead to significantly lower [/Fe] ratios compared to an environment with a high-mass SF and a fully sampled IMF like the halo (Woosley & Weaver 1995; Shetrone et al. 2003; Koch et al. 2008a,b). Thus SF in, at least some, dSphs is likely to proceed on small scales.
The depletion of the dSphs’ [/Fe] ratios with respect to halo stars was often cited as evidence that there was only little contribution of systems like the present-day dSphs to the Galactic halo build-up at intermediate metallicities (which is strictly at odds with the observed current accretion of a dSph – the Sagittarius dwarf; Ibata et al. 1994). In all such comparisons one should also strictly bear in mind that also the halo is distinct in its inner and outer components (Pritzl et al. 2005; Carollo et al. 2007; Geisler et al. 2007; and references therein). This discrepancy is particularly pronounced at the metal rich end above [Fe/H] dex, where there is no overlap and the dSph stars exhibit [/Fe] ratios lower by up to 0.6 dex compared to the MW stars. On the other hand, Shetrone et al. (2003) reported that two of their dSph stars (in Leo I and Sculptor) at and dex exhibit halo-like abundance ratios. With the increasing accumulation of larger data sets in the dSphs, stars were indeed found to partially overlap with the Galactic halo population. As Fig. 5 indicates there are already a few dSph stars found with halo-like, that is enhanced, [/Fe] ratios at [Fe/H]= dex and a handful that overlap below dex; moreover, recent data (Frebel et al. 2009) indicate a significant overlap with the metal-poor halo below dex and the dSph patterns appear to start resembling those of the halo around dex. Thus it appears likely that any contribution of stars from systems like the dSphs must have occurred at very early times (that is, at low metallicities). This is in concordance with the idea that the ultrafaint, more metal poor dSphs could have donated a fraction of the metal-poor Galactic halo (see Sect. 3.1, item 4), or at least that they had experienced similar formation and enrichment histories.
There is a notable overlap with a few chemically peculiar halo stars that stand out in terms of of a relatively strong depletion in the -elements, down to [/Fe]= at [Fe/H] dex (Carney et al. 1997; Ivans et al. 2003). While the -elements in these stars are very similar to those found in a number of the dSphs (Fig. 5), not all of their heavy element patterns agree completely with those in the dSph stars (Sect. 3.2.2.; see also discussion in Ivans et al. 2003). The progressive detection of stars with strong element depletions (like LG04_001826 in Carina with [Ca/Fe]= and [Mg/Fe]= at [Fe/H]=; Koch et al. 2008a) then reinforces the idea that complex dSphs are a possible source for the donation of chemically peculiar stars to the halo. Moreover, few dSph stars exhibit [/Fe] ratios well in excess of +0.4 dex, which is also found amongst the very metal poor halo stars below dex (e.g., McWilliam et al. 1995).
An intriguing individual case is the Carina dSph that is unique among the Local Group dSphs in terms of its episodic SF history, in which periods of active SF are interrupted by extended quiescent phases of negligible SF activity (Smecker-Hane et al. 1994; Monelli et al. 2003; Tolstoy et al. 2003; Koch et al. 2006; see also Sect. 3.1). These periods have been photometrically well established and reflect, e.g., in the presence of multiple MSTOs representative of populations of approximately 0.6, 5, and 12 Gyr. Accordingly, its peculiarity also shows up in its chemical abundance ratios: this galaxy shows a very broad scatter in the [/Fe] abundance ratios at a given metallicity (Shetrone et al. 2003; Koch et al. 2007d,2008a), both with respect to the other dsph galaxies, and also in relation to model predictions of chemical evolution (Fig. 6; Gilmore & Wyse 1991; Lanfranchi & Matteucci 2004, 2006).
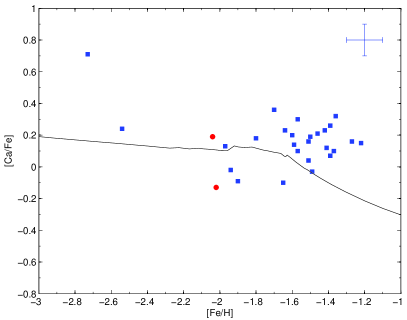
In the simple time-delay models, each SF bursts drives up the -element production, while Fe is continuously produced in the SNe Ia, which leads to an increase in the [/Fe] ratio. Quiescent phases, however, do not have any SNe II and no -contribution, while Fe is still being produced in the Ia SNe. The overlap of these episodes would then lead to a broad range in the abundance ratio over the whole metallicity range covered. In Fig. 6 I show the model predictions by Lanfranchi & Mateucci (2006) that are characterized by two SF bursts, efficient gas outflows (galactic winds; Sect. 3.1) and that were tailored to match Carina’s evolution by using the observed MDF of Koch et al. (2006) and the chemical abundance data of Shetrone et al. (2003). Despite a good fit of the overall MDF (Koch et al. 2006) and succeeding in the reproduction of an overall trend, the models do not represent the [Ca/Fe] abundance ratios in detail. In particular, the models predict the location of the downturn to occur at lower metallicities (by 0.2–0.3 dex) than is observed, leaving the impression of an underestimate of [Ca/Fe] at higher [Fe/H] with respect to the data points. The [Mg/Ca] ratio is in turn systematically overpredicted by approximately 0.3 dex. The exact times for onset, duration and cessation of the SF epochs as well as details of the SF and wind efficiencies are thus delicate governing parameters that have to account for as comprehensive abundance distributions as available and observable.
Another attractive explanation for the large abundance spread in a dSph is the occurrence of stochastical SF on small scales. In cases, where every SF burst only converts small amounts of gas into stars the IMF remains only incompletely and statistically sampled so that very massive stars may or may not be formed and thus be available as sources for the subsequent -element productions (e.g., Carigi et al. 2008). Such scenarios can be coupled with spatially inhomogeneous enrichment and a poor mixing of the SNe ejecta into the ISM (e.g., Marcolini et al. 2006), which then would reproduce dSph chemical abundance trends without the need to invoke galactic winds. Either enrichment scenario points to the complex chemical evolution of the dSphs.
3.2.2 Heavy elements
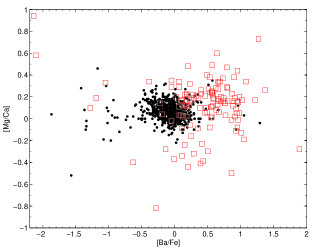
Elements heavier than the iron peak are mainly produced through processes that are distinguished by the rate of neutron capture relative to the time scale for the -decay in the nuclei. In essence, the -process (for slow) takes place in environments with low neutron densities, such as low-mass (1–3 M⊙) asymptotic giant branch (AGB) stars (e.g., Gallino et al. 1998). Typical -process elements are Y, Sr, Ba, La and Pb. The other main source for heavy element nucleosynthesis is the -process (rapid) that occurs in environments dominated by high neutron fluxes such as the SNe II explosions or neutron star-neutron star mergers (see Qian & Wasserburg 2007 for a recent review). An element often cited as the archetypical -process element is Eu. One should keep in mind, however, that attributes such as Ba as an -process element strictly hold for the Sun, while in the early universe, i.e., in metal-poor stars, all heavy elements can be expected to be produced in the -process. At those early times, there were simply no longer-lived AGB stars present, yet, to contribute any -process material. In this context, abundance studies of metal poor stars and investigations in the dSphs are also invaluable to constrain possible nucleosynthetic production sites for the chemical elements (e.g., Thielemann et al. 2001; McWilliam et al. 2003; Frebel et al. 2009) Individual [/] ratios such as [Ba/Eu] (Fig. 7) are then an important diagnostic for the relative interplay of the AGB enrichment on longer time scales and the fast SNe II enrichment and are also well suited to discern phases of more intense SF (with more SNe II) from quiescent phases (with AGB enrichment only).
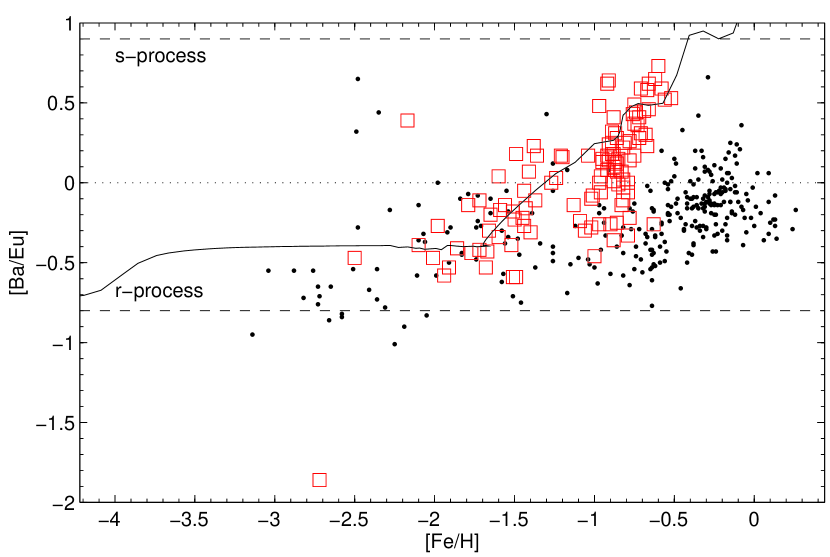
The trend seen in Fig. 7 confirms what was mentioned with regard to the [/Fe] ratio (Sect. 3.2.1). That is, dSphs are chemically distinct from the halo: while the halo rises from an r-process dominated environment towards s-process contributions at higher metallicities around 1, the -process contribution in the dSphs rises earlier, at lower [Fe/H] of approximately dex. This is due to the AGB stars contributing the -process elements only after a longer delay, by which time the ISM was already enriched in Fe by the SNe II. Due to the low SF efficiency and thus less SNe II in the dSphs, however, not much chemical enrichment had occurred by the time the AGBs started to contribute the s-process. The model prediction for Carina (solid line in Fig. 7) represents the moderately metal poor Carina well compared to the poor fit of the -data (Fig. 6). It is also worth noticing that Fornax experiences a much steeper upturn at much higher metallicities around dex (in extrapolation).
The addition of heavy element abundance information is crucial for a comparison with the Galactic halo. In order to plausibly argue, whether or not any component of the halo could have been donated by disrupted dSph systems, or shared similar modes of SF, an overlap has to be present in essentially all chemical abundance patterns. In their study of chemically peculiar halo stars, Ivans et al. (2003) note , Cu and Zn abundances in the -depleted halo star BD+80∘ 245 (Carney et al. 1997) that resemble those of a dSph star in Carina (Shetrone et al. 2003), whereas there are significant differences of up to 2 dex in the - and -process abundance ratios. This and other examples given in Ivans et al. (2003) efficiently rule out a connection of those halo stars with the dSphs.
3.2.3 Complex abundance ratios in complex dSphs
As mentioned above, each individual galaxy exhibits intriguing and complex abundance patterns. Hence the statement that no two dSphs are alike and each has its own, special history still holds (Grebel 1997). One example is Carina in terms of its episodic SF and the resulting abundance scatter due to small-scale chemical evolution in small associations. This galaxy also hosts one chemically peculiar star that is distinct in a strong depletion in all -elements. Also Dra 119, the most metal poor star in a luminous dSph to date, for which detailed abundance information is available ([Fe/H]=2.95 dex; Shetrone et al. 2001; Fulbright et al. 2004) is very distinct in that it essentially lacks all heavy elements beyond nickel.
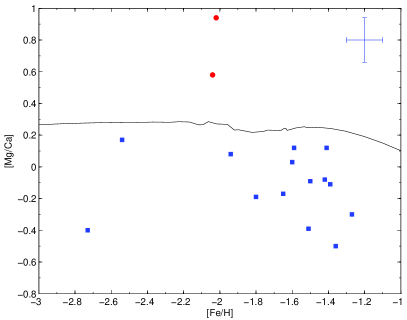
Albeit at higher metallicities, two stars in the Hercules dSph share similar properties: These stars are highly depleted in heavy elements, with [Ba/Fe] dex. Common to these stars is also that they exhibit high abundances of the hydrostatic -elements like O and Mg, while explosive elements like Ca are normal to deficient, leading to unusually high [Mg/Ca] ratios of +0.6–0.9 dex. A detailed interpretation of these pattern relies on the input nucleosynthetic models and is sensitive to stellar yields, the metallicity of the SNe progenitors and the treatment of rotation (e.g., Woosley & Weaver 1995; Chiappini et al. 2003; Hirschi et al. 2005; Kobayashi et al. 2006; Heger & Woosley 2008). The significance of this is that such high [Mg/Ca] ratios are understood by an enrichment of these stars through very massive progenitors, in the mass regime of M⊙ up to perhaps 50 M⊙. In an environment in which a high mass of gas was converted into gas so that the IMF is fully sampled, it is feasible that such high mass stars form. How then can the ISM retain the chemically peculiar pattern that is imprinted in the anomalous stars we observe today, e.g., in Hercules? This is only possible, again, if SF proceeded highly stochastically, with one or two very high mass stars forming (the observed patterns are in fact explicable with less than 3 of these SNe events; Koch et al. 2008b), while the lower mass SNe II might not have occurred. This is most likely to happen in very low-mass SF events (see also Carigi et al. 2008) in the regime of less than a few thousand M⊙ in total stellar mass. Although it is statistically very unlikely that any such very high-mass stars are formed at all under a standard IMF (e.g., Miller & Scalo 1979; see also Shetrone et al. 2003; Koch et al. 2008a), if they happen to form, early in the galaxy’s history, they will effectively govern the enrichment patterns of the entire low-mass environment, which is the most likely scenario for Hercules’ evolution to date. This is likely coupled with highly inhomogeneous spatial enrichment of the SNe Ia and II; the few massive SNe explosions would then only influence the immediate surrounding ISM out of which the subsequent stars are born (see also Marcolini et al. 2006,2008).
Fig. 8 shows [Mg/Ca] ratios in the sample of Galactic and dSph stars introduced in Fig. 5.
At any given metallicity, there is a broad scatter present in this ratio in the dSph stars, although the generally large error bars on this ratio in the faint dSphs should be noted (indicated in Fig. 8). According to the yields of Heger & Woosley (2008), SNe II with progenitor masses above 20 (25) M⊙ can already produce [Mg/Ca] ratios in excess of 0.3 (0.5) dex. Apart from the two Hercules stars and Dra 119, also a handful of giants in the Leo II dSph between an [Fe/H] of to dex (Shetrone et al. 2009) exhibit enhanced [Mg/Ca] ratios. It is interesting to note that Fornax contains a high fraction (ca. 1/5th of the sample) of [Mg/Ca]-enhanced stars above the Galactic, Solar value. It is thus conceivable that this galaxy experienced a higher number of massive SNe II than other dwarfs, which is feasible since Fornax is the most luminous dSph and it is governed by an extended SF history. On the other hand, the Hercules stars of Koch et al. (2008b) and Dra 119 (Fulbright et al. 2004) are significantly depleted in the chemical elements heavier than Ni so that an additional conclusion is that very massive SNe II progenitors likely do not synthesize such heavy elements (see also Frebel et al. 2009). If the nucleosynthesis governing all of these galaxies was thus comparable, such depletions should be omnipresent in all strongly [Mg/Ca]-enhanced stars. As Fig. 8 (right panel) shows, there is no significant trend discernible – most higher [Mg/Ca] stars show enhancements in [Ba/Fe] that are typical of their metallicity. Thus one is facing two entirely different mechanisms: the stochastical enrichment with very massive star contributions on the one hand; and on the other hand the integrated build-up of heavy elements coupled with the massive star contribution as expected from a fully sampled IMF in a massive system with continuous SF activity like Fornax.
Another relevant pattern is for instance the [Co/Cr] abundance ratio, which is notably high in the Hercules stars (Koch et al. 2008b) such as usually found only in very metal poor Galactic halo stars, below [Fe/H] dex (e.g., McWilliam et al. 1995). This can be interpreted as a signature of the aforementioned massive SNe II enrichment, coupled with contributions from the hypothesized first, metal-free massive Population III stars (e.g., Beasley et al. 2003; Bromm & Larson 2004; Frebel et al. 2007; Cohen et al. 2007). Thus the (ultra-) faint dSphs are in fact an attractive environment to search for signatures of the Population III stars – galaxies like Hercules could well show such evidence of primordial material and be the sites of the first stars in the universe.
4 Summary
How similar is the newly discovered generation of ultrafaint galaxies to the classical, more luminous dSphs? Are they mere extensions of the known, extreme properties of the latter? Their general characteristics as “old, metal poor and dark matter dominated” systems is in fact reminiscent of the traditional dwarfs, yet the ultrafaint galaxies are characterized by much lower luminosities, they are found to be more metal poor on average with broad abundance spreads, and have higher M/L ratios than the traditional satellites, thus appear to be even more strongly dark matter dominated.
With the gathering of detailed chemical abundance data in the past few years, the classical picture of the dSphs as relatively simple, chemically homogeneous and well-mixed systems has drastically changed. Individual abundance patterns and the broad abundance scatter in several of these galaxies indicate that, already on small scales, there is room for local inhomogeneities through incomplete mixing processes of the SNe ejecta or an incomplete sampling of the IMF due to low-mass SF events. The dominance of such inhomogeneities was already found in many, more massive, dwarf irregular galaxies (e.g., Sextans B, Kniazev et al. 2005; or the SMC, Glatt et al. 2008). These patterns then underscore the complexities in the SF, enrichment and evolutionary processes on small scales in the dSphs. Moreover, in the ultrafaint galaxies there appears to exist a mode of SF that has not been identified in any other of the dSphs before (though visible, e.g., in the Galactic halo), that is, we may be able to see here the potential signatures of the first stars, imprinted in the abundance anomalies of the subsequent generations of stars observed today. These galaxies thus hold the keys for tracing the fossil records of SF.
Furthermore, the growing body of chemical evidence confirms the early findings of Shetrone et al. (2001, 2003) and Fulbright (2002) that the discrepancies in the abundance ratios between the dSps and the Galactic halo persist at intermediate metallicities. However, from more recent data the earlier surmised overlap with the Galactic halo at the metal poor end emerges, thereby reinforcing the importance of dSph-like systems in the build-up of parts of the halo (see also Bell et al. 2008). This is then also consistent with the very metal poor character of the ultrafaint satellites. Yet these systems clearly cannot account for a full build-up of the stellar halo, which would rather require few (1–2) early, massive (LMC type) accretions, while the present-day (ultrafaint) dSphs are the mere survivors of ancient accretion processes (see also Zinn & West 1978; Unavane et al. 1996; Bullock & Johnston 2005; Robertson et al. 2005).
Where do we go from here? In the near future, the MW dSph satellite family will most certainly vastly increase, opening intriguing new windows to study the detailed, complex properties of these cosmological substructures on small scales. Such new discoveries will be characterized by progressively faint magnitudes so that straightforward spectroscopic follow-up observations are very time-expensive. In this context it is timely to acknowledge the great powers and availability of state-of-the-art low- and high-resolution instruments at our generation’s 8-10m class telescopes: amongst these, the FLAMES/UVES multi-object spectrograph at the ESO/VLT, the MIKE and MOE Echelle spectrographs at Magellan, as well as the DEIMOS and HIRES instruments at Keck have delivered the vast amounts of invaluable data I presented in this review. And yet it should be mentioned that, e.g., the first high-resolution spectroscopic study in brighter giants of a faint dSph, viz. Hercules (Fig. 3; Sect. 3.2.3) already required 4–6 hours integration at a 6.5m telescope to obtain sufficient signal-to-noise ratios (Koch et al. 2008b). Deriving detailed abundance ratios a large number of even fainter stars in the ultrafaint dSphs then calls for dedicated programs and future generations of powerful, preferentially multi-object, facilities at telescopes of the ELT, TMT and GMT class.
Acknowledgements
First of all I would like to thank the Astronomische Gesellschaft for granting me the honor of the Ludwig Biermann award. I gratefully acknowledge support from and invaluable discussions with Eva K. Grebel, Andrew McWilliam, Mark Wilkinson, Gerry Gilmore, Rosie Wyse, R. Michael Rich, Francesca Matteucci, Andrea Marcolini, Nicolas Martin and Gustavo Lanfranchi. Finally I would like to thank the Swiss National Science Foundation, SNF, which funded much of my own work presented in this review.
References
Aaronson, M. 1983, ApJL, 266, L11
Armandroff, T. E., & Da Costa, G. S. 1991, AJ, 101, 1329
Armandroff, T. E., & Zinn, R. 1988, AJ, 96, 92
Battaglia, G., Helmi, A., Tolstoy, E., Irwin, M., Hill, V., & Jablonka, P. 2008a, ApJL, 681, L13
Battaglia, G., Irwin, M., Tolstoy, E., Hill, V., Helmi, A., Letarte, B., & Jablonka, P. 2008b, MNRAS, 383, 183
Beasley, M. A., Kawata, D., Pearce, F. R., Forbes, D. A., & Gibson, B. K. 2003, ApJL, 596, L187
Beers, T. C., & Christlieb, N. 2005, ARA&A, 43, 531
Bell, E. F., et al. 2008, ApJ, 680, 295
Bellazzini, M., Ferraro, F. R., Origlia, L., Pancino, E., Monaco, L., & Oliva, E. 2002, AJ, 124, 3222
Bellazzini, M., et al. 2008, AJ, 136, 1147
Belokurov, V., et al. 2006a, ApJL 647, L111
Belokurov, V., et al. 2006b, ApJL 642, L137
Belokurov, V., Evans, N. W., Irwin, M. J., Hewett, P. C., & Wilkinson, M. I. 2006c, ApJL, 637, L29
Belokurov, V., et al. 2007a, ApJL, 654, 897
Belokurov, V., et al. 2007b, ApJ, 658, 337
Belokurov, V., et al. 2008, ApJL, 686, L83
Bensby, T., Feltzing, S., & Lundström, I. 2003, A&A, 410, 527
Binney, J., & Tremaine, S. 1987, Princeton, NJ, Princeton University Press, 1987, 747 p.,
Bosler, T. L., Smecker-Hane, T. A., & Stetson, P. B. 2007, MNRAS, 378, 318
Bromm, V., & Larson, R. B. 2004, ARA&A, 42, 79
Bullock, J. S., & Johnston, K. V. 2005, ApJ, 635, 931
Burris, D. L., Pilachowski, C. A., Armandroff, T. E., Sneden, C., Cowan, J. J., & Roe, H. 2000, ApJ, 544, 302
Cannon, R. D., Hawarden, T. G., & Tritton, S. B. 1977, MNRAS, 180, 81P
Carigi, L., Hernandez, X., & Gilmore, G. 2002, MNRAS, 334, 117
Carigi, L., & Hernandez, X. 2008, MNRAS, 390, 582
Carney, B. W., Wright, J. S., Sneden, C., Laird, J. B., Aguilar, L. A., & Latham, D. W. 1997, AJ, 114, 363
Carollo, D., et al. 2007, Nature, 450, 1020
Carrera, R., Gallart, C., Pancino, E., & Zinn, R. 2007, AJ, 134, 1298
Carretta, E., & Gratton, R. 1997, A&AS, 121, 95
Chiappini, C., Matteucci, F., & Meynet, G. 2003, A&A , 410, 257
Cohen, J. G., McWilliam, A., Christlieb, N., Shectman, S., Thompson, I., Melendez, J., Wisotzki, L., & Reimers, D. 2007, ApJL, 659, L161
Cohen, J. G., Christlieb, N., McWilliam, A., Shectman, S., Thompson, I., Melendez, J., Wisotzki, L., & Reimers, D. 2008, ApJ, 672, 320
Cole, A. A., Smecker-Hane, T. A., & Gallagher, J. S., III 2000, AJ, 120, 1808
Cole, A. A., Smecker-Hane, T. A., Tolstoy, E., Bosler, T. L., & Gallagher, J. S. 2004, MNRAS, 347, 367
Coleman, M. G., et al. 2007, ApJL, 668, L43
Côté, P., Oke, J. B., & Cohen, J. G. 1999, AJ, 118, 1645
de Jong, J. T. A., Rix, H.-W., Martin, N. F., Zucker, D. B., Dolphin, A. E., Bell, E. F., Belokurov, V., & Evans, N. W. 2008, AJ, 135, 1361
Dekel, A., & Silk, J. 1986, ApJ, 303, 39
Dekel, A., & Woo, J. 2003, MNRAS, 344, 1131
Dotter, A., Chaboyer, B., Jevremović, D., Kostov, V., Baron, E., & Ferguson, J. W. 2008, ApJS, 178, 89
Edvardsson, B., Andersen, J., Gustafsson, B., Lambert, D. L., Nissen, P. E., & Tomkin, J. 1993, A&A, 275, 101
Faria, D., Feltzing, S., Lundström, I., Gilmore, G., Wahlgren, G. M., Ardeberg, A., & Linde, P. 2007, A&A, 465, 357
Fellhauer, M., et al. 2007, MNRAS, 375, 1171
Ferguson, A. M. N., Gallagher, J. S., & Wyse, R. F. G. 2000, AJ, 120, 821
Font, A. S., Johnston, K. V., Bullock, J. S., & Robertson, B. E. 2006, ApJ, 638, 585
Frebel, A., Johnson, J. L., & Bromm, V. 2007, MNRAS, 380, L40
Frebel, A., Simon, J. D., Geha, M., & Willman, B. 2009, ApJ, submitted (arXiv:0902.2395)
Fulbright, J. P. 2000, AJ, 120, 1841
Fulbright, J. P. 2002, AJ, 123, 404
Fulbright, J. P., Rich, R. M., & Castro, S. 2004, ApJ, 612, 447
Gallagher, J. S., Madsen, G. J., Reynolds, R. J., Grebel, E. K., & Smecker-Hane, T. A. 2003, ApJ, 588, 326
Gallart, C., Freedman, W. L., Aparicio, A., Bertelli, G., & Chiosi, C. 1999, AJ, 118, 2245
Gallino, R., Arlandini, C., Busso, M., Lugaro, M., Travaglio, C., Straniero, O., Chieffi, A., & Limongi, M. 1998, ApJ, 497, 388
Geisler, D., Smith, V. V., Wallerstein, G., Gonzalez, G., & Charbonnel, C. 2005, AJ, 129, 1428
Gilmore, G., Wilkinson, M. I., Wyse, R. F. G., Kleyna, J. T., Koch, A., Evans, N. W., & Grebel, E. K. 2007, ApJ, 663, 948
Glatt, K., et al. 2008, AJ, 136, 1703
Goerdt, T., Moore, B., Read, J. I., Stadel, J., & Zemp, M. 2006, MNRAS, 368, 1073
Gratton, R. G., & Sneden, C. 1988, A&A, 204, 193
Gratton, R. G., & Sneden, C. 1994, A&A, 287, 927
Grebel, E. K. 1997, Reviews in Modern Astronomy, 10, 29
Grebel, E. K., Gallagher, J. S., III, & Harbeck, D. 2003, AJ, 125, 1926
Grebel, E. K., & Gallagher, J. S., III 2004, ApJL, 610, L89
Grillmair, C. J. 2008, ApJ, in press (astro-ph/0811.3965v1)
Harbeck, D., et al. 2001, AJ, 122, 3092
Hanson, R. B., Sneden, C., Kraft, R. P., & Fulbright, J. 1998, AJ, 116, 1286
Heger, A., & Woosley, S. E. 2008, ApJS, submitted (arXiv:0803.3161)
Helmi, A., et al. 2006, ApJL, 651, L121
Hensler, G., Theis, C., & Gallagher,, J. S., III. 2004, A&A, 426, 25
Hernquist, L. 1990, ApJ, 356, 359
Hirschi, R., Meynet, G., & Maeder, A. 2005, A&A, 433, 1013
Hurley-Keller, D., Mateo, M., & Grebel, E. K. 1999, ApJL, 523, L25
Ibata, R. A., Gilmore, G., & Irwin, M. J. 1994, Nature, 370, 194
Ibata, R., Irwin, M., Lewis, G., Ferguson, A. M. N., & Tanvir, N. 2001, Nature, 412, 49
Ibata, R., Chapman, S., Irwin, M., Lewis, G., & Martin, N. 2006, MNRAS, 373, L70
Ibata, R., Martin, N. F., Irwin, M., Chapman, S., Ferguson, A. M. N., Lewis, G. F., & McConnachie, A. W. 2007, ApJ, 671, 1591
Ikuta, C., & Arimoto, N. 2002, A&A, 391, 55
Illingworth, G. 1976, ApJ, 204, 73
Inman, R. T., & Carney, B. W. 1987, AJ, 93, 1166
Ivans, I. I., Sneden, C., James, C. R., Preston, G. W., Fulbright, J. P., Höflich, P. A., Carney, B. W., & Wheeler, J. C. 2003, ApJ, 592, 906
Johnson, J. A. 2002, ApJS, 139, 219
Kazantzidis, S., Mayer, L., Mastropietro, C., Diemand, J., Stadel, J., & Moore, B. 2004, ApJ, 608, 663
King, I. R. 1966, AJ, 71, 64
Kirby, E. N., Simon, J. D., Geha, M., Guhathakurta, P., & Frebel, A. 2008a, ApJL, 685, L43
Kirby, E. N., Guhathakurta, P., & Sneden, C. 2008b, ApJ, 682, 1217
Klessen, R. S., Grebel, E. K., & Harbeck, D. 2003, ApJ, 589, 798
Kleyna, J., Wilkinson, M. I., Evans, N. W., Gilmore, G., & Frayn, C. 2002, MNRAS, 330, 792
Kleyna, J. T., Wilkinson, M. I., Gilmore, G., & Evans, N. W. 2003, ApJ, 588, L21
Kniazev, A. Y., Grebel, E. K., Pustilnik, S. A., Pramskij, A. G., & Zucker, D. B. 2005, AJ, 130, 1558
Kobayashi, C., Umeda, H., Nomoto, K., Tominaga, N., & Ohkubo, T. 2006, ApJ, 653, 1145
Koch, A., Grebel, E. K., Wyse, R. F. G., Kleyna, J. T., Wilkinson, M. I., Harbeck, D. R., Gilmore, G. F., & Evans, N. W. 2006, AJ, 131, 895
Koch, A., Wilkinson, M. I., Kleyna, J. T., Gilmore, G. F., Grebel, E. K., Mackey, A. D., Evans, N. W., & Wyse, R. F. G. 2007a, ApJ, 657, 241
Koch, A., Grebel, E. K., Kleyna, J. T., Wilkinson, M. I., Harbeck, D. R., Wyse, R. F. G., & Evans, N. W., 2007b, AJ, 133, 270
Koch, A., Kleyna, J. T., Wilkinson, M. I., Grebel, E. K., Gilmore, G. F., Evans, N. W., Wyse, R. F. G., & Harbeck, D. R. 2007c, AJ, 134, 566
Koch, A., et al. 2007d, AN, 328, 652
Koch, A., & McWilliam, A. 2008, AJ, 135, 1551
Koch, A., Grebel, E. K., Gilmore, G. F., Wyse, R. F. G., Kleyna, J. T., Harbeck, D. R., Wilkinson, M. I., & Wyn Evans, N. 2008a, AJ, 135, 1580
Koch, A., McWilliam, A., Grebel, E. K., Zucker, D. B., & Belokurov, V. 2008b, ApJL, 688, L13
Koch, A., et al. 2008c, ApJ, 689, 958
Koch, A. et al. 2009, ApJ, 690, 453
Koposov, S., et al. 2007, ApJ, 669, 337
Koposov, S., et al. 2008, ApJ, 686, 279
Kraft, R. P., & Ivans, I. I. 2003, PASP, 115, 143
Kroupa, P. 1997, New Astronomy, 2, 139
Lanfranchi, G. A., & Matteucci, F. 2004, MNRAS, 351, 1338
Lanfranchi, G. A., Matteucci, F., & Cescutti, G. 2006, A&A, 453, L67
Lanfranchi, G. A., & Matteucci, F. 2007, A&A, 468, 927
Lanfranchi, G. A., Matteucci, F., & Cescutti, G. 2008, A&A, 481, 635
Larson, R. B. 1998, MNRAS, 301, 569
Letarte, B. 2007, PhD Thesis, Rijksuniversiteit Groningen
Liu, C., Hu, J., Newberg, H., & Zhao, Y. 2008, A&A, 477, 139
Łokas, E. L. 2001, MNRAS, 327, L21
Łokas, E. L. 2002, MNRAS, 333, 697
Łokas, E. L. 2009, MNRAS, in press (arXiv:0901.0715)
Mac Low, M.-M., & Ferrara, A. 1999, ApJ, 513, 142
Majewski, S. R., Ostheimer, J. C., Kunkel, W. E., & Patterson, R. J. 2000, AJ, 120, 2550
Majewski, S. R., et al. 2007, ApJL, 670, L9
Marcolini, A., D’Ercole, A., Brighenti, F., & Recchi, S. 2006, MNRAS, 371, 643
Marcolini, A., D’Ercole, A., Battaglia, G., & Gibson, B. K. 2008, MNRAS, 386, 2173
Martin, N. F., Ibata, R. A., Irwin, M. J., Chapman, S., Lewis, G. F., Ferguson, A. M. N., Tanvir, N., & McConnachie, A. W. 2006, MNRAS, 371, 1983
Martin, N. F., Ibata, R. A., Chapman, S. C., Irwin, M., & Lewis, G. F. 2007, MNRAS, 380, 281
Martin, N. F., de Jong, J. T. A., & Rix, H.-W. 2008, ApJ, 684, 1075
Mateo, M., Olszewski, E. W., Pryor, C., Welch, D. L., & Fischer, P. 1993, AJ, 105, 510
Mateo, M. L. 1998, ARA&A, 36, 435
Matteucci, F. 2003, ApS&S, 284, 539
McConnachie, A. W., & Irwin, M. J. 2006, MNRAS, 365, 1263
McConnachie, A. W., et al. 2008, ApJ, 688, 1009
McWilliam, A., Preston, G. W., Sneden, C. & Searle, L. 1995, AJ, 109, 275
McWilliam, A. 1997, ARA&A, 35, 503
McWilliam, A. 1998, AJ, 115, 1640
McWilliam, A., Rich, R. M., & Smecker-Hane, T. A. 2003, ApJL, 592, L21
Miller, G. E., & Scalo, J. M. 1979, ApJS, 41, 513
Monaco, L., Bellazzini, M., Bonifacio, P., Ferraro, F. R., Marconi, G., Pancino, E., Sbordone, L., & Zaggia, S. 2005, A&A, 441, 141
Monelli, M., et al. 2003, AJ, 126, 218
Moore, B., Ghigna, S., Governato, F., Lake, G., Quinn, T., Stadel, J., & Tozzi, P. 1999, ApJ, 524, L19
Morrison, H. L., Harding, P., Hurley-Keller, D., & Jacoby, G. 2003, ApJL, 596, L183
Muñoz, R. R., et al. 2006a, ApJ, 649, 201
Muñoz, R. R., Carlin, J. L., Frinchaboy, P. M., Nidever, D. L., Majewski, S. R., & Patterson, R. J. 2006b, ApJL, 650, L51
Muñoz, R. R., Majewski, S. R., & Johnston, K. V. 2008, ApJ, 679, 346
Navarro, J. F., Frenk, C. S., & White, S. D. M. 1997, ApJ, 490, 493
Nissen, P. E., & Schuster, W. J. 1997, A&A, 326, 751
Peñarrubia, J., Navarro, J. F., & McConnachie, A. W. 2008a, ApJ, 673, 226
Peñarrubia, J., Navarro, J. F., McConnachie, A. W., & Martin, N. F. 2008b, ApJ, submitted (arXiv:0811.1579)
Pont, F., Zinn, R., Gallart, C., Hardy, E., & Winnick, R. 2004, AJ, 127, 840
Prochaska, J. X., Naumov, S. O., Carney, B. W., McWilliam, A., & Wolfe, A. M. 2000, AJ, 120, 2513
Qian, Y.-Z., & Wasserburg, G. J. 2007, PhR, 442, 237
Read, J. I., & Gilmore, G. 2005, MNRAS, 356, 107
Read, J. I., Wilkinson, M. I., Evans, N. W., Gilmore, G., & Kleyna, J. T. 2006, MNRAS, 367, 387
Reddy, B. E., Tomkin, J., Lambert, D. L., & Allende Prieto, C. 2003, MNRAS, 340, 304
Robertson, B., Bullock, J. S., Font, A. S., Johnston, K. V., & Hernquist, L. 2005, ApJ, 632, 872
Rosenberg, A., Saviane, I., Piotto, G., Aparicio, A., & Zaggia, S. R. 1998, AJ, 115, 648
Ryan, S. G., Norris, J. E., & Beers, T. C. 1996, ApJ, 471, 254
Sadakane, K., Arimoto, N., Ikuta, C., Aoki, W., Jablonka, P., & Tajitsu, A. 2004, PASJ, 56, 1041
Salvadori, S., & Ferrara, A. 2008, MNRAS, in press (astro-ph/0812.2151v1)
Sánchez-Salcedo, F. J., Reyes-Iturbide, J., & Hernandez, X. 2006, MNRAS, 370, 1829
Schneider, R., Ferrara, A., Natarajan, P., & Omukai, K. 2002, ApJ, 571, 30
Searle, L., & Zinn, R. 1978, ApJ, 225, 357
Shetrone, M. D., Côté, P., & Sargent, W. L. W. 2001, ApJ, 548, 592
Shetrone, M. D., Venn, K. A., Tolstoy, E., Primas, F., Hill, V., & Kaufer, A. 2003, AJ, 125, 684
Shetrone, M. D., Siegel, M. H., Cook, D. O., & Bosler, T. 2009, AJ, 137, 62
Simon, J. D., & Geha, M. 2007, ApJ, 670, 313
Smecker-Hane, T. A., Stetson, P. B., Hesser, J. E., & Lehnert, M. D. 1994, AJ, 108, 507
Sohn, S. T., et al. 2007, ApJ, 663, 960
Stephens, A., & Boesgaard, A. M. 2002, AJ, 123, 1647
Stoughton, C., et al. 2002, AJ, 123, 485
Strigari, L. E., Bullock, J. S., Kaplinghat, M., Diemand, J., Kuhlen, M., & Madau, P. 2007, ApJ, 669, 676
Strigari, L. E., Bullock, J. S., Kaplinghat, M., Simon, J. D., Geha, M., Willman, B., & Walker, M. G. 2008, Nature, 454, 1096
Suntzeff, N. B., Mateo, M., Terndrup, D. M., Olszewski, E. W., Geisler, D., & Weller, W. 1993, ApJ, 418, 208
Thielemann, F.-K., et al. 2001, PrPNP, 46, 5
Tinsley, B. M. 1975, ApJ, 197, 159
Tinsley, B. M. 1979, ApJ, 229, 1046
Tollerud, E. J., Bullock, J. S., Strigari, L. E., & Willman, B. 2008, ApJ, 688, 277
Tolstoy, E., Venn, K. A., Shetrone, M. D., Primas, F., Hill, V., Kaufer, A., & Szeifert, T. 2003, AJ, 125, 707
Tolstoy, E., et al. 2004, ApJL, 617, L119
Unavane, M., Wyse, R. F. G., & Gilmore, G. 1996, MNRAS, 278, 727
van den Bergh, S. 2008, MNRAS, 390, L51
Venn, K. A., Irwin, M. I., Shetrone, M. D., Tout, C. A., Hill, V., & Tolstoy, E. 2004, AJ, 128, 1177
Walker, M. G., Mateo, M., Olszewski, E. W., Gnedin, O. Y., Wang, X., Sen, B., & Woodroofe, M. 2007, ApJ, 667, L53
Walker, M. G., Mateo, M., Olszewski, E. W., Sen, B., & Woodroofe, M. 2009, AJ, 137, 3109
Walsh, S. M., Jerjen, H., & Willman, B. 2007, ApJL, 662, L83
Wang, X., Woodroofe, M., Walker, M. G., Mateo, M., & Olszewski, E. 2005, ApJ, 626, 145
Wilkinson, M. I., Kleyna, J. T., Evans, N. W., Gilmore, G. F., Irwin, M. J., & Grebel, E. K. 2004, ApJL, 611, L21
Willman, B., et al. 2005a, ApJ, 626, L85
Willman, B., et al. 2005b, AJ, 129, 2692
Woosley, S. E., & Weaver, T. A. 1995, ApJS, 101, 181
Zinn, R., & West, M. J. 1984, ApJS, 55, 45
Zucker, D. B., et al. 2004, ApJL, 612, L121
Zucker, D. B., et al. 2006a, ApJL, 650, L41
Zucker, D. B., et al. 2006b, ApJL, 643, L103
Zucker, D. B., et al. 2007, ApJL, 659, L21