Velocity dispersion measurements of dwarf galaxies in the Coma cluster - implications for the structure of the fundamental plane
Abstract
We present intermediate-resolution spectroscopic data for a set of dwarf and giant galaxies in the Coma Cluster, with The photometric and kinematic properties of the brighter galaxies can be cast in terms of parameters which present little scatter with respect to a set of scaling relations known as the Fundamental Plane. To determine the form of these fundamental scaling relations at lower luminosities, we have measured velocity dispersions for a sample comprising 69 galaxies on the border of the dwarf and giant regime. Combining these data with our photometric survey, we find a tight correlation of luminosity and velocity dispersion, , substantially flatter than the Faber-Jackson relation characterising giant elliptical galaxies. In addition, the variation of mass-to-light ratio with velocity dispersion is quite weak in our dwarf sample: Our overall results are consistent with theoretical models invoking large-scale mass removal and subsequent structural readjustment, e.g., as a result of galactic winds.
keywords:
galaxies: clusters: individual: Coma; galaxies: elliptical and lenticular, cD; galaxies: dwarf; galaxies: kinematics and dynamics; galaxies: fundamental parameters; galaxies: evolution1 Introduction
Dwarf galaxies () are an important constituent of the Universe. They outnumber normal and giant galaxies, and form a distinct family of objects with very different fundamental properties from spirals and ellipticals (Kormendy 1985; Ferguson & Binggeli 1994). The form of the low-mass end of the galaxy mass distribution is an important diagnostic of galaxy formation theories (White & Frenk 1991). A clear understanding of the properties of dwarfs is essential to explore their relation to giant galaxies, to test galaxy formation models, and to establish a local calibrating sample to study properties of low-luminosity galaxies at high redshift. Since the dwarfs are likely to contain large amounts of dark matter in their haloes (Aaronson 1983; Mateo 1998; Wilkinson et al. 2002), any study of their evolution must also take account of their internal dynamics.
The fundamental plane (FP, Djorgovski & Davis 1987; Dressler et al. 1987) relating luminosity, velocity dispersion, surface brightness, and scale length for galaxies presents an important tool for the study of the dwarf galaxy population. In clusters more distant than Virgo and Fornax, spatially resolved spectroscopy becomes very difficult, but it is still possible to measure integrated or central velocity dispersions of large samples with multi-object fibre fed spectrographs. Thus, it is now becoming feasible to examine how the kinematics of low surface brightness galaxies fit in with those of the better-studied giants.
There are serious questions over whether dwarfs follow a continuous sequence with brighter ellipticals in their photometric and kinematic parameters. Nieto et al. (1990) were among the first to extend the FP to galaxies with low luminosity and mass. From a sample of 17 galaxies with in the range -19.4 to -15.3, they found that dwarf ellipticals form a low mass extension to the FP, with a scatter too large to be accounted for by measurement errors alone. They also found that the halo globular clusters lie on the faintward extension of the FP. Held et al. (1992, 1997) reached similar conclusions with a set of dwarf galaxies that excluded the two “most extreme” local group dwarf spheroidals, which are observed to have very high mass-to-light ratios. Incorporating galaxies with luminosities intermediate between the local group dwarfs and giant ellipticals, they found evidence for a continuous trend linking all the objects in their sample on the FP. Peterson & Caldwell (1993), on the other hand, assert that the fundamental plane for dwarf ellipticals is entirely different from that of the giants. Compiling a sample of strongly nucleated galaxies in the range from the literature, they found a steeper dependence of luminosity on velocity dispersion and a change in mass-to-light ratio with luminosity. They claim that this supports scaling relations predicted by Dekel & Silk (1986, hereafter DS86) for the removal of interstellar gas by supernova driven winds in dwarf galaxies surrounded by dominant dark haloes. Nevertheless, their conclusions are heavily influenced by the inclusion of all the local group dwarf spheroidals; it remains to be seen whether these well represent the fundamental plane at faint magnitudes, and if the nucleation has substantially affected the results (cf. Geha, Guhathakurta & van der Marel 2002). Other studies have hypothesized that a mixture of formation mechanisms, including ram pressure stripping of gas-rich dwarf irregulars (van Zee, Skillman & Haynes 2004), primordial formation followed by gas loss in a supernova driven wind (DS86; Arimoto & Yoshii 1987; Yoshii & Arimoto 1987, hereafter YA87), “harassment” (Moore, Katz & Lake 1996), and tidal formation (Kroupa 1998), are involved in setting the observed galaxy properties.
More recently, Geha et al. (2002) and Geha, Guhathakurta & van der Marel (2003) have studied the FP for their sample of 17 Virgo dwarfs (), using the parameterisation of Bender, Burstein & Faber (1992). They showed that the dwarf ellipticals occupy a plane parallel to, but offset from, normal ellipticals. Graham & Guzmán (2003), however, have argued for a continuous progression of FP parameters based on detailed surface photometry from HST archival images for a sample of 18 dE galaxies in the Coma cluster. They modeled the surface brightness profiles with the more general Sérsic (1968) relation rather than the de Vaucouleurs (1948) law to uncover a strong correlation between the Sérsic index , and absolute magnitude. In particular, they find that dwarfs have a Sérsic index in the range 1–2, and in all cases much less than the de Vaucouleurs law. They contend that application of the de Vaucouleurs law where it does not fit will result in derivation of incorrect surface brightness and size parameters, and that these differences will affect lower luminosity galaxies more. They conclude that the photometric scaling relations are continuous and linear, and hence normal and dwarf ellipticals form a single family. However, this does not explain why the dwarfs lie in a different region of the FP, as shown by Geha et al. (2003), who fit Sérsic profiles, and find indices in the range 1–2.
To extend the selection of data on intermediate-luminosity dwarf ellipticals and contribute to ongoing analysis of these objects, we are engaged in a major study of the properties of galaxies in the Coma cluster. From our deep photometric survey (Komiyama et al. 2002, hereafter Kom02) we have constructed a spectroscopic sample (Mobasher et al. 2001, hereafter Mob01) with well defined selection functions. This has been used to investigate the dependence of their stellar components upon galaxy luminosity (Poggianti et al. 2001a), morphology (Poggianti et al. 2001b), and environment (Carter et al. 2002). Spectroscopic observations have been used to identify the cluster members and to investigate the dynamics within the clusters of the dwarf and giant populations (Edwards et al. 2002) and to study the properties of post-starburst galaxies and the correlation between their position and cluster substructure (Poggianti et al. 2004). Here we report on higher resolution spectroscopic observations of a subsample of these galaxies, in order to establish an unbiased FP. Studies of the faint extension of the FP, including ours, concentrate on galaxies in clusters. Largely this is for practical reasons: observations require long exposure times and to obtain sufficient samples multi-object spectrographs are required, which in turn require a high density of targets. While cluster galaxies are more affected by interactions with their environment than field galaxies, by studying regions of different density within the same cluster we can hope to quantify the effect of such interactions and to eliminate them as a source of uncertainty.
Two other recent studies address the same problem. The NOAO Fundamental Plane Survey (NFPS, Smith et al. 2004) is a large survey of over 4000 galaxies in 93 clusters. This survey concentrates on normal elliptical and lenticular galaxies, rather than the dwarfs. The survey was designed for clusters at a range of redshifts, and was carried out at a resolution approximately a factor three worse than ours; thus it is most reliable for velocity dispersions above 100 km s-1. Matković & Guzmán (2005, hereafter MG05) and Matković & Guzmán (2007) present velocity dispersion measurements for a sample of faint early-type galaxies in the core of the Coma cluster. Again, their spectral resolution is worse than that of this study, by a factor of 1.6. Although they present velocity dispersions as low as 35 km s-1, they require a correction for systematic errors at this dispersion, and our sample is in general of galaxies of lower velocity dispersion. Furthermore, their sample is largely in the core of the cluster, whereas our sample contains both the core and lower density regions. Accordingly, our data put us in a position to provide a valuable extension to lower luminosity and less dense environment, with which to study the problem of the origin and properties of dwarf galaxies.
2 Observations
2.1 Source Selection
The spectroscopic targets for this study were selected from our wide-angle photometric (Kom02) and spectroscopic (Mob01), and subsequent papers in the series) catalogues of Coma cluster galaxies. The photometric catalogue provides B and R mags (to ) and colours with an accuracy of 0.1 mag for three fields, covering 1.33 deg2 in Coma. The spectroscopic catalogue covers the Coma1 (central) and Coma3 (1 degree SW of the cluster centre, containing NGC 4839) fields, and was obtained using the Wide-field Fibre Optic Spectrograph (WYFFOS) on the William Herschel Telescope. The WYFFOS spectra, with a resolution of 6–9Å, yield redshifts (and hence cluster membership) and several spectral line indices sensitive to stellar population ages and metallicities (e.g. Poggianti et al. 2001a). The sample chosen for this present, higher-resolution spectroscopic study, was selected to include only spectroscopically confirmed members of the Coma cluster and to have and mag/arcsec2, where and are the Kron magnitudes and average surface brightness over the Kron radius (an intensity weighted radius; Mob01), respectively. These limits correspond to , and thus our sample includes galaxies on either side of the boundary between dwarfs and giants, which we define following Mob01 to be at or at the distance of Coma, assuming a distance modulus of 35.1 for the cluster (Baum et al. 1997). For simplicity, we will primarily refer to these objects as dwarfs, given that the sample as a whole covers a distinct region of parameter space in luminosity and velocity dispersion compared to previous studies. Similar numbers of galaxies were observed in the high density core of the cluster, and in the outskirts (the Coma3 region of Kom02), with a total of 70 fibres on galaxies in the former and 65 in the later. The positional accuracy of the selected targets is , sufficient for spectroscopic purposes.
2.2 Spectroscopic Observations
The intermediate-resolution spectroscopic observations for the present study were obtained with the 3.5-m Wisconsin-Indiana-Yale-NOAO (WIYN) telescope, using the Hydra multifibre spectrograph. The targets were galaxies in the Coma1 and Coma3 fields, selected as described above. These fields were chosen to allow a large density contrast in the location of sample galaxies. The observations were performed over three nights between 28 April and 1 May 2003. We used an exposure time of minutes and minutes for Coma 1 and Coma 3 fields, respectively. The spectra covered a range at per pixel and 1.2 spectral resolution, encompassing the region covered by Mgb and H lines. Copper-argon lamp exposures were taken for wavelength calibration, and dome and twilight flatfields and bias frames were obtained. During each observation, approximately 80 out of the 100 3-diameter fibres were placed on target galaxies. The remaining fibres were assigned to sky. A number of standard stars with spectral types G8V–M0 III were also observed to provide velocity templates and calibration sources.
3 Data Reduction
3.1 General procedures
Standard data reduction techniques were employed. All raw spectra were bias subtracted, using a collection of zero frames that were median-combined with a cosmic-ray rejection algorithm. Sets of dome and twilight flatfield images taken at the beginning and end of each night were combined in a similar manner. Arc lamp exposures taken in succession were also combined. Subsequent data reduction was performed with the IRAF DOHYDRA package. Spectra were flatfielded, sky subtracted, wavelength calibrated, scattered light subtracted, cleaned of bad pixels, and corrected for varying fibre throughput (using flatfields). One night sky line, at 5577 , partially remained and was masked out of later spectral analysis. After object spectra were extracted, all frames taken of each field were combined using median scaling and cosmic ray rejection. Sky subtraction was neglected for the short exposures of bright standard stars. The final spectra were rebinned to a log-linear wavelength scale with 2048 pixels. Signal-to-noise values were substantially lower than expected (i.e., 60% of the targets had signal-to-noise ratios of 10 per or lower), but none the less our spectral resolution still allows us to derive velocities with reasonable uncertainties, as discussed in 3.3. Several example spectra are shown in Figure 1.

3.2 Radial velocities and dispersions
To measure the redshift and amount of broadening present in each galaxy spectrum, we adopted the Fourier cross-correlation technique, originally developed by Tonry & Davis (1979). We chose this over more sophisticated methods that provide second-order velocity moments, because of the limitations of our mediocre signal-to-noise levels. Galaxies were cross-correlated with each of five stellar velocity templates, using the IRAF package FXCOR. All spectra were apodised down to 5% at the ends with a cosine bell. In addition, they were filtered in the fourier domain with a ramp function to remove additional unwanted noise.
Galaxy spectra were cross-correlated with the template spectra in the region 4740 to 5726 , with the night sky line masked out. Four template stars– HD 62509, HD 65583, HD 75839, and HD 90861– were observed with the same spectroscopic setup and comprised spectral types G8V, K2 III, and K0 IIIb. HD 65583 was observed with two different fibres. Redshifts were computed from the position of cross-correlations peaks, and velocity dispersions were determined from the widths of the peaks. In order to convert from full-width at half maximum (FWHM) of the cross-correlation peaks to a true velocity dispersion, calibration curves were produced by broadening the template stars with gaussian kernels of different velocities, and cross-correlating the resulting spectra against the original templates. This technique allows for reasonably accurate measurement of dispersions down to the instrumental resolution limit where the FWHM reaches 120 km s-1. At the distance of the Coma Cluster (105 Mpc), the 3 diameter aperture is equivalent to 1.53 kpc. Hence our velocity dispersions are effectively averaged out to a radius of 0.76 kpc. We believe this is preferable to obtaining central velocity dispersions, since Geha et al. (2002) have shown that galactic nuclei occupy a region of the fundamental plane separate from the underlying galaxy, and much closer to the globular clusters (a low-mass, high surface brightness region). To assess the degree of mismatch between template spectra and galaxies, we examined the spread of dispersion values obtained for each galaxy. No individual template produced consistently discrepant dispersions, and the 1- variation of values returned by different templates was typically 1-5 km s-1. Although the spread in the spectral types is small enough that perhaps little velocity variation would be expected, tests using more extensive template sets (see §4.1) did not produce systematic shifts in the results. Hence, for each galaxy we averaged the results of all templates. We used the Tonry-Davis coefficient (TDR; Tonry & Davis, 1979) as a measure of goodness of fit to the cross-correlation peak; typically TDR values less than 3.0 are unreliable. However, our adopted signal-to-noise requirement of S/N7 (§3.3) proved to the dominant selection criterion, leading to the removal of all but one galaxy (GMP 4351) with TDR6 from the sample. This remaining galaxy was retained since no single cross-correlation template produced a TDR value less than 3.0.
3.3 Error analysis
The primary source of uncertainty in our results is poor signal-to-noise. We suspect that misalignments of the fibres with the target galaxies due to a combination of astrometric measurement and transformation and physical positioning errors is responsible for this problem. To determine the relationship between signal-to-noise and accuracy of dispersion measurements, we have performed bootstrap simulations in which template star spectra are broadened to a variety of velocities, combined in equal proportions of spectral types to create a “fake” galaxy, and subsequently augmented with random noise to achieve a particular signal-to-noise ratio (S/N). The resulting “galaxy” spectrum is then cross-correlated with the original templates to determine what the range of measured velocity dispersions would be. The process of adding noise and measuring the dispersion is carried out 300 times for each S/N and velocity broadening value, and a gaussian is fit to the results. An example simulation for the template star HD 62509 cross-correlated against fake galaxies with S/N=15 per and broadening values, , from 10 to 100 km s-1 is shown in Figure 2. Although each value of leads to a symmetric, gaussian distribution of measured dispersion, in some cases there are offsets between the value of and the mean measurement. This occurs particularly at low dispersions where the cross correlation method tends to produce overestimates. As explained below, we include this effect as an additional source of uncertainty. At higher dispersion, the larger broadening values also lead to a larger spread. Nevertheless, the widths and peaks of the distributions follow regular trends across the entire range of , to which we have fit polynomial functions; this enables us to predict the distribution resulting from any .

Calculating the uncertainties for a measured dispersion requires an inversion of these distributions to obtain the probability that it was derived from any true dispersion, (what is plotted in Figure 2 shows the opposite). We have done this by discretising the probability distribution in increments of 1 km s-1 up to a maximum of 140 km s-1: for each , the probability of measuring is denoted P(). We solve for the values of P() by integrating the gaussian distributions for each from -0.5 km s-1 to +0.5 km s-1, since our measurements are probably not accurate to better than 1 km s-1. The conditional probability for true dispersion is hence given by:
The results of this computation are displayed in Figure 3.

The resulting distributions of velocity dispersion illustrate how accurate our measurements are for low S/N. As seen in Figure 3, they are slightly asymmetric, due to the fact that larger velocity dispersions produce a larger spread in the measured . Velocity dispersion is also correlated with galaxy brightness, in the sense that giant ellipticals have both larger velocity dispersions and luminosities than dwarfs. Therefore, because we observed the galaxies in the sample for equal periods of time, low dispersion values correlate with low S/N.
For each value of S/N, we combine the results of simulations involving each of the five template stars. The 1- uncertainties for each velocity dispersion value are derived by integrating the distributions in Figure 3 to of their total area to either side of the peak. If the peak does not fall on the measured value, the difference between these two is incorporated (added in quadrature) as a systematic error. After adding the 1- uncertainties from each template in quadrature, we find that we can measure dispersions near 15 km s-1 with 25% accuracy at S/N7 per and near 25 km s-1 with 15% accuracy for S/N8. We attain 6% accuracy for the galaxies that have 35 km s-1 and S/N15. For S/N values above 20, and dispersions larger than 40 km s-1, we achieve an uncertainty of 3%. Because accurate dispersion measurements require reasonably high signal-to-noise ratios, we have disregarded most spectra with S/N. This condition was relaxed for several of the dwarfs with very low velocity dispersion; errors of % were permitted for these objects, since we believe it is important to extend the sample to galaxies with low surface brightness.
Uncertainties were calculated individually for each of the galaxies and are quite small– on the order of 2-4 km s-1. The derived uncertainties could be overly optimistic– especially given that our fake galaxy spectra consist of only five stars (of which one is the exact template), as opposed to millions in a true galaxy spectrum. We discuss this further in § 4.1. However, our confidence is increased by the fact that in most cases, the spread in velocity dispersion measurements from the five different template spectra is less than the uncertainty we have estimated from the simulations. The final tally of galaxies observed that we believe to have reliable velocity dispersion measurements includes 36 galaxies in Coma 1 and 33 galaxies in Coma 3.
4 Results
We present our measured velocities and velocity dispersions in Table LABEL:resultstable. In this table column 1 gives the identification from Godwin, Metcalfe & Peach (1983); column 2 the identification from our own programme (Kom02, Mob01); column 3 a morphological type, estimated visually from the R band mosaic CCD image; columns 4 and 5 the J2000 position of the galaxy; columns 6 and 7 the R-band and B-R Kron magnitude (see Kom02 for a definition); column 8 the effective R-band surface brightness (average surface brightness within the effective radius; Kom02), columns 9 and 10 the heliocentric recession velocity and its error in km s-1; columns 11 and 12 the velocity dispersion and its error in km s-1; and column 13 the signal-to-noise per . In column 3, E and dE galaxies are delineated by the boundary ( at the distance of Coma) chosen by Mob01.
4.1 Comparison with external data
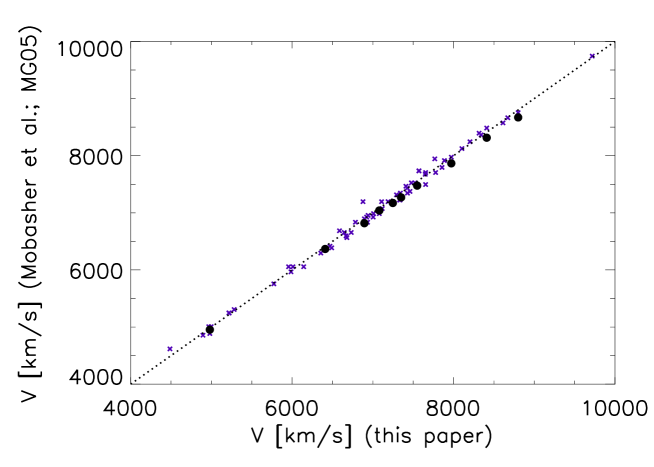
We compare our radial velocities with those derived from our WYFFOS observations of a larger spectroscopic sample (Mob01). All of our galaxies already have velocities from that paper, and in Figure 4 we compare the velocities. The mean difference between the two datasets is 2.7 km s-1, in the sense that the WYFFOS velocities are higher, and the scatter about the linear relation is 81 km s-1. Most of the scatter can be attributed to errors on the WYFFOS velocities, which were obtained at lower resolution. Ten of our galaxies are common with the sample of MG05. These velocities are also compared in Figure 4. The mean difference in this case is 75 km s-1, in the sense that our velocities are higher, with a scatter of 32 km s-1. We conclude that there is a systematic offset in the velocity system of the MG05 data, of about 75 km s-1, but that the random error in each dataset is of the order 32/22 km s-1. The random error is our WYFFOS dataset is probably twice this.
In Figure 5 we compare the velocity dispersions with those of MG05 for the ten galaxies in common. There is considerable scatter about the 45 degree line in this plot; however this plot only covers a small range in . We find that a formal fit gives an offset in of 0.157, in the sense that MG05 dispersions are higher, and an rms of 0.171 about this value. However a substantial part of this is due to a single galaxy, GMP3018, for which we measure a dispersion of 20 km/s, and MG05 measure 75 km/s. The cause of this is unclear, it could be due to a misidentification in one of the two studies, or it could be due to poor signal-to-noise (of the ten galaxies in common, GMP has the lowest signal-to-noise in both studies).
At the suggestion of the referee, we have investigated whether the offset is systematic, as might be caused by a calibration error in one study or the other, or is due to a signal-to-noise problem. In Figure 6 we plot the differences in against S/N from each study. The most likely cause of the differences would appear to be effects due to the poor signal-to-noise in the fainter galaxies. Given that our spectral resolution is a factor two higher than MG05, and given also that the strongest correlation is with their S/N, it is likely that our dispersions are reliable to lower values. However, even with our resolution, dispersions below 30 km s-1 are likely to be systematically too high.


In figure 6 we show also linear least-squares fits as a function of signal-to-noise. The linear fits are:
In section 4.2 we will use the second of these two relations to transform the MG05 dispersions onto our system. We estimate that this fit only applies for S/N values up to 30, above which there is sufficient agreement between the two datasets. Due to the large measurement uncertainties, we do not fit higher order functions to the data.
To ensure that our lower dispersion measurements are not strictly the result of the method of computing velocity dispersions, we have performed an additional analysis with the Penalized Pixel-fitting method (pPXF; Cappellari & Emsellem 2004). This approach reconstructs the line-of-sight velocity distribution via a parametric fit to the galaxy spectra using large numbers of stellar templates. For high signal-to-noise data, it permits the extraction of higher order moments of the velocity distribution. However, for the lower S/N values of our spectra, we do not expect to accurately measure departures from a gaussian profile. Hence, we employ pPXF as a check on the dispersions for the subset of ten galaxies in common between our data and those of MG05, but retain FXCOR as our method of choice for the overall results.
For each galaxy in the comparison, we have computed velocity dispersions with both FXCOR and pPXF using several different sets of stellar template spectra. In addition to the five templates obtained with our Hydra setup, we have incorporated large numbers of spectra from the Indo-U.S. Library of Coudé Feed Stellar Spectra (Valdes et al. 2004 ). The pPXF program efficiently computes velocity dispersions for large sets of templates, thereby allowing us to eliminate the effects of template mismatch. Among the template sets used to measure dispersions were five Coudé Feed Library (CF) templates with spectral types matched to those of our Hydra spectra, 60 CF templates with spectral types ranging from A through M, 40 CF templates with spectral types from G to M, and two CF spectra for stars in our Hydra sample (HD 62509 and HD 65583). To compare the different realizations of dispersions, we have degraded the CF spectra to the resolution of Hydra and computed the average offset between measurements of the same galaxies. To determine the significance of these differences, we apply the Kolmogorov-Smirnov (KS) test to different pairs of dispersion measurements on all ten galaxies. Our results indicate that FXCOR and pPXF return galaxy velocity dispersions that agree to within 5% ( km s-1 offset, of the order the uncertainties), or a significance of 98% when the same template set is used. This confirms that the measurements are not dependent on the computational method. We also find that regardless of templates or method used, dispersions measured for our ten galaxies in common with MG05 are systematically offset by , at a significance of 90–95% (i.e., only a 5–10% chance that these differences are due to random variation). We conclude that the difference between our measurements and those of MG05 is real, at least at the low dispersions of the 10 galaxies in question.
In addition, we have used the results of our tests with pPXF to assess the dependence of the velocity dispersions on the number of templates and their spectral types. The majority of these experiments produced results in agreement with our original measurements using FXCOR and Hydra templates. However, in a few cases the agreement is only marginal (67% level). Surprisingly, the most discrepant velocity dispersions resulted from a trial of five CF templates with spectral types matching those of the five Hydra templates. The two sets of templates produced dispersions differing by an average of 5 km/s, a disagreement at the 31% level). This cannot be due to template mismatch, and we attribute the disparity to differences in instrumental setup and resolution (despite the fact that we have degraded the CF spectra to match ours). We also note that in the cases where CF library templates yield significantly different velocity dispersions from those of the Hydra templates, the measurements are always lower. Hence, this does not explain the even larger discrepancy with the MG05 results. Because there appears to be an unknown source of km s-1 variation in the results that is not accounted for by template mismatch, we incorporate it as an additional uncertainty to our velocity dispersions. Errors listed in Table LABEL:resultstable are thus the formal uncertainties calculated in §3.3, plus a template mismatch error given by the average difference between dispersions from different Hydra templates, plus the km s-1 additional uncertainty, all added in quadrature.
4.2 Trends with velocity dispersion
To assess our data in the context of the well-known properties of giant ellipticals, we have plotted a number of photometric parameters for galaxies from Mob01 against the velocity dispersions. The velocity dispersion values for our galaxies are almost exclusively less than 100 km s-1, while the vast majority of those measured for galaxies traditionally considered “giants” are greater than 100 km s-1, and often 200 km s-1. In Figure 7 we plot the relation between log and absolute magnitude in the R band. The distribution of parameters can be seen in the accompanying histograms. The absolute magnitudes in this fit were derived from our R band apparent magnitude within three Kron radii (Mob01), again assuming a distance modulus of 35.1 magnitudes, and an extinction in the R band of 0.03 magnitudes (Bernstein et al. 1995). Different symbols in this plot represent different morphological types (from Table LABEL:resultstable).
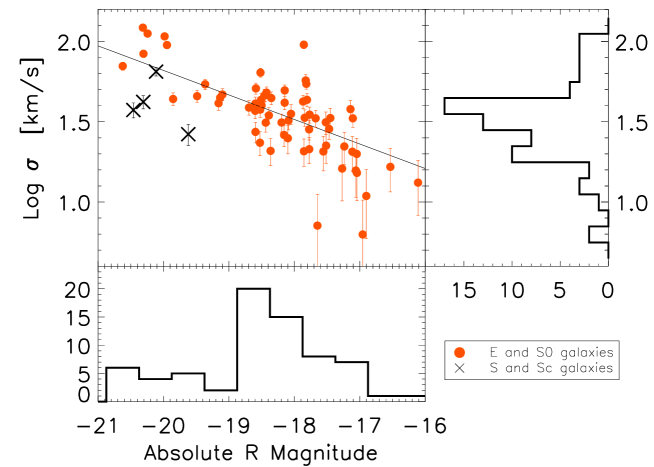
Our sample contains four galaxies which according to our visual classification are, or might possibly be, spirals (crosses in Figure 7). In calculating our best-fitting regression line, we exclude these galaxies, and find a relation . In this and all other regression fits we minimise residuals in , as the errors in this quantity are far larger than those on the photometric parameters. This gives an relation of the form , which is substantially flatter than the Faber-Jackson relation for giant ellipticals (, Faber & Jackson 1976) but consistent with results presented by MG05 and previous authors.
To investigate whether the inclusion of galaxies with low signal-to-noise spectra might bias the results, we have repeated the analysis, excluding those galaxies with spectra with . In figure 8 we plot the remaining galaxies, and the fit to the slope of the relation. We find , giving , so the slope does not differ significantly from that for the whole sample.

To increase the size of our sample at the brighter end of this correlation, for those galaxies in common between MG05 and Mob01 we have moved the MG05 dispersions onto our system, using the second of the two linear correlations presented in Section 4.1. In figure 9 we plot our dispersions and the transformed MG05 values, together with a fit showing an relation of the form , entirely consistent with that defined by our sample alone.

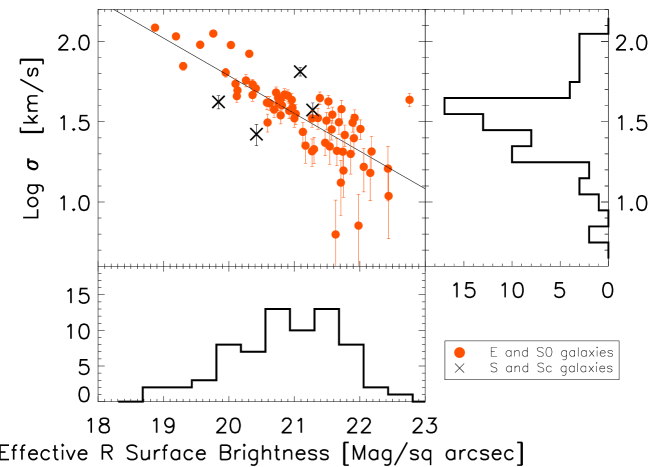
In Figure 10 we plot log against the effective surface brightness from Mob01. The best-fitting linear regression line is , where is the average R band surface brightness within the effective radius, in magnitudes arcsec-2. This corresponds to a relation of the form , where is effective surface brightness in flux units, in the R band. The relationship between surface brightness and velocity dispersion also differs from that of the giant ellipticals. Using the result of from Binggeli, Sandage & Tarenghi (1984) with the Faber Jackson relation, we expect for giant elliptical galaxies. Our value for the lower-luminosity galaxies in this sample is thus quite different.
Another trend to explore is that of velocity dispersion and effective radius. The latter is directly related to luminosity and effective surface brightness via Using our measured relationships between , luminosity and surface brightness we derive . This is just consistent with the relation that would be derived using the established trend for dwarf ellipticals (Binggeli et al. 1984), which is and the measured relation from MG05 and our work, which would together give . It is however inconsistent with the relation for giants, derived from Fish’s (1964) law () and the Faber-Jackson relation, which together imply .
Since the mass-to-light ratio, , is an important indicator of galaxy properties, we have computed its variation with for our dwarf sample. Assuming the galaxies we have observed form a homologous sequence, we can compute the expected as a function of by applying the virial theorem (e.g., Mobasher et al. 1999; D’Onofrio et al. 2006). This results in (e.g. Richstone & Tremaine 1986). Regarding the radius as an independent parameter, we express it in terms of surface brightness and luminosity to obtain . Substituting our observed dependence of and upon , we obtain
4.2.1 Trends with Radius within the cluster
The mechanisms proposed to explain the differences in scaling laws between giants and dwarfs (Section 1) may be affected by environment. In particular, winds may be constrained and ram-pressure stripping enhanced by the hot gas density in cluster cores, and the importance of harassment and tidal dwarf formation depends upon both the galaxy density and velocity dispersion. Furthermore, Smith et al. (2008), working in precisely the same regions of the Coma cluster, found a significant environmental dependence of the stellar population properties in dwarf galaxies, and thus evidence of environmental influence on the star formation history. As our sample includes galaxies in the infall region of the cluster, we can search for a possible environmental dependence of the relation, as a counterpart to the environmental dependence of the properties of the stellar populations. To undertake this comparison we divide our sample into the Coma1 and Coma3 regions of Kom02, which separates the sample at a clustocentric radius of 0.49 degrees. However, our sample has a different luminosity distribution within these two regions; the outer Coma3 sample contains many more galaxies with , so we limit this analysis to galaxies with .
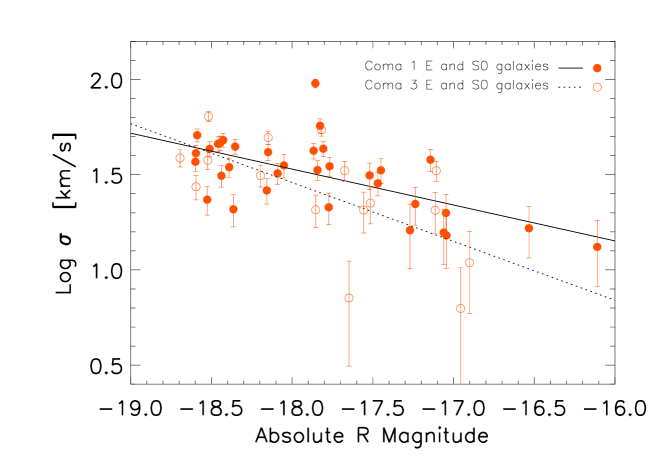
In Figure 11 we show the relation for our inner and outer fields. The slope of the fit is shallower in the outer field ( as opposed to ). Despite the marginal significance of the difference we find, this possible environmental effect merits further investigation by increasing the sample, and thus lowering the error bar, in the outer region.
5 Discussion
Our results confirm that galaxies in the dwarf regime do not follow the standard empirical relations established for giant ellipticals. Of primary interest is the fact that the relation for dwarfs is substantially shallower than the classical Faber-Jackson relation. This was initially suggested by Davies et al. (1983), whose kinematic study of 11 faint elliptical galaxies with led to . Many independent studies have found a relation between and in the R or B band (Held et al. 1992; De Rijcke et al. 2005; MG05). Peterson & Caldwell (1993), on the other hand, found a much steeper by including the local group dwarf spheroidal galaxies. Our study indicates that in an intermediate luminosity range, , galaxies continue to follow the shallower relation. In addition, the observed relation between surface brightness and velocity dispersion is different from that of giant ellipticals but consistent with that implied by the position of dEs in Figure 1c of De Rijcke et al. (2005).
To confirm that the derived scalings for dwarf galaxies are substantially different from those of the giants, we must assess potential sources of bias. Surface brightness selection and morphological misclassification of low surface brightness galaxies can bias the sample– although elliptical and lenticular galaxies follow the same relations (Jørgensen & Franx 1994), spiral galaxies do not. Performing a linear regression on all of the data plotted in Figure 7, we find that the effect of contamination by spirals on the relation is to increase the index; thus inclusion of late-type galaxies does not explain the difference from the Faber-Jackson relation for giants. Likewise, the difficulty in measuring velocity dispersion for the low surface brightness galaxies could produce erroneously high values, but would also have the effect of raising the index in the relation. The same reasoning holds for the run of surface brightness versus velocity dispersion; the index of the - relation would increase due to spiral contamination, and the implied relation would only change slightly.
Finally, we address the possibility that the luminosity and velocity dispersion values are systematically affected by the way we have defined these parameters. Luminosities have been derived from Kron magnitudes, which have been shown to agree with standard fixed-aperture magnitudes to within 2% (Mob01). If this is a cause of measurement bias, such a percent-level effect would be well within the scatter of the data. Velocity dispersions must also be carefully defined, as some studies report central values, while others provide averages over a particular galactic radius. Fortunately, radius-dependent studies of velocity dispersion have shown that it varies only on the order of 10% out to large radii (e.g., Bender & Nieto 1990). Our own velocity dispersions have been measured over a 3″ diameter, equivalent to 1.53 kpc. As discussed in § 3.2, we believe this is preferable to obtaining a truly central measurement, to sample kinematics that are not dominated by the nucleus. In addition, a number of studies on giants to which we compare our data have also used normalized apertures, as suggested by Jørgensen, Franx, & Kjærgaard (1996). With this approach, Jørgensen (1999) obtained velocity dispersions for Coma giants within a 3.4″diameter, corresponding to 1.73 kpc. The similar aperture size employed in the present study allows for a direct comparison with these data. Thus we are confident that the differences between the relations shown in Figures 7 and 10, and the equivalent relations for brighter galaxies, reflect the intrinsic properties of the samples, and are not due to biases in the sample selection or the methods employed to make the measurements.
It is unclear whether there is a true dichotomy between giants and dwarfs, or simply a continuous set of relations with gradually changing slopes. Nevertheless, we can explore the possible reasons for the observed dwarf galaxy scalings by comparing them with theoretical predictions based on the physical processes thought to operate in these galaxies. Although rotation was initially suggested as a cause for the differing kinematic parameters, and specifically the flattening of dwarf galaxies, recent work by Simien & Prugniel (2002), Geha et al. (2003), and MG05 has cast doubt on this idea. The anisotropic velocity dispersions observed in dwarfs have been also accounted for by invoking galactic winds spawned by supernovae, as suggested by Bender & Nieto (1990). Winds are thought to dominate in objects with velocity dispersions under 60 km s-1 (Schaeffer & Silk 1988). The processes of gas loss, galaxy inflation and associated re-adjustment to a new virial equilibrium provide an attractive way to explain differences between the scaling relations of dwarf and giant ellipticals. We consider this theory more promising than other mechanisms such as dissipation, merging, or tidal stripping of disk galaxies, since these do not appear capable of moving galaxies in the direction of the region that dwarfs occupy in surface brightness and velocity dispersion parameter space (e.g., Bender & Nieto 1990; Bender et al. 1992; De Rijcke et al. 2005). Hence, we use the predictions of galactic wind models from DS86 and YA87 to test this scenario against the trends seen in our data.
The models of DS86 describe gas loss from self-gravitating systems with similar age and initial stellar mass function. If the galaxy’s dynamics are dominated by a dark matter halo, they predict and leading to If instead the galaxies contain only baryonic matter and have roughly constant (because of the similar stellar content), they find that after gas loss, dwarfs should adhere to YA87 provide a finer level of distinction with two different rates of gas expulsion: slow and rapid. Such models specify a fraction of the galaxy’s gas mass to be blown out, the time-scale on which it happens, and the new galaxy structure from the resulting virial equilibrium (although in the case of rapid gas removal, equilibrium is not necessarily reached). For dwarf galaxies that have undergone a complete course of slow, adiabatic gas removal, they obtain and mass-to-light ratios that scale inversely with luminosity. However, it should be noted that these scaling relations only apply to the end stage of gas removal; if not all dwarf galaxies have reached this point, then a substantial scatter in their properties might be expected, as suggested by Figure 9 of YA87. De Rijcke et al. (2005) overlay a number of late-type galaxies on these galactic wind models, showing a consistency between the positions of dwarf ellipticals, and models including gas removal.
Our data indicate a slow positive trend of with velocity dispersion, of the form . Whilst this is in broad agreement with the galactic wind models discussed above, it is very different from results from giant galaxies. For giants, the exponents in the range 0.66 to 1.4 have been found in the optical (Jørgensen et al. 1996,1998; Guzmán, Lucey & Bower 1993) and the near infra-red (Mobasher et al. 1999). It is also different from the trend found for the much lower luminosity local group dwarfs. There Peterson & Caldwell (1993) find which, together with their measured relation , yields
Several recent studies have suggested a large variation of slope in the relation over many orders of magnitude in galaxy luminosity. From data on a number of clusters, Zaritsky, Gonzalez & Zabludoff (2006) have revealed a dependence that is roughly parabolic and not well represented by a power law. Their trend of on becomes flat near and is very consistent with our result of obtained for galaxies with dispersions in that regime. Desroches et al. (2007) also find significant curvature in the relation among a large set of galaxies from the Sloan Digital Sky Survey, although their sample primarily encompasses objects with significantly larger luminosities and velocity dispersions than our dwarf data. Cappellari et al. (2006) have calculated values based on dynamical models of the SAURON galaxy sample (Bacon et al. 2001) and conclude that non-homology effects play only a small role in setting the fundamental scaling relations among late-type galaxies; stellar population effects and dark matter properties must instead account for changing mass-to-light ratios.
6 Conclusions
We have presented velocity dispersions for a sample of 69 dwarf and giant galaxies in the Coma cluster, of which 62 are either elliptical or S0 galaxies in their morphology. We find that the fundamental parameters of low-luminosity ellipticals vary fairly tightly with the velocity dispersion. The relationship between luminosity and velocity dispersion at the boundary of the dwarf and giant regime is clearly different from the classical Faber-Jackson relation for giant elliptical galaxies. The correlation between surface brightness and velocity dispersion in our sample is also very tight and can be explained by observational error in the velocity dispersions alone. There is evidence that the mass-to-light ratio varies systematically along this correlation, with the higher surface brightness galaxies having higher (). We have investigated whether gas removal by galactic winds can explain these results and find that it provides a satisfactory origin for the relation and a possible basis for the trend in mass-to-light ratio.
Acknowledgments
The WIYN Observatory is a joint facility of the University of Wisconsin-Madison, Indiana University, Yale University, and the National Optical Astronomy Observatories. A.M.C. acknowledges the AAO Student Fellowship Program for support of this work. We would like to thank Pat Knezek and Megan Sosey for help with the observations, as well as WIYN Hydra Instrument Scientist Diane Harmer for assistance with observing preparations. We thank the anonymous referee for helpful comments.
References
- Aaronson (1983) Aaronson M. 1983 ApJ, 266, 11
- Arimoto& Yoshii (1987) Arimoto N., Yoshii Y. 1987 A&A, 173, 23
- Bacon et al (2001) Bacon R., et al. 2001 MNRAS, 326, 23
- Baum et al (1997) Baum W. A., Hammergren M., Thomsen B., Groth E. J., Faber S. M., Grillmair C. J., Ajhar E. A. 1997 AJ, 113, 1483
- Bender and Nieto (1990) Bender R., Nieto J.-L. 1990 A&A, 239, 97
- Bender et al (1992) Bender R., Burstein D., Faber S. M. 1992 ApJ, 399, 462
- Bernstein et al (1995) Bernstein G. M., Nichol R. C., Tyson J. A., Ulmer M. P., Wittman D. 1995 AJ, 110, 1507
- Binggeli et al (1984) Binggeli B., Sandage A., Tarenghi M. 1984 AJ, 89, 64
- Cappellari et al (2006) Cappellari M. et al. 2006 MNRAS, 366, 1126
- Cappellari and Emsellem (2004) Cappellari M., Emsellem E. 2004 PASP, 116, 138
- Carter et al (2002) Carter D., et al. 2002 ApJ, 567, 772
- Davies et al (1983) Davies R. L., Efstathiou G., Fall S. M., Illingworth G., Schechter P. L. 1983 ApJ, 266, 41
- de Rijcke et al (2005) De Rijcke S., Michielsen D., Dejonghe H., Zeilinger W. W., Hau G. K. T. 2005 A&A 4338, 491
- de Vaucouleurs (1948) de Vaucouleurs G. 1948 Ann. d’Astrophysique, 11, 247
- Dekel and Silk (1986) Dekel A., Silk J. 1986 ApJ, 303, 39
- Desroches et al (2007) Desroches L.-B., Quataert E., Ma C.-P., West A. 2007 MNRAS, 377, 402
- Djorgovski and Davis (1987) Djorgovski S., Davis M. 1987 ApJ, 313, 59
- D’Onofrio et al (2006) D’Onofrio M., Valentinuzzi T., Secco L., Caimmi R., Bindoni D. 2006 NewAR, 50, 447
- Dressler et al (1987) Dressler A., Lynden-Bell D., Burstein D., Davis R. L., Faber S. M., Terlevich R., Wegner G. 1987 ApJ, 313, 42
- Edwards et al (2002) Edwards S. A., Colless M. M., Bridges T. J., Carter D., Mobasher B., Poggianti B. M. 2002 ApJ, 567, 178
- Faber and Jackson (1976) Faber S. M., Jackson R. E. 1976 ApJ, 204, 668
- Ferguson and Binggeli (1994) Ferguson H. C., Binggeli B. 1994 A&AR, 6, 67
- Fish (1964) Fish R. A. 1964 ApJ, 139, 284
- Geha et al (2002) Geha M., Guhathakurta P., van der Marel R. P. 2002 AJ, 124, 3073
- Geha et al (2003) Geha M., Guhathakurta P., van der Marel R. P. 2003 AJ, 126, 1794
- Godwin et al (1983) Godwin J., Metcalfe N., Peach J. V. 1983 MNRAS, 202, 113
- Graham (2003) Graham A., Guzmán R. 2003 AJ, 125, 2396
- Guzmán et al (1993) Guzmán R., Lucey R., Bower R. 1993 MNRAS, 265, 731
- Held et al (1992) Held E. V., de Zeeuw P. T., Mould J. R., Picard A. 1992 AJ, 103, 851
- Held et al (1997) Held E. V., Mould J. R., Freeman K. C., 1997, in Arnaboldi, M., da Costa, G. S., Saha, P., eds, ASP Conf. Ser. Vol. 116, The Nature of Elliptical Galaxies. Astron. Soc. Pac., San Francisco, p.292
- Jørgensen & Franx (1994) Jørgensen I., Franx M. 1994 ApJ, 433, 553
- Jørgensen et al (1996) Jørgensen I., Franx M., Kjærgaard P. 1996 MNRAS, 280, 167
- Jørgensen et al (1999) Jørgensen I., Franx M., Hjorth J., van Dokkum P. 1999 MNRAS, 308, 833
- Jørgensen (1999) Jørgensen I. 1999 MNRAS, 306, 607
- Komiyama et al (2002) Komiyama Y. et al. 2002 ApJS, 138, 265
- Kormendy (1985) Kormendy J. 1985 ApJ, 295, 73
- Kroupa (1998) Kroupa P. 1998 MNRAS, 300, 200
- Mateo (1998) Mateo M., 1998, in Richtler T., Braun J. M., eds, Proc. Bonn/Bochum-Graduiertenkolleg Workshop, The Magellanic Clouds and Other Dwarf Galaxies. Shaker Verlag, Aachen, p. 53
- Matkovíc and Guzmán (2005) Matkovíc A., Guzmán R. 2005 MNRAS, 362, 289
- Matkovíc and Guzmán (2007) Matkovíc A., Guzmán R. 2007 RevMexAA, 29, 107
- Mobasher et al (2001) Mobasher B. et al. 2001 ApJS, 137, 279
- Mobasher et al (1999) Mobasher B., Guzmán R., Aragó-Salamanca A., Zepf S. 1999 MNRAS, 304, 225
- Moore et al (1996) Moore B., Katz N., Lake G. 1996 ApJ, 457, 455
- Nieto et al (1990) Nieto J.-L., Bender R., Davoust E., Prugniel P. 1990 A&A, 230, L17
- Peterson and Caldwell (1993) Peterson R. C., Caldwell N. 1993 AJ, 105, 1411
- Poggianti et al (2001) Poggianti B.M. et al. 2001a ApJ, 562, 689
- Poggianti et al (2001) Poggianti B. M. et al. 2001b ApJ, 563, 118
- Poggianti et al (2004) Poggianti B. M., Kashikawa N., Bridges T. J., Mobasher B., Komiyama Y., Carter D., Okamura S., Yagi M. 2004 ApJ, 601, 197
- Richstone and Tremaine (1986) Richstone D. O., Tremaine S. 1986 AJ, 92, 72
- Schaeffer and Silk (1988) Schaeffer R., Silk J. 1988 A&A, 203, 273
- Sérsic (1968) Sérsic J. L., 1968, Atlas de Galaxias Australes. Observatorio de Córdoba, Argentina
- Simien and Prugniel (2002) Simien F., Prugniel Ph., 2002 A&A, 384, 371
- Smith et al (2004) Smith R. J. et al. 2004 AJ, 128, 1558
- Smith et al (2008) Smith R. J. et al. 2008 MNRAS, 386, L96
- Tonry & Davis (1979) Tonry J., Davis M. 1979 AJ, 84, 1511
- Valdes et al (2004) Valdes F., Gupta R., Rose J., Singh H., Bell D. 2004 ApJS, 152, 251
- van Zee et al (2004) van Zee L., Skillman E. D., Haynes M. P. 2004 AJ, 128, 121
- White & Frenk (1991) White S. D. M., Frenk C. S. 1991 ApJ, 379, 52
- Wilkinson et al (2002) Wilkinson M. I., Kleyna J., Evans N. W., Gilmore G. 2002 MNRAS, 330, 778
- Yoshii & Arimoto (1987) Yoshii Y., Arimoto N. 1987 A&A, 188, 13
- Zaritsky et al (2006) Zaritsky D., Gonzalez A., Zabludoff A. 2006 ApJ, 638, 725
Appendix A Velocity and velocity dispersion data
| GMP | Komiyama | Type | RA | Dec | Kron R | B-R | cz | Error | Error | S/N | ||
| ID | ID | (J2000) | (J2000) | mag. | mag. | mag/(″)2 | km s-1 | km s-1 | km s-1 | km s-1 | (per Å) | |
| 4644 | 48397 | dE | 12 58 34.1 | 26 53 60 | 18.17 | 1.37 | 21.63 | 8103 | 5 | 6 | 4 | 7.0 |
| 5361 | 50320 | E | 12 56 36.0 | 26 54 18 | 16.44 | 1.42 | 20.97 | 7886 | 4 | 39 | 4 | 13.7 |
| 4518 | 55692 | E | 12 58 03.2 | 26 54 58 | 14.51 | 1.41 | 19.30 | 8203 | 6 | 70 | 4 | 16.6 |
| 4340 | 53772 | E/S0 | 12 58 20.3 | 26 55 14 | 16.93 | 1.24 | 20.59 | 6934 | 3 | 31 | 3 | 20.9 |
| 4418 | 59497 | dE | 12 58 13.0 | 26 56 59 | 18.02 | 1.47 | 21.74 | 6732 | 6 | 21 | 5 | 7.0 |
| 4980 | 65832 | E/S0 | 12 57 18.6 | 26 58 47 | 17.46 | 1.42 | 21.27 | 7293 | 4 | 34 | 4 | 12.0 |
| 5395 | 83625 | S0 | 12 56 32.0 | 27 03 21 | 14.81 | 1.37 | 18.87 | 6143 | 8 | 122 | 5 | 28.6 |
| 5259 | 82181 | dS0 | 12 56 47.1 | 27 03 25 | 17.57 | 1.22 | 22.18 | 6490 | 8 | 21 | 5 | 6.6 |
| 5097 | 87820 | dE | 12 57 05.8 | 27 05 21 | 18.23 | 1.50 | 22.44 | 7478 | 5 | 12 | 4 | 7.4 |
| 5032 | 92047 | S0 | 12 57 12.0 | 27 06 13 | 16.03 | 1.40 | 20.85 | 7331 | 4 | 47 | 3 | 17.7 |
| 4135 | 103965 | SBc | 12 58 37.3 | 27 10 35 | 14.82 | 1.06 | 19.84 | 7654 | 9 | 42 | 3 | 33.3 |
| 5365 | 115034 | S0/a | 12 56 34.6 | 27 13 40 | 15.28 | 1.25 | 20.79 | 7188 | 4 | 44 | 3 | 20.0 |
| 4591 | 113838 | E | 12 57 55.4 | 27 13 55 | 17.28 | 1.37 | 21.27 | 6469 | 4 | 21 | 4 | 12.0 |
| 5422 | 130251 | Sc/SBc | 12 56 28.6 | 27 17 29 | 14.67 | 1.15 | 21.28 | 7522 | 4 | 37 | 3 | 22.3 |
| 4351 | 131621 | S0pec | 12 58 18.7 | 27 18 38 | 15.77 | 1.18 | 20.36 | 7410 | 17 | 54 | 3 | 21.6 |
| 4565 | 138413 | dE | 12 57 58.0 | 27 21 03 | 18.02 | 1.46 | 21.00 | 8672 | 5 | 33 | 4 | 11.5 |
| 5364 | 144552 | SB0 | 12 58 33.1 | 27 21 52 | 14.82 | 1.55 | 20.31 | 7009 | 5 | 84 | 4 | 21.6 |
| 5136 | 143923 | SB0 | 12 57 01.7 | 27 22 20 | 15.18 | 1.52 | 20.03 | 7004 | 5 | 95 | 4 | 22.9 |
| 4375 | 145796 | E | 12 57 56.5 | 27 22 56 | 16.54 | 1.48 | 21.13 | 5221 | 3 | 27 | 4 | 14.7 |
| 4215 | 149036 | dS0 | 12 58 31.7 | 27 23 42 | 17.48 | 1.29 | 21.98 | 7571 | 5 | 7 | 4 | 9.9 |
| 4479 | 153508 | E/S0 | 12 58 06.1 | 27 25 08 | 16.00 | 1.43 | 20.75 | 5774 | 3 | 45 | 3 | 18.1 |
| 5250 | 154595 | S0 | 12 56 47.8 | 27 25 16 | 15.64 | 1.40 | 20.12 | 7777 | 3 | 46 | 3 | 23.2 |
| 4430 | 156329 | E/S0 | 12 58 20.5 | 27 25 46 | 16.61 | 1.319 | 20.69 | 7540 | 3 | 38 | 3 | 22.3 |
| 5526 | 161876 | E/SB0 | 12 56 16.7 | 27 26 45 | 14.89 | 1.71 | 19.76 | 6404 | 8 | 112 | 5 | 25.1 |
| 5296 | 159473 | S0 | 12 56 40.9 | 27 26 52 | 17.32 | 1.50 | 20.69 | 7338 | 3 | 43 | 3 | 17.2 |
| 4381 | 162274 | dE/S0 | 12 58 15.3 | 27 27 53 | 17.62 | 1.52 | 21.17 | 7650 | 6 | 22 | 4 | 7.9 |
| 4956 | 164198 | E | 12 57 21.7 | 27 28 30 | 16.98 | 1.69 | 20.13 | 6942 | 4 | 50 | 3 | 15.9 |
| 4597 | 169748 | SBc | 12 57 54.4 | 27 29 26 | 15.02 | 1.36 | 21.09 | 4986 | 4 | 65 | 3 | 24.5 |
| 4522 | 167048 | E | 12 57 50.8 | 27 29 27 | 17.31 | 1.47 | 20.10 | 7341 | 4 | 55 | 3 | 16.4 |
| 5102 | 180920 | S0 | 12 57 04.3 | 27 31 34 | 15.97 | 1.47 | 20.62 | 8341 | 3 | 42 | 3 | 18.3 |
| 4852 | 176486 | E | 12 57 30.6 | 27 32 35 | 16.61 | 1.60 | 19.95 | 7653 | 4 | 64 | 3 | 21.5 |
| 4117 | 180017 | E | 12 58 38.4 | 27 32 39 | 15.15 | 1.54 | 19.19 | 5986 | 7 | 108 | 5 | 26.1 |
| 5284 | 181166 | S0 | 12 56 42.4 | 27 32 54 | 16.54 | 1.47 | 20.41 | 7571 | 3 | 51 | 3 | 20.9 |
| 3760 | 2623 | dE | 12 59 6.38 | 27 33 39 | 17.86 | 1.48 | 22.43 | 7767 | 6 | 16 | 5 | 6.0 |
| 3271 | 5443 | S0/a | 12 59 39.8 | 27 34 36 | 15.51 | 1.02 | 20.42 | 4997 | 5 | 26 | 3 | 32.1 |
| 3585 | 6728 | S0 | 12 59 18.5 | 27 35 37 | 16.77 | 1.16 | 21.65 | 5216 | 5 | 21 | 4 | 19.9 |
| 3598 | 13606 | dE | 12 59 17.1 | 27 38 03 | 17.99 | 1.51 | 21.72 | 5282 | 5 | 38 | 4 | 9.8 |
| 2801 | 23231 | dS0 | 13 00 17.4 | 27 42 41 | 17.89 | 1.57 | 21.54 | 7108 | 5 | 22 | 4 | 9.1 |
| 3586 | 23987 | E | 12 59 18.3 | 27 42 56 | 16.68 | 1.58 | 20.36 | 6679 | 3 | 46 | 3 | 20.7 |
| 3176 | 28211 | S0 | 12 59 46.3 | 27 44 46 | 17.26 | 1.09 | 21.52 | 9718 | 7 | 42 | 4 | 14.6 |
| 4035 | 29543 | E | 12 58 45.5 | 27 45 14 | 16.97 | 1.50 | 21.77 | 6646 | 4 | 26 | 4 | 12.0 |
| 4150 | 31541 | dE | 12 58 35.4 | 27 46 30 | 18.60 | 1.41 | 22.06 | 5956 | 6 | 17 | 5 | 6.0 |
| 2478 | 39218 | E/S0 | 13 00 45.4 | 27 50 08 | 16.53 | 1.59 | 20.76 | 8800 | 3 | 41 | 3 | 20.4 |
| 4175 | 39682 | E/S0 | 12 58 33.8 | 27 50 12 | 17.08 | 1.36 | 21.02 | 4486 | 5 | 35 | 5 | 8.9 |
| 2753 | 41046 | E/S0 | 13 00 20.2 | 27 50 36 | 16.53 | 1.60 | 20.92 | 7856 | 3 | 37 | 3 | 16.9 |
| 3473 | 42068 | dE | 12 59 26.4 | 27 51 25 | 17.68 | 1.54 | 21.36 | 4967 | 5 | 33 | 4 | 10.1 |
| 3645 | 46757 | E | 12 59 14.6 | 27 53 44 | 17.30 | 1.59 | 20.26 | 6409 | 6 | 57 | 5 | 11.7 |
| 2736 | 47098 | E | 13 00 21.6 | 27 53 55 | 16.74 | 1.49 | 20.79 | 4896 | 3 | 35 | 3 | 17.5 |
| 2376 | 47923 | S0 | 13 00 55.9 | 27 53 55 | 16.69 | 1.60 | 21.89 | 6010 | 4 | 31 | 4 | 11.1 |
| 3080 | 49731 | dE | 12 59 55.7 | 27 55 03 | 18.07 | 1.72 | 21.75 | 6668 | 3 | 16 | 4 | 8.6 |
| 3511 | 50139 | cE | 12 59 23.4 | 27 55 10 | 17.27 | 1.66 | 19.56 | 6923 | 6 | 95 | 4 | 23.9 |
| 3376 | 50554 | dE | 12 59 32.0 | 27 55 15 | 17.66 | 1.49 | 22.01 | 7079 | 4 | 28 | 4 | 12.3 |
| 2692 | 52689 | S0/a | 13 00 24.8 | 27 55 36 | 16.78 | 1.62 | 21.39 | 7972 | 3 | 44 | 3 | 17.1 |
| 3565 | 57356 | E/S0 | 12 59 19.7 | 27 58 24 | 17.04 | 1.53 | 21.49 | 7247 | 4 | 32 | 4 | 13.9 |
| 3602 | 58030 | dE | 12 59 16.7 | 27 58 57 | 19.02 | 1.58 | 21.71 | 6878 | 5 | 13 | 4 | 6.9 |
| 3018 | 59516 | dE | 13 00 01.0 | 27 59 30 | 18.08 | 1.62 | 21.86 | 7549 | 6 | 20 | 4 | 7.4 |
| 3166 | 59610 | E | 12 59 46.9 | 27 59 31 | 17.36 | 1.46 | 21.58 | 8410 | 4 | 35 | 4 | 12.4 |
| 3292 | 60593 | S0/a | 12 59 38.0 | 28 00 03 | 16.62 | 1.51 | 20.96 | 4980 | 3 | 43 | 3 | 18.4 |
| 3969 | 61500 | E | 12 58 50.8 | 28 00 25 | 17.36 | 1.55 | 21.30 | 7460 | 3 | 21 | 4 | 14.7 |
| 3681 | 62166 | E | 12 59 11.5 | 28 00 33 | 16.70 | 1.50 | 20.72 | 6895 | 3 | 48 | 3 | 20.3 |
| 4042 | 63244 | SB0 | 12 58 48.1 | 28 01 07 | 17.03 | 1.64 | 21.91 | 7116 | 5 | 25 | 5 | 7.6 |
| 2879 | 68886 | E | 13 00 11.1 | 28 03 55 | 16.67 | 1.52 | 20.90 | 7350 | 4 | 46 | 3 | 20.4 |
| 3387 | 72587 | E | 12 59 31.6 | 28 06 02 | 17.29 | 1.42 | 21.92 | 7427 | 4 | 33 | 4 | 12.3 |
| 2976 | 79519 | S0 | 13 00 04.2 | 28 09 18 | 16.63 | 1.49 | 20.81 | 6586 | 3 | 40 | 3 | 17.4 |
| 3699 | 81862 | S0/Sp | 12 59 09.9 | 28 09 52 | 17.36 | 1.35 | 21.57 | 8612 | 5 | 28 | 4 | 12.3 |
| 3204 | 82303 | E | 12 59 44.1 | 28 10 35 | 16.98 | 1.54 | 20.58 | 8316 | 3 | 42 | 3 | 18.1 |
| 4122 | 86791 | dE | 12 58 37.4 | 28 13 10 | 17.61 | 1.55 | 21.68 | 6784 | 5 | 31 | 5 | 9.2 |
| 3640 | 90411 | E/S0 | 12 59 15.0 | 28 15 03 | 16.60 | 1.00 | 21.47 | 7428 | 4 | 23 | 3 | 21.2 |
| 3902 | 104960 | dE | 12 58 55.8 | 28 21 14 | 18.09 | 1.63 | 22.16 | 6355 | 6 | 15 | 5 | 6.7 |