MCTP-09-12
Pulsars as a Source of the WMAP Haze
Manoj Kaplinghata, Daniel J. Phalenb,
and Kathryn M. Zurekb,c
a Center for Cosmology, Department of Physics and Astronomy
University of California, Irvine, CA, USA
b Department of Physics, University of Michigan
Ann Arbor, Michigan 48109, USA
c Particle Astrophysics Center, Fermi National Accelerator Laboratory
Batavia, Illinois 60510, USA
The WMAP haze is an excess in the 22 to 93 GHz frequency bands of WMAP extending about 10 degrees from the galactic center. We show that synchrotron emission from electron-positron pairs injected into the interstellar medium by the galactic population of pulsars with energies in the 1 to 100 GeV range can explain the frequency spectrum of the WMAP haze and the drop in the average haze power with latitude. The same spectrum of high energy electron-positron pairs from pulsars, which gives rise to the haze, may also generate the observed excesses in AMS, HEAT and PAMELA. We discuss the spatial morphology of the pulsar synchrotron signal and its deviation from spherical symmetry, which may provide an avenue to determine the pulsar contribution to the haze.
1 Introduction
The measurements of the temperature anisotropies in the Cosmic Microwave Background (CMB) by the Wilkinson Microwave Anisotropy Probe (WMAP) have made possible an impressively precise extraction of cosmological parameters. WMAP has also been able to measure Interstellar Medium (ISM) emission of low energy photons from dust and ionized gas in the inner regions of the galaxy. However, an excess of synchrotron radiation in the WMAP bands between 22 and 93 GHz has been observed, after a subtraction of the free-free, dust and standard synchrotron emission [1, 2]. This excess has been dubbed the WMAP “haze.”
One possible explanation of the excess is in terms of annihilating dark matter [3]. The charged byproducts of the dark matter annihilations radiate synchrotron photons in the galactic magnetic field. A neutralino from supersymmetric theories annihilating to gives a good fit to the radial distribution of the spectrum for a dark matter halo profile scaling with a radial dependence which is slightly steeper than NFW [4] and a magnetic field in the few G range. The cross-section of annihilating dark matter needed to produce the haze is consistent with what one would predict from the thermal freeze-out of the WIMP, namely . We urge caution, however, because recent work [5] has claimed that the significance of the WMAP haze may depend on the assumptions about the spatial variation of the synchrotron spectral index.
This signal may be even more interesting in light of the recent observations of an excess of high energy cosmic ray positrons and electrons. The excess was originally observed by the HEAT [6] and AMS [7] experiments, and was confirmed more recently by the PAMELA [8] and PPB-BETs [9] experiments. The Fermi Large Area Telescope also observes excess cosmic ray electrons and positrons over the predicted background [10], though their excess is not nearly as large as that observed by ATIC [11] (and seems to indicate that the ATIC excess is instrumental in origin). The source of these positrons is unknown, however, there are several possibilities. Like the WMAP haze, they may be explained by annihilating DM (see e.g. [12, 13]). An explanation of the signal in terms of annihilating dark matter (DM), however, has multiple obstacles to overcome. First, it must annihilate with a cross-section significantly larger than that suggested by the thermal abundance, . Second, the DM candidate prefers leptophilic annihilation to avoid overproducing anti-protons [12, 14] and to produce a steep enough spectrum [13]. Gamma rays and radio measurements also generate significant constraints [12, 15], since the charged SM byproducts of the annihilation may emit either hard final state radiation or synchrotron emission in the galactic magnetic field. In short, if the positron excesses are to be explained in terms of annihilating Weakly Interacting Massive Particle, the WIMP must have non-standard properties. There are possible exceptions to these conclusions in the case that we happen to be nearby a dense clump of dark matter [16], or for non-standard propagation models [17].
The cosmic ray positron excess may be purely astrophysical, however. There are several possible astrophysical explanations. The excess may result from secondary production and acceleration in the cosmic ray source itself [18]. Supernova remnants may also produce highly energetic positrons to explain the PAMELA signal [19]. It has been noted many times that a single or few pulsars in the neighborhood of a kiloparsec from us, or a distribution of pulsars, may contribute with an energy spectrum that can reproduce the steep rise over the background seen in PAMELA [20, 21, 22, 23, 24, 25, 26].
In this paper we explore the possibility that the WMAP haze may also be generated by pair production in pulsars. Pulsars produce a significant flux of energetic electrons and positrons spread over the disk of the galaxy, which then emit synchrotron radiation as they traverse outward from the disk in the magnetic field of the galaxy. To explain the haze, the expected signal from pulsars must both reproduce angular dependence of the signal from the galactic center, as well as the frequency dependence through the WMAP bands from 22 to 93 GHz. We show that an energy spectrum which is typical of that necessary for explaining the PAMELA data with pulsars also naturally produces the average variation of WMAP haze with latitude given typical galactic magnetic fields and diffusion parameters. We also discuss reproducing the detailed morphology of the WMAP haze.
In the next section we describe the model for the electron distribution from mature galactic pulsars, and in the following section their propagation through the ISM and the haze calculation.
2 Injection spectrum of positrons from pulsars
The mechanism by which pulsars produce electrons and positrons and details about their energy distribution are not very well understood. However, the theoretical models reproduce important characteristics like the observed distribution of spins, ages, and photon fluxes from radio to gamma-rays (e.g., [27]). Here, we wish to demonstrate that with a plausible model for pulsar injection spectra (that is consistent with observations), one can reproduce the WMAP haze. We begin by reviewing the model we utilize for the pulsar injection spectrum.
We consider only pulsars older than years as potential sources of the pairs that create the haze. This is based on the expectation that young pulsars are surrounded by a nebula created by the kinetic energy released from the supernova explosion (almost ergs) so that cannot escape from this nebula until the pulsar is sufficiently old. The nebulae have typical sizes in the parsec range, and since a typical pulsar kick at birth is around km/s, it would take the pulsar thousands of years to escape the nebula. In addition, the nebulae themselves thin out in tens of thousands of years. For the mature pulsars, we will assume that the nebulae surrounding pulsars do not play a dominant role in shaping the energy spectrum and we neglect the contributions from pairs diffusing out of younger pulsar nebulae. The younger pulsars are fewer in number and could contribute significantly to the higher energy end of the spectrum. However, the bulk of the synchrotron radiation in the WMAP bands comes from with energies much less than 100 GeV, which justifies our focus on mature pulsars.
To demonstrate the feasibility of our assertion that pulsars could explain most of the visible WMAP haze, we follow the Cheng and Zhang 2001 model (CZ01 from here on) [22], which relies on the production of highly energetic radiation in the outer magnetosphere gap of a rapidly spinning pulsar [28, 29, 30]. In the CZ01 model, the mean energy of injected into the inter-stellar medium is set by its period, , which increases with time. For a rotating magnetic dipole (in vacuum) this spin-down is given by
| (2.1) | |||||
| (2.2) |
where is time since birth of the pulsar, is the initial period, is the mass of the pulsar, its radius and is the surface magnetic field. The energy injected into the pairs all comes from the spin-down and the surface magnetic field is assumed to be constant. In the CZ01 model,
| (2.3) |
where is the period of the pulsar at the time of emission and one of the parameters of the CZ01 model, the fraction of pairs escaping from the light cylinder, is set to 0.01.
The CZ01 model converts a fraction of the available spin-down power for pulsar ages to pairs. To set the scale we note that in this model, for and , the differential emission rate is , with mean energy . Only the gamma-ray pulsars are assumed to produce pairs in this model and this introduces a dependent upper-limit on the period ().
To predict the properties of the pulsar today, we need the initial period and magnetic field, and also the initial kick that the nascent neutron star received when the supernova occurred. The CZ01 study includes a Monte Carlo of these and other parameters that result in present day distributions that are broadly consistent with observations. We note that in the CZ01 model the spatial distribution of the injected will depend somewhat on the energy range of interest if pulsars older than about million years contribute significantly to that energy range. To test this, we repeat the modeling of CZ01, including a description of motion of pulsars in the galactic potential, and compute the final spatial and energy distribution of positrons. Our result for the energy distribution of the positrons agrees with CZ01. In addition, we find that the mean age of the pulsars, weighted by the positron ejection rate, is of order years for the energy range of interest. Given the birth velocities, these ages imply that typical pulsars (contributing significantly to the positron flux) have only traveled parsecs from their birth place. We thus use the simple approximation that the spatial distribution of these pulsars is the same as the initial pulsar distribution, which in turn tracks that of the young stars in the stellar disk. Specifically, we adopt [31, 32]
| (2.4) | |||||
where , and .
The distribution of pulsars close to the center is not well constrained – consequently the value of that we use should be taken as a very rough estimate. We have chosen this value based on the dynamical models of the thin disk, which assign values for in the range of 2 to 4 kpc. We have adopted 4 kpc for our fiducial model and later explore the effect on the morphology of making smaller. In detail, we expect the pulsar distribution to track the galactic star formation rate in the disk (rather than the thin disk density), but the observational constraints on the star formation in the disk [34] in the inner couple of kpc are weak. One may consider using the observed distribution of pulsars to reconstruct the true pulsar distribution in the galaxy after correcting for incompleteness. The distances to these pulsars are estimated through the dispersion measure, and this depends sensitively on the assumed distribution of electrons. The uncertainties inherent in this procedure makes it hard to pin down the distribution of pulsars in the inner galactic region [33]. We note that most of the pulsars in the distribution assumed in Eq. 2.4 are at . This is consistent with one of the two models advocated to explain the observed pulsar distribution in the Parkes multibeam pulsar survey [33]. We do not consider a secondary source of pairs from the pulsars in the bulge given that the bulge is thought to be old and have a low star formation rate (compared to the disk).
The CZ01 Monte Carlo predicts that the energy spectrum of the pairs should be above about a GeV up to tens of GeV. The spectrum drops sharply above GeV. Both these features (the slope and cut-off energy) are model dependent and we discuss the effect of changing these later on. To keep the discussion more general, we therefore adopt an energy spectrum (number of pairs per unit time per unit energy) given by
| (2.5) |
where our baseline model has and GeV, and we allow it to vary later to see how it changes our results. We have separated out a factor , which is the efficiency of converting the spin-down power of the pulsar into pairs (after an age of ), and the factor , which is the number of pulsars created every century.
The normalization is fixed by the spin down power of all the pulsars, that is where is the total number of pulsars and the brackets indicate averaging over the galactic population. We set , where is the typical age of the pulsar contributing the pairs. The normalization condition for is given by
| (2.6) | |||||
| (2.7) |
where is the electron or positron energy in GeV, and we have assumed median values for the pulsar mass of , radius of 15 km, initial period of 20 ms, and surface magnetic field of . For these values, Eq. 2.2 shows that and therefore for these mature pulsars. This simple estimate for agrees with the Monte Carlo results of CZ01, who find , if we assume , , .
It is important to note that is the fraction of spin down power that is injected into pairs after the assumed maturity age of . This efficiency is expected to be large since are the lightest electromagnetically coupled fermions. The fraction of total initial energy injected into the ISM in pairs is very small, . This argument shows that if a significant amount of the spin-down energy released before the assumed maturity age of were to be available in the form of pairs injected into the ISM, then the required efficiency would be very small. We see this by noting that in the approximation that some fraction of all of the spin-down energy is injected into the ISM instantaneously in the form of with spectrum and cut-off 100 GeV, we have , which works out to GeV-1 s-1 if we take (conservatively) . The efficiency required then to get the same normalization as the CZ01 model is a factor of 4 less.
The origin of the spectrum in the CZ01 model are the scalings of and the spin down power with period . We note that where we have used the fact that the number of pulsars is proportional to the age and we have used the approximation . We include the dependence on to obtain , somewhat different from the scaling because of the approximations we have made.
The cut-off in the spectrum around 100 GeV is related to our assumption that the pulsars have to be approximately 100 kyr or older to contribute significantly to the haze, and that the mean energy of pairs injected into the ISM depends on the pulsar period in the CZ01 model (see Eq. 2.3). This estimate of the cut-off is uncertain both because of our blanket assumption that pulsars younger than 100 kyr do not contribute pairs, and also because in framing the arguments above we have assumed all pulsars are born with spin period of 30 ms. We certainly expect scatter about both these parameters. Including such scatter will change the details of the cut-off significantly but not the main result of the paper. In addition, a small change in the strong dependence of the mean energy on the period would affect the cut-off significantly. This steep dependence arises from processes that accelerate the pairs into the ISM and these processes are not well-understood. We note that the energy spectrum at lower energies () is much less sensitive to the above uncertainties.
At even lower energies, GeV, pair emission luminosity is influenced by the modeling of a gamma-ray pulsar. This requirement, discussed above, imposes a magnetic field dependent upper limit on the period, which translates to a cut-off in the luminosity at low energies. These model assumptions therefore introduce uncertainties in the GeV range pair emission luminosity, which must be kept in mind when comparing to experiments like HEAT.
The estimates in this section assuming a vacuum dipole rotator model for the mature pulsars have provided us with the basic features of the positron injection spectrum. We find that the spatial distribution should track that of the young stars in the disk, with an energy spectrum that is less steep than – specifically for the model of CZ01 – and a total normalization that requires about of the spin-down power of pulsars to be injected into positrons.
3 Pulsars as a Source for the Haze
The positrons pumped into the ISM will lose energy and diffuse outwards, and as they do so, they will produce the synchrotron background. To model this we use the standard diffusion equation that describes the propagation and energy loss for a charged particle:
| (3.1) |
where is the source function, i.e., rate of production of positrons per unit energy with energy at time and location . It is a sum over all the pulsars in the galaxy. We have assumed that the diffusion coefficient is spatially constant, as there is no evidence in the cosmic ray or diffuse galactic gamma-ray data to the contrary. In addition, we note that very little is known about the diffusion constant at the center of the galaxy. We will discuss the effect of changing the diffusion constant on the morphology of the haze later.
The synchrotron emission from the positrons along the line of sight receives contributions from a large number of pulsars. Since pulsars are being created on time scales of 100 years in the galaxy and this is much shorter than the diffusion time scale and the assumed yr time lag, we expect a steady state calculation to work well. In the limit that the diffusion equation can be solved in a steady state, the source function reduces to
| (3.2) |
with given by Eq. 2.5 and given by Eq. 2.4. This gives us explicitly
for our fiducial , and values.
We use GALPROP [35, 36] to compute the diffusion, and check the results with an ordinary partial differential equation solver. The diffusion coefficient is
| (3.4) |
where we take cm2/s and the index as our fiducial model parameters. We use the diffusive reacceleration scheme in Galprop with Alfvén speed of 36 km/s. These diffusion coefficient values are consistent with those used in the literature to fit cosmic ray data [37]. The energy loss coefficient is calculated in GALPROP. It is dominated by inverse Compton scattering and synchrotron radiation for electrons and positrons in the energy range of interest. The energy loss due to inverse Compton scattering is calculated using the Klein-Nishina cross section with an interstellar radiation field that comes with the GALPROP package, discussed in [38, 39].
Energy loss due to synchrotron radiation is calculated using an exponential form of the galactic magnetic field,
| (3.5) |
where , is the magnetic field at the center of the galaxy and is the local magnetic field. We choose a characteristic scale kpc and kpc to be consistent with earlier studies aiming to explain the Haslam data and cosmic ray data [39, 40]. The value and the function encode our ignorance about the magnetic field at the center of the galaxy. Neither the detailed structure nor the value of the magnetic field in the inner galactic region is well known [41]. We choose as our fiducial value although smaller and larger values also lead to consistent fits to the haze spectrum and its variation with latitude. Since there is no observational guidance on the specific structure of magnetic field within a couple of kpc from the galactic center, we adopt an exponential form, and set kpc. We note that this form for achieves the aim of smoothly transitioning from a spherical magnetic field profile in the inner galactic region to the cylindrical B field profile that are commonly used to fit Haslam data, cosmic ray data and diffuse galactic gamma-ray background [39]. Our adopted magnetic field towards the center of the galaxy is consistent with the average magnetic field deduced on scales of order a kpc about the galactic center from observations of non-thermal radio filaments [42].
We also note that the 408 MHz Haslam maps do not directly constrain the inner galactic magnetic field strengths or structure since the synchrotron signal depends on [40], where is the number density of electrons contributing to the 408 MHz signal and is the component of the magnetic field perpendicular to the line-of-sight. The pulsars do not contribute significantly to the Haslam map. There must be a different source of with energies at or below GeV that contribute dominantly to the Haslam map. Thus, for an assumed magnetic field spatial distribution, the Haslam maps determine the spatial distribution of these lower energy electrons. It is clear from the Haslam maps that these lower energy electrons must be distributed more diffusely than the pulsar distribution assumed here. More detailed work on this subject would require a computation of the secondary positrons along with primary produced by supernova remnants, away from the galactic disk. The secondary positrons, which are sub-dominant at multi-GeV energies in the solar neighborhood, will contribute significantly at and lower energies because of their steeper spectrum [43] and there are large uncertainties in these calculations [44].
Our assumptions about energy losses differ from earlier work exploring constraints with the haze [45]. We do not assume a spatially constant ratio of energy density of starlight to the magnetic field energy density to fit the haze data (as discussed also in Ref. [46]); we parametrize our ignorance of the magnetic field in the center of the galaxy directly. This allows us to make more direct contact with studies aiming to fit cosmic ray and diffuse photon backgrounds.
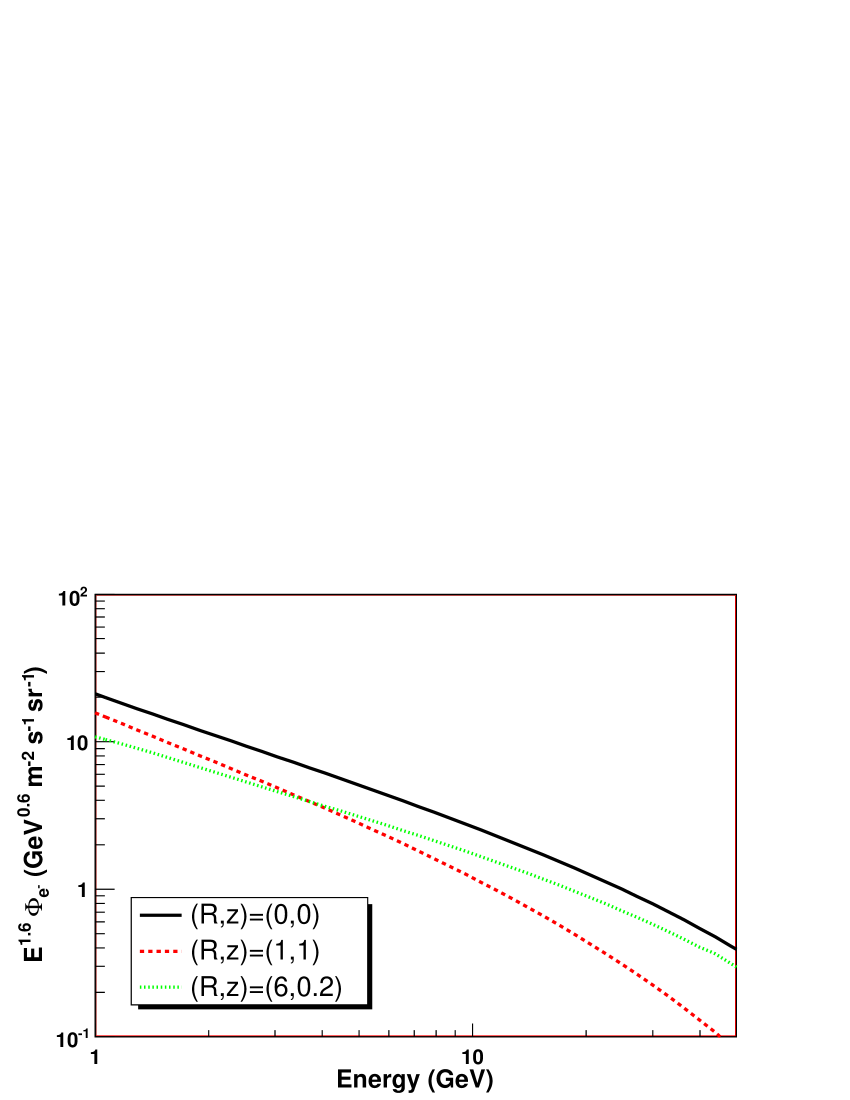
We plot in Fig. 1 the electron flux spectrum at various positions with respect to the galactic center. The diffusion softens the spectrum considerably, implying a larger flux in the lower frequency bands of the WMAP haze. The question is then whether the spectrum remains sufficiently hard to explain the WMAP haze in the all frequency bands, from 22 to 93 GHz. We examine this next.
After propagation, at any given point in space, the flux in synchrotron radiation (in erg/s/Hz) in the presence of the magnetic field is computed according to the relation [47]
| (3.6) |
with , , and the electron’s boost.
The total flux (in kJy/sr) in a given frequency at a given angle from the galactic center is computed by folding the synchrotron power with the electron distribution at any given point. The flux is then obtained by integrating along the line of sight:
| (3.7) |
where and if we restrict out attention to angles above and below the galactic center, the sun is positioned at and , and is set by the height of the diffusion zone. We now turn to presenting our results utilizing the formalism outlined above.
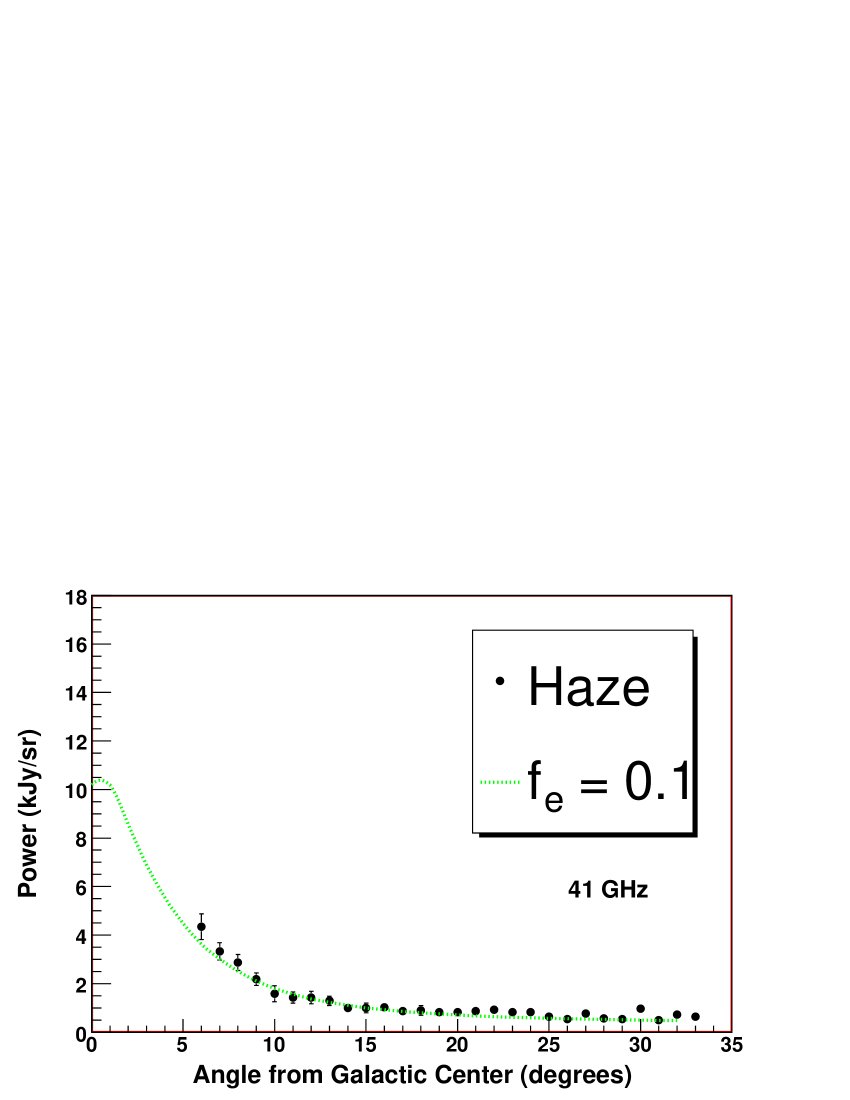
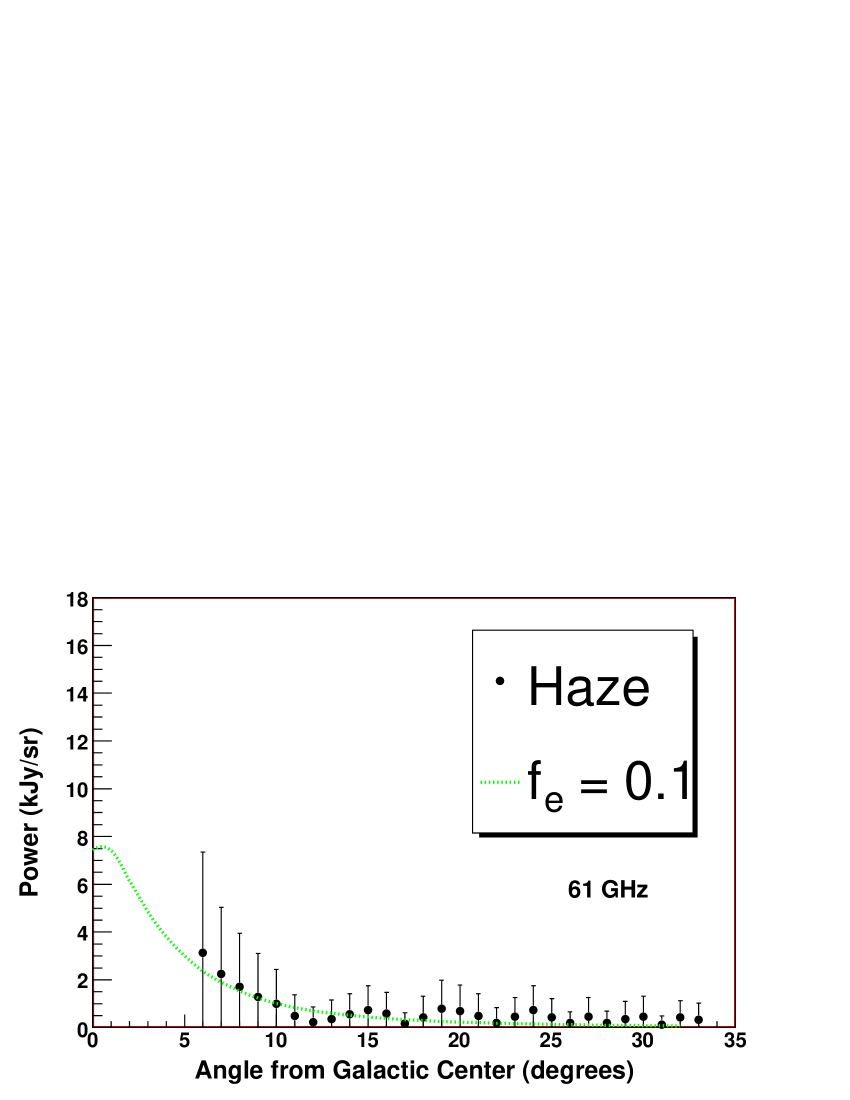
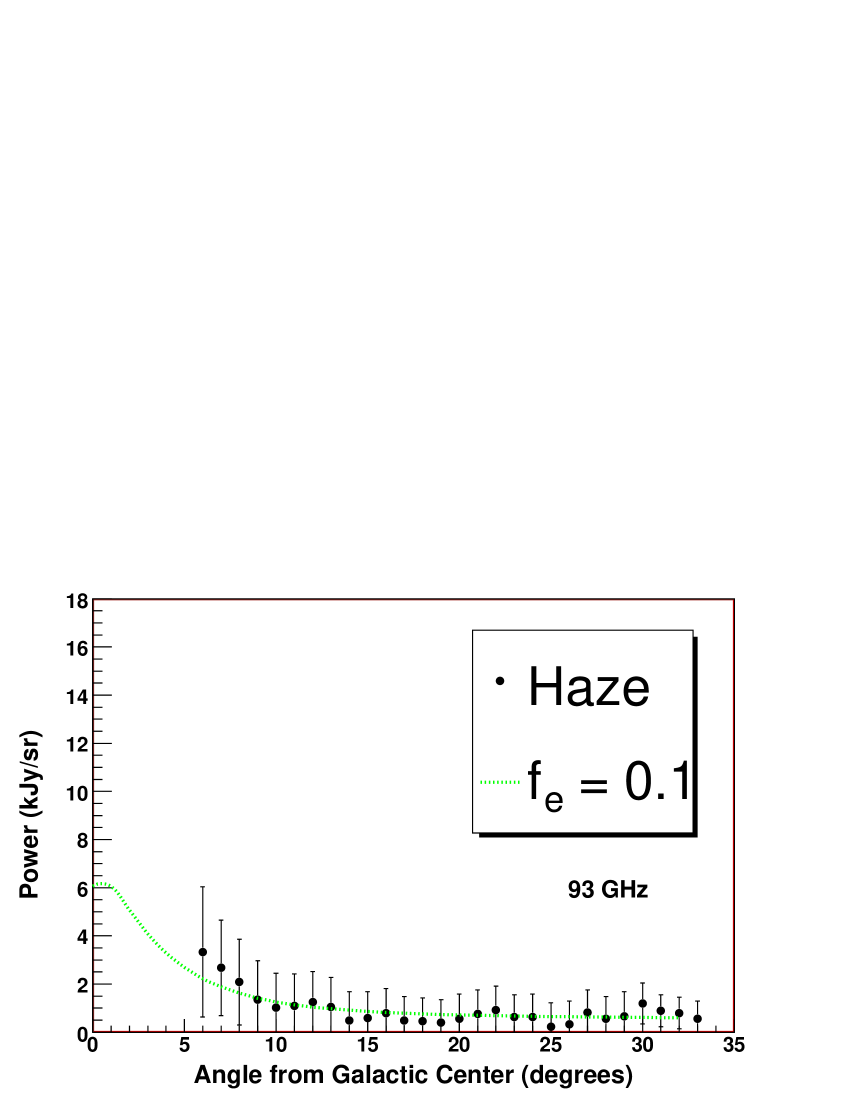
After propagation, we fit the haze using the flux from Eq. 3.7 in the all WMAP bands. The overall normalization of the curve depends on both the magnetic field, in Eq. 3.5, the average pulsar power , and the average pulsar efficiency times pulsar production rate . The range for is 1-3 per century, following the rate of core collapse of supernovae in our galaxy. [48]. We have taken , following [49]. In addition, owing to uncertainties in the subtraction, we also allow a constant background at all angles to be added in the fit.
The index in Eq. 2.5 and are important in fitting the frequency structure of the Haze observed by WMAP. The cutoff energy is required to be above a minimum value GeV such that there will be enough radiation into the 93 GHz band, however cutoff energies larger than that will only serve to increase the required average efficiency per pulsar to reproduce the haze. Additionally, a soft spectrum, corresponding to a large , will not give rise to a large enough amplitude in the high frequency bands to reproduce the haze. Lastly, the fit in the angular direction results by allowing the characteristic distance over which the magnetic field is damped from the galactic center, in Eq. 3.5, to vary.
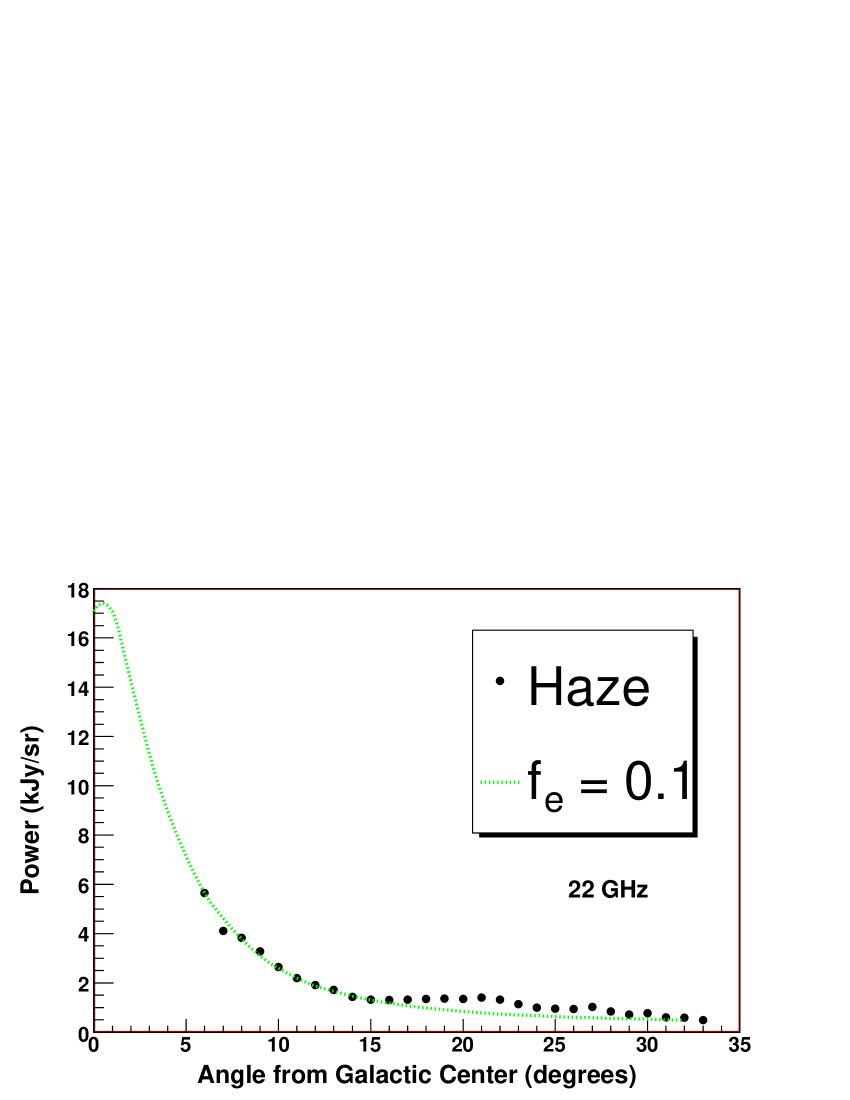
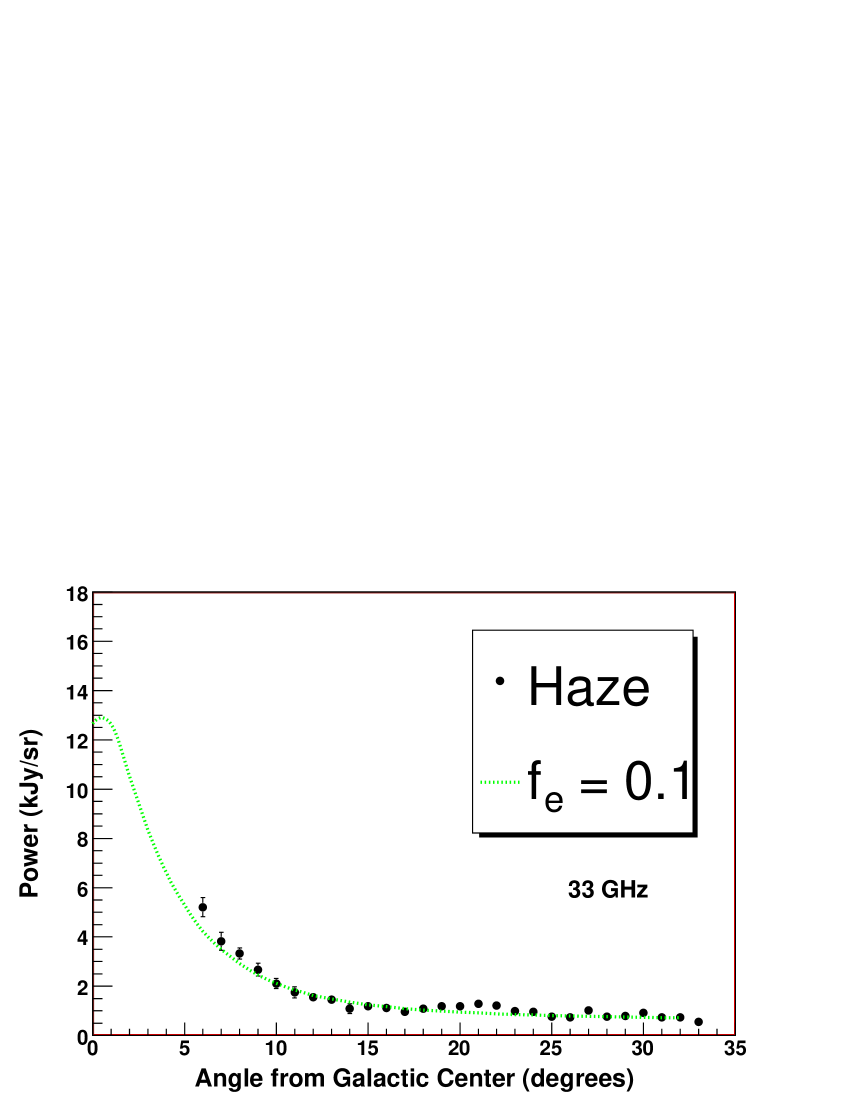
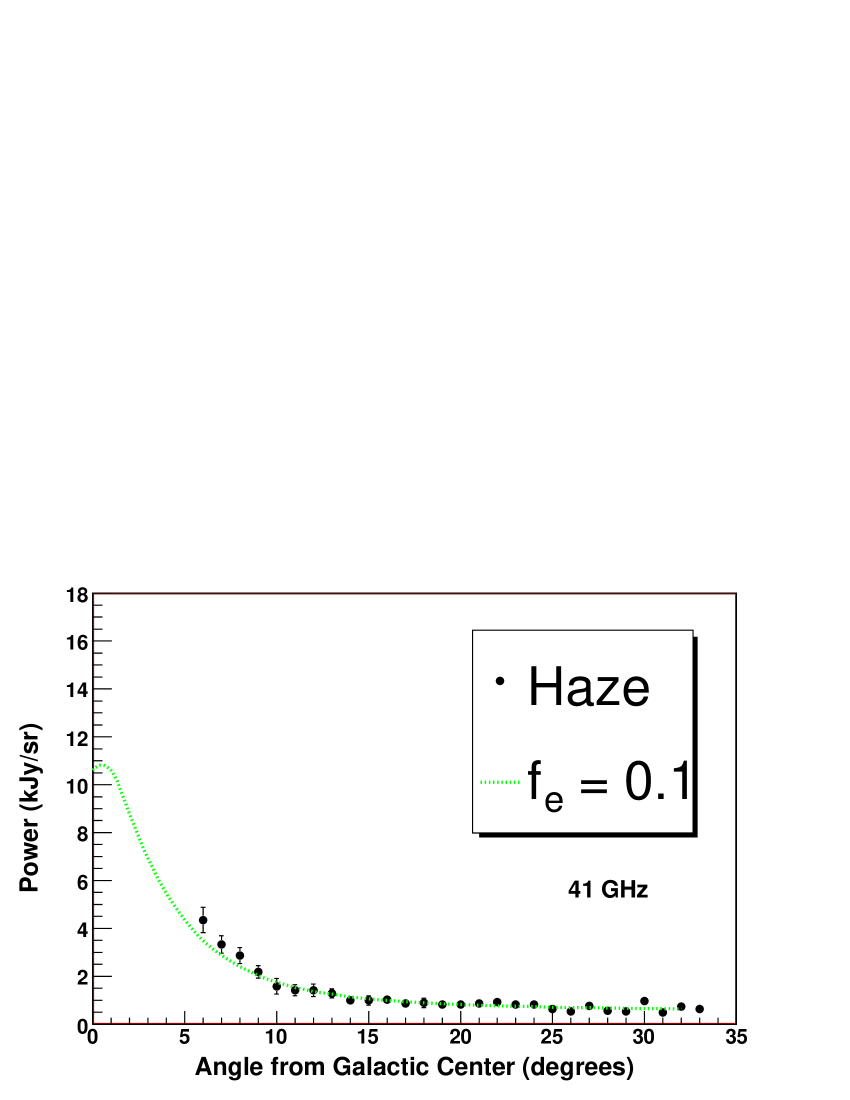
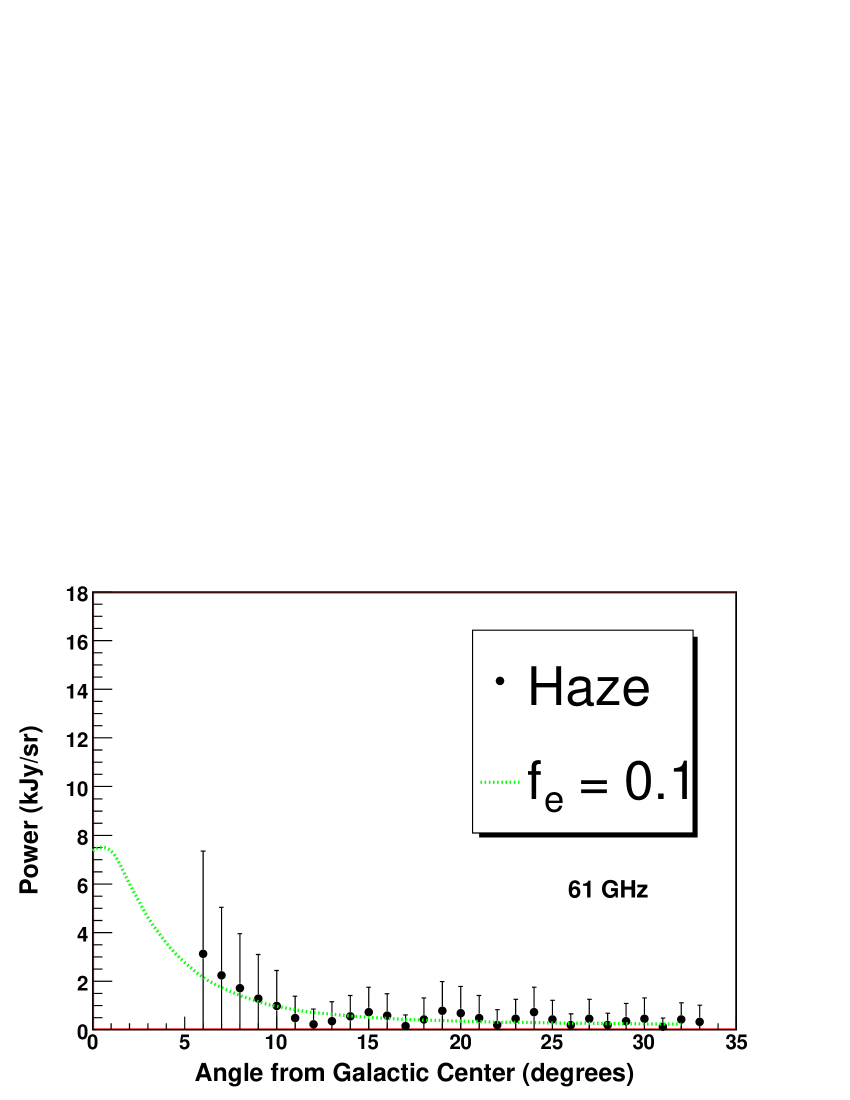
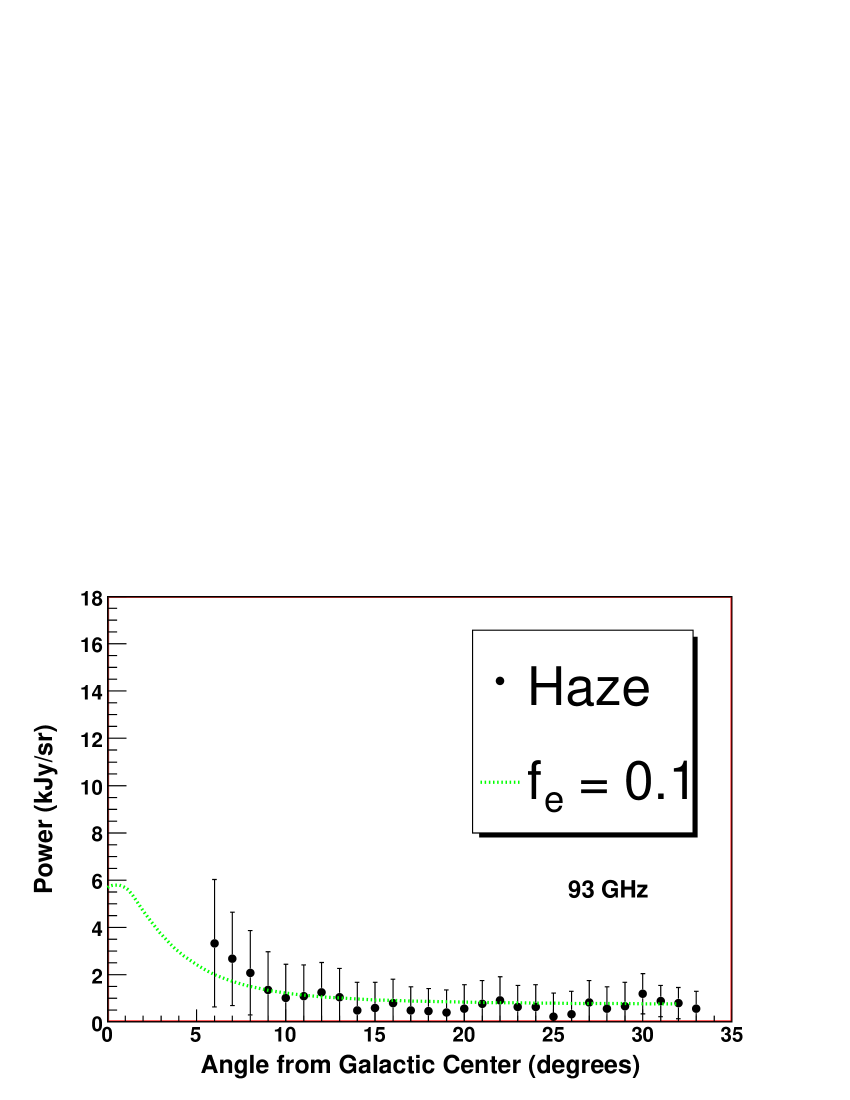
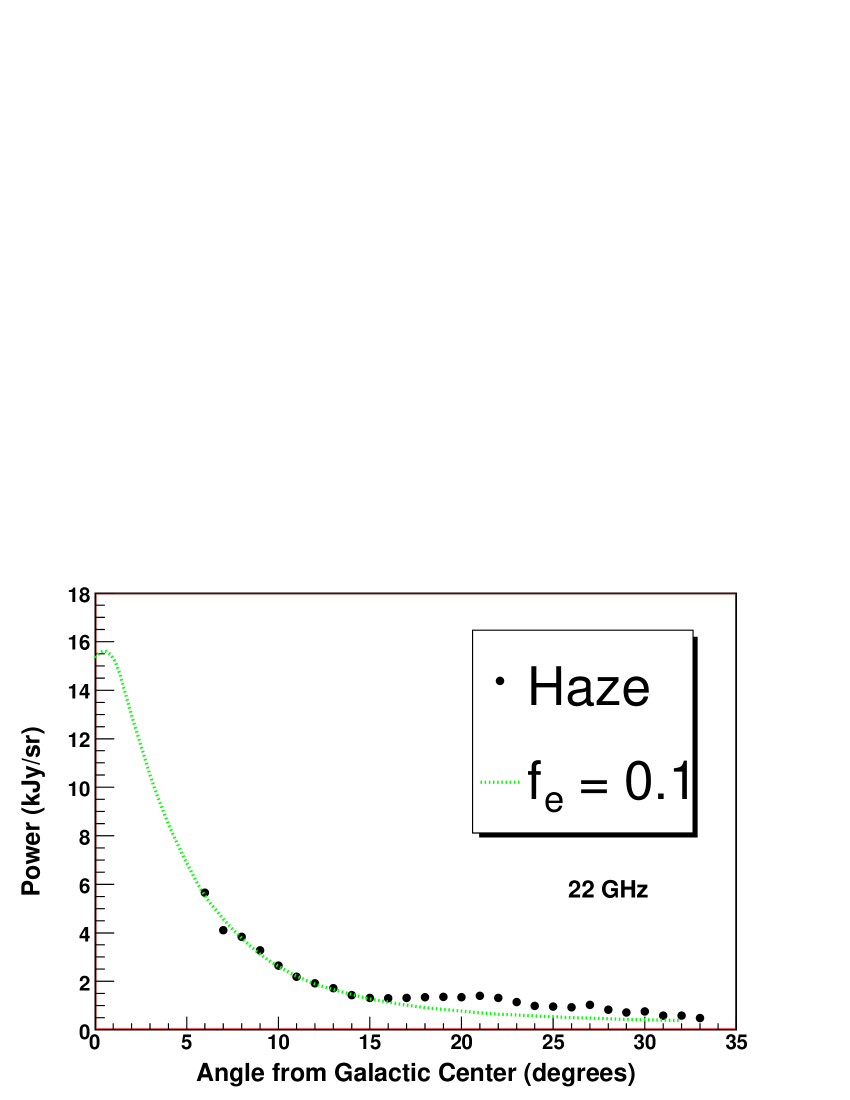
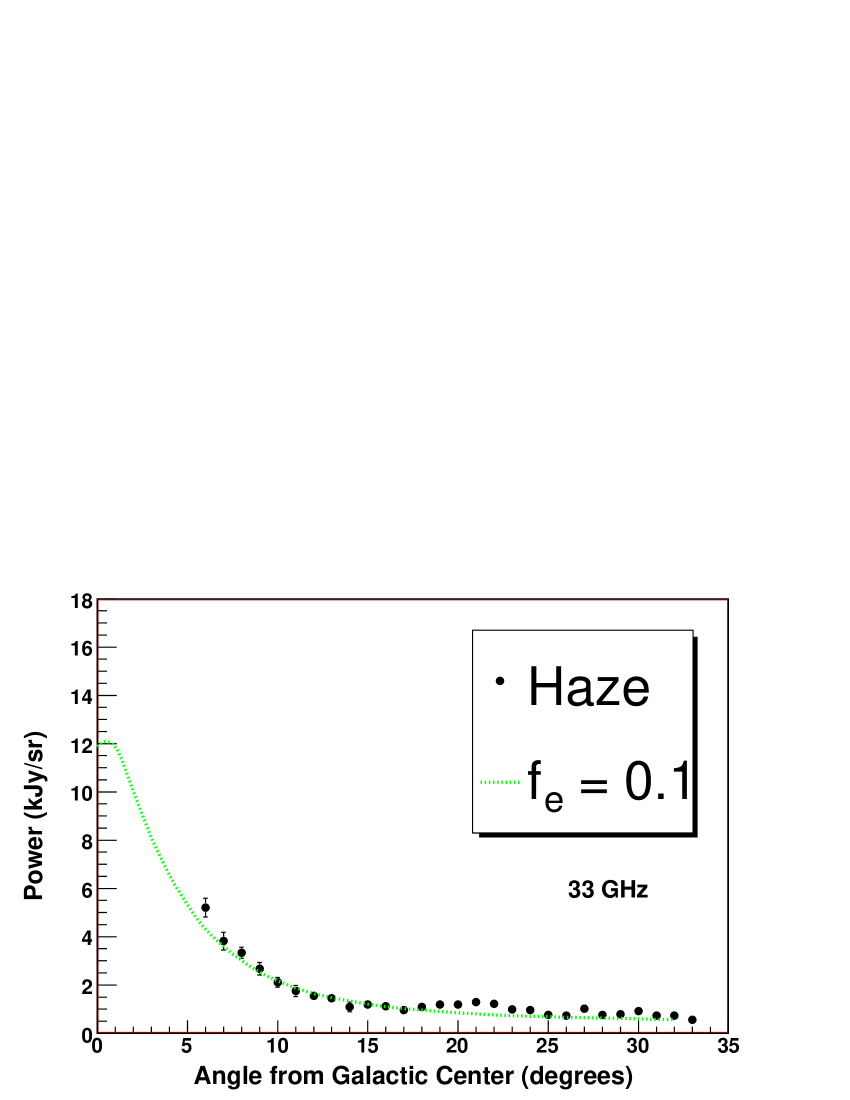
As shown in Fig. 2, we find that with reasonable choices of these parameters, a galactic source of pulsars can explain both the amplitude and frequency dependence of the WMAP haze. The plotted synchrotron fluxes are averages over 20 degrees in longitude for below the galactic plane. We find that kpc gives a good fit to the angular distribution. In detail, the shape of the haze depends on both the distribution of the injected pairs as well as the magnetic field profile. Future Planck data might provide an avenue to constrain these distributions better.
The cutoff energy GeV taken from the CZ01 model [22] also fits the frequency band requirements of the haze very well. We show in Fig. 3 the results for a larger choice of . Since the parameters , , and are interchangeable, to get a reasonable efficiency the most likely course is to raise the average pulsar spin down power. In general, the efficiencies noted there can be substantially and easily lowered by taking the power per pulsar and the magnetic field at the galactic center to higher, but still reasonable, values. In short, pulsars are a plausible explanation of the haze.
We also note that the choices of parameters we have made are consistent with those utilized in [23, 25] as a means to explain the HEAT, AMS, PAMELA, ATIC and PPB-BETs cosmic ray positron excesses with a single pulsar, or collection of local pulsars, suggesting that cosmic ray positron and dark matter anomalies may naturally have the same source.
We urge caution here that using the local measurements, say from HEAT and PAMELA, to normalize the pulsar synchrotron contribution requires many assumptions.
-
•
Normalizing the distribution of the pulsars to the local density of pulsars and then using an analytic form to extrapolate to the center is not well motivated given the uncertainties in the the deduced pulsar distribution closer to the galactic center.
-
•
For local measurements at energies 5 GeV and higher, the dominant contribution to the flux should come from a few local sources and we cannot use a smooth source spatial distribution to describe this (given the large expected variance).
-
•
In the outer gap model for pulsars we use, the energy spectrum around a GeV and lower is very uncertain because of the cut-off, as discussed earlier. This is not a complicating factor for the haze because most of the contribution comes from approximately 5 GeV and higher, but it is an issue that must be addressed if one is normalizing to lower energy data. In addition, the low energy data is also affected by solar modulation.
-
•
In order to link the haze to local measurements, we need a better understanding of how the flux is affected by changes in diffusion between the local and central parts of the galaxy.
3.1 Morphology
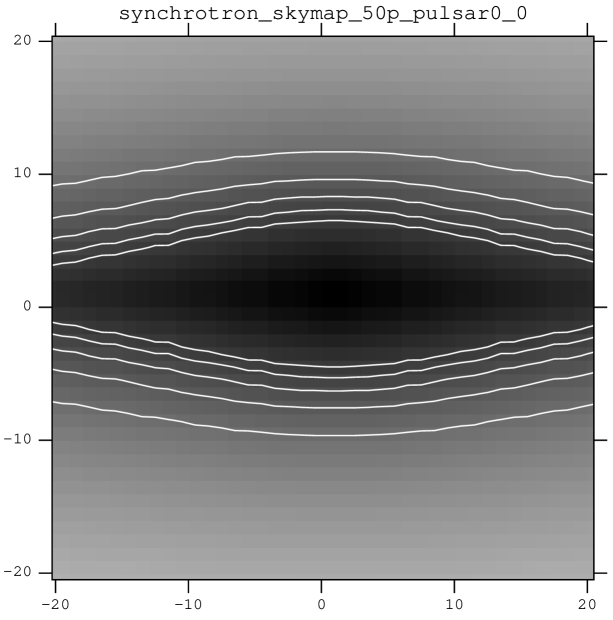
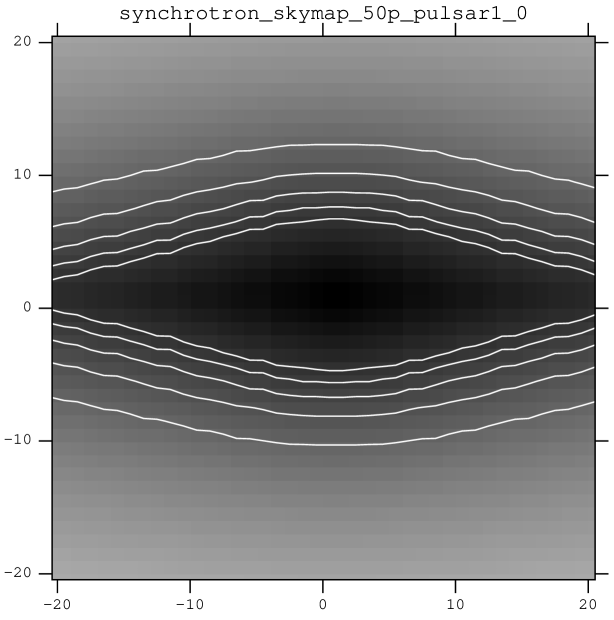
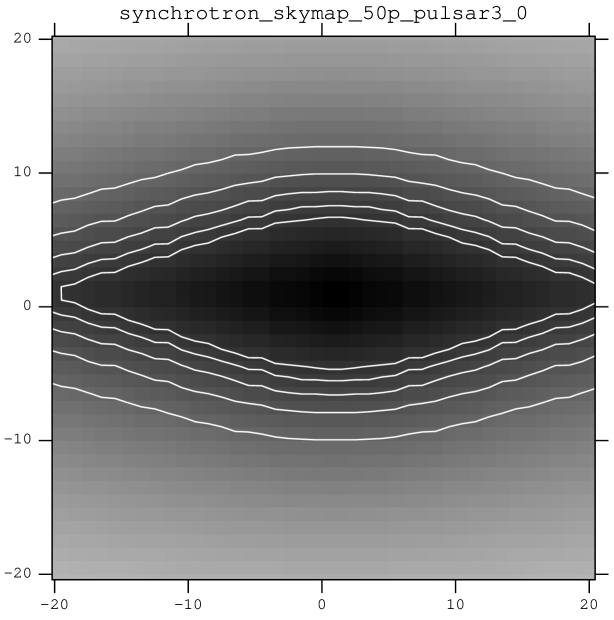
The pulsar contribution to the haze is non-spherical, with the deviation from sphericity determined by a combination of factors including the diffusion coefficient, the structure of the magnetic field, and the spatial distribution of the pulsars. Here we vary each of the these within reasonable range to see their effect on the morphology of the predicted synchrotron signal. In each case, the frequency spectrum as well as the detailed drop in average power as a function of latitude are still good fits to the data. In the top left panel of Fig. 4 we show the synchrotron signal at 22 GHz in galactic coordinates for our fiducial parameters. The signal is distinctly elliptical, but judging whether these parameters are disfavored would require an analysis including the noise properties of the haze map. In the plot to its right, we show the signal when the diffusion coefficient is increased by a factor of 2. This is a modest increase for which we do not have strong observational constraints on the diffusion coefficient towards the center of the galaxy. Clearly, the contours look much more spherical. The largest deviations from sphericity occur close to the disk where the reconstruction of the haze has the largest uncertainties. In the bottom left plot we show the signal when (which governs the radial distribution of the pulsars) is smaller than the fiducial value and equal to 3 kpc.
As mentioned earlier in this section, the population of contributing to the Haslam map is different from the harder pulsar contribution. Further, as we have seen, factors of two change in the diffusion constant have a significant effect on the shape of the synchrotron signal. Thus the behavior of the diffusion constant in the central parts of the galaxy from energies 1 –10 GeV is important in comparing the Haslam and the haze maps. At this level, it is not clear that diffusion along the disk is the same as perpendicular to the disk. This will affect the shape of the signal contours. Lastly, we note that removing the usual (softer) synchrotron component should also remove some of the more extended features in the predicted haze maps.
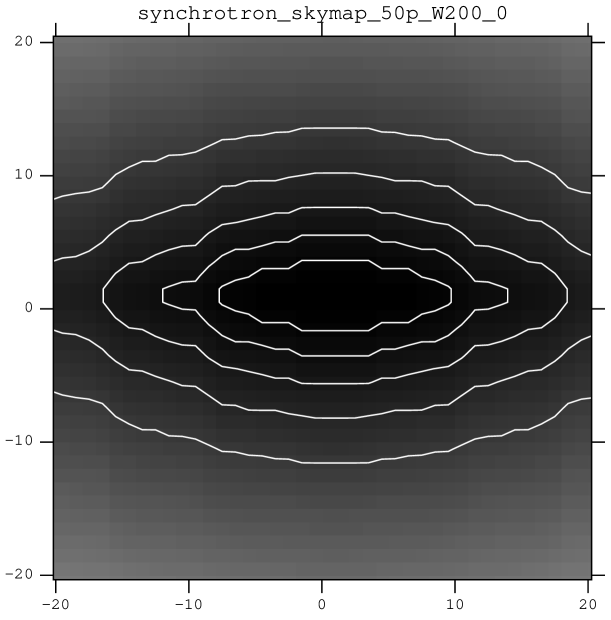
It is clear that the morphology depends significantly on parameters that cannot yet be determined from observations. However, this also opens up the possibility of constraining these parameters and perhaps the contribution of the pulsars to the haze with Fermi and Planck data. Note that the ellipticity in the maps trace back both to the distribution of the pulsars and the cylindrical structure of the magnetic field. A more detailed comparison to the data would have to account for the spiral arms and how the galactic magnetic field is observed to trace the spiral structure. Note that even a perfectly spherical source would result in an elliptical haze profile due to the magnetic field. This is shown in the final plot (bottom right) of Fig. 4 where we show the signal resulting from dark matter annihilations in a halo with inner density profile scaling as . For this plot, we have we have set , so that the influence of the cylindrical magnetic field structure is clear – it makes the contours elliptical. Conversely, we have shown that the haze morphology depends sensitively on the assumed diffusion parameters and the magnetic field in the inner kpc, such that even if the source of is confined to the disk, the resulting haze can look approximately spherical.
4 Conclusions
We have shown that pairs injected into the interstellar medium by the galactic pulsars may contribute significantly to the WMAP haze. The models of pair emission and galactic magnetic fields we investigated showed that pulsars could easily account for all of the haze and successfully reproduce both its angular and frequency distributions observed in the WMAP data. The parameters for the input spectrum, the magnetic field and inverse Compton energy losses that we employed to fit the haze towards the galactic center are also consistent with those that have recently been used to fit the cosmic ray positron excess from a local distribution of pulsars [23, 25]. These facts suggest that both the haze and the positron excesses may have the same underlying source. We also considered the morphology of the haze in detail and pointed out that in it may be possible to use the deviation from sphericity to bound the contribution of from galactic pulsars to the haze.
The possibility that the WMAP haze is due to annihilating dark matter is exciting and it behooves us to search for alternative astrophysical explanations. More detailed investigations are required to bracket the contribution of dark matter annihilation products to the haze. Correlating various signals of dark matter annihilation (positrons, anti-protons, anti-deutrons, gamma-rays, haze, etc) may enable progress in this direction.
Acknowledgments
We thank Greg Dobler, Doug Finkbeiner, Jonathan Feng, Dan Hooper, Igor Moskalenko and Rosie Wyse for discussions and providing helpful suggestions. This work has been supported by the US DOE grants DE-FG02-95ER40896 (KZ) and DE-FG02-95ER40899 (DP), NASA grant NNX09AD09G (MK) and NSF grant PHY-0555689 (MK).
References
- [1] D. P. Finkbeiner, Astrophys. J. 614, 186 (2004) [arXiv:astro-ph/0311547]. D. P. Finkbeiner, G. I. Langston and A. H. Minter, Astrophys. J. 617, 350 (2004) [arXiv:astro-ph/0408292].
- [2] G. Dobler and D. P. Finkbeiner, Astrophys. J. 680, 1222 (2008) [arXiv:0712.1038 [astro-ph]].
- [3] D. P. Finkbeiner, arXiv:astro-ph/0409027.
- [4] D. Hooper, D. P. Finkbeiner and G. Dobler, Phys. Rev. D 76, 083012 (2007) [arXiv:0705.3655 [astro-ph]].
- [5] D. T. Cumberbatch, J. Zuntz, H. K. K. Eriksen and J. Silk, arXiv:0902.0039 [astro-ph.GA].
- [6] S. W. Barwick et al. [HEAT Collaboration], Astrophys. J. 482, L191 (1997) [arXiv:astro-ph/9703192]. J. J. Beatty et al., Phys. Rev. Lett. 93, 241102 (2004) [arXiv:astro-ph/0412230].
- [7] M. Aguilar et al. [AMS-01 Collaboration], Phys. Lett. B 646, 145 (2007) [arXiv:astro-ph/0703154].
- [8] O. Adriani et al., arXiv:0810.4995 [astro-ph]. O. Adriani et al., arXiv:0810.4994 [astro-ph].
- [9] S. Torii et al., arXiv:0809.0760 [astro-ph].
- [10] Fermi Collaboration, arXiv:0905.0025 [astro-ph.HE].
- [11] J. Chang et al., Nature 456, 362 (2008).
- [12] M. Cirelli, M. Kadastik, M. Raidal and A. Strumia, arXiv:0809.2409 [hep-ph].
- [13] I. Cholis, L. Goodenough, D. Hooper, M. Simet and N. Weiner, arXiv:0809.1683 [hep-ph].
- [14] F. Donato, D. Maurin, P. Brun, T. Delahaye and P. Salati, arXiv:0810.5292 [astro-ph].
- [15] L. Bergstrom, G. Bertone, T. Bringmann, J. Edsjo and M. Taoso, arXiv:0812.3895 [astro-ph].
- [16] D. Hooper, A. Stebbins and K. M. Zurek, arXiv:0812.3202 [hep-ph].
- [17] P. Grajek, G. Kane, D. Phalen, A. Pierce and S. Watson, arXiv:0812.4555 [hep-ph].
- [18] P. Blasi, arXiv:0903.2794 [astro-ph.HE].
- [19] N. J. Shaviv, E. Nakar and T. Piran, arXiv:0902.0376 [astro-ph.HE].
- [20] A. M. Atoian, F. A. Aharonian and H. J. Volk, Phys. Rev. D 52, 3265 (1995).
- [21] X. Chi, E. C. M. Young and K. S. Cheng, Astrophys. J. 459, L83 (1995).
- [22] L. Zhang and K. S. Cheng, Astron.Astrophys. 368, 1063 (2001).
- [23] D. Hooper, P. Blasi and P. D. Serpico, JCAP 0901, 025 (2009) [arXiv:0810.1527 [astro-ph]].
- [24] H. Yuksel, M. D. Kistler and T. Stanev, arXiv:0810.2784 [astro-ph].
- [25] S. Profumo, arXiv:0812.4457 [astro-ph].
- [26] D. Malyshev, I. Cholis and J. Gelfand, arXiv:0903.1310 [astro-ph.HE].
- [27] L. Zhang, K. S. Cheng, Z. J. Jiang and P. Leung, Astrophys. J. 604, 317 (2004) [arXiv:astro-ph/0402089].
- [28] K. S. Cheng, C. Ho and M. A. Ruderman, Astrophys. J. 300, 500 (1986).
- [29] J. Chiang and R. W. Romani, Astrophys. J. 436, 754 (1994).
- [30] L. Zhang and K. S. Cheng, Astrophys. J. 487, 370 (1997).
- [31] B. Paczynski, Astrophys. J. 348, 485 (1990)
- [32] S. J. Sturner and C. D. Dermer, Astrophys. J. 461, 872 (1996).
- [33] D. R. Lorimer et al., Mon. Not. Roy. Astron. Soc. 372, 777 (2006) [arXiv:astro-ph/0607640].
- [34] S. Boissier and N. Prantzos, Mon. Not. Roy. Astron. Soc. 307, 857 (1999) [arXiv:astro-ph/9902148].
- [35] A. W. Strong and I. V. Moskalenko, Astrophys. J. 509, 212 (1998) [arXiv:astro-ph/9807150].
- [36] I. V. Moskalenko and A. W. Strong, Astrophys. J. 493, 694 (1998). [arXiv:astro-ph/9710124].
- [37] V. S. Ptuskin, I. V. Moskalenko, F. C. Jones, A. W. Strong and V. N. Zirakashvili, Astrophys. J. 642, 902 (2006) [arXiv:astro-ph/0510335].
- [38] T. A. Porter and A. W. Strong, arXiv:astro-ph/0507119.
- [39] A. W. Strong, I. V. Moskalenko and O. Reimer, Astrophys. J. 537, 763 (2000) [Erratum-ibid. 541, 1109 (2000)] [arXiv:astro-ph/9811296].
- [40] A. Broadbent, T. C. G. Haslam, and L. J. Osborne, 1990, International Cosmic Ray Conference, 3, 229
- [41] J. L. Han, arXiv:astro-ph/0603512.
- [42] T. N. LaRosa, C. L. Brogan, S. N. Shore, T. J. Lazio, N. E. Kassim and M. E. Nord, Astrophys. J. 626, L23 (2005) [arXiv:astro-ph/0505244].
- [43] A. W. Strong, I. V. Moskalenko and O. Reimer, Astrophys. J. 613, 962 (2004) [arXiv:astro-ph/0406254].
- [44] T. Delahaye, F. Donato, N. Fornengo, J. Lavalle, R. Lineros, P. Salati and R. Taillet, Astron. Astrophys. 501, 821 (2009) [arXiv:0809.5268 [astro-ph]].
- [45] D. Hooper, Phys. Rev. D 77, 123523 (2008) [arXiv:0801.4378 [hep-ph]].
- [46] P. Grajek, G. Kane, D. J. Phalen, A. Pierce and S. Watson, arXiv:0807.1508 [hep-ph].
- [47] G. Ghisellini, P. W. Guilbert, and R. Svensson, ”The Synchrotron Boiler” Astrophys. J. 334, L5.
- [48] G. G. Raffelt, arXiv:astro-ph/0701677.
- [49] C. A. Faucher-Giguere and V. M. Kaspi, Astrophys. J. 643, 332 (2006) [arXiv:astro-ph/0512585].