Growth, magnetic properties and Raman scattering of La2NiMnO6 single crystals
Abstract
Millimeter size single crystals of double perovskite La2NiMnO6 (LNMO) were grown by the High Temperature Solution Growth Method. The magnetic measurements and polarized Raman spectra between 5 and 350 K provide evidence that the crystals have high degree of Ni2+/Mn4+ ordering, small amount of lattice defects and highest T K reported so far for ferromagnetic double perovskites. At a microscopic level the crystals are heavily twinned and the effect of twinning on the Raman spectra is analyzed in detail.
pacs:
78.30.-j, 63.20.Dj, 75.47.LxI Introduction
The ferromagnetic materials with double-perovskite structure AMnO6 (=rare earth, =Co,Ni) are prospective for applications and their properties attract definite attention.prellier2005 ; fiebig2005 ; singh2006 La2NiMnO6 (LNMO) is of particular interest because of its high magnetic transition temperature ( K)wold1958 ; dass2003 and possibility of preparation of high quality LNMO thin films.singh2007 ; guo2008
Physical properties of LNMO have been recently investigated in detail.goodenough1976 ; dass2003 ; rogado2005 ; bull2003 ; singh2007 ; guo2008 These studies have demonstrated that a well-ordered LNMO exhibits monoclinic or rhombohedral symmetry with Ni2+ and Mn4+ cations alternatively arranged at B-sites while a disordered phase exhibits an orthorhombic symmetry with random distribution of Ni3+ and Mn3+ at the B-sites in the ideal ABO3 perovskite structure. The changes in oxidation states of Ni/Mn cations provoke modification in their electronic and magnetic states. This leads to ferromagnetism up to 280 K and 5 /f.u. saturation magnetization in well-ordered LNMO caused by the ferromagnetic Ni - O - Mn superexchange interaction. It has also been found that, depending on the synthesis conditions, LNMO can have two ferromagnetic phase transitions at T K and T K.singh2007 The low-temperature magnetic transition is usually caused by cation disorder which provokes a different Ni3+-O-Mn3+ superexchange path.goodenough1976 The mixture of ordered and disordered phases with varying composition, reported for the bulk materialsgoodenough1976 ; dass2003 ; bull2003 ; singh2007 affects the magnetic properties of LNMO. Thus, the magnetic behavior can be used as a sensitive tool for characterization of cation ordering in LNMO crystals.
There are several reports on the Raman spectra of La2NiMnO6 and La2CoMnO6 (LCMO) bulk and thin film samples.bull2004 ; guo2006 ; iliev2007 ; iliev2007a ; truong2007 ; guo2008 ; burgess2008 The spectra have been analyzed on the basis of the low-temperature monoclinic and/or high-temperature rhombohedral structure, both consistent with (Co,Ni)/Mn ordering.dass2003 ; bull2003 . The comparative temperature-dependent studies of magnetic properties and polarized Raman spectra of bulk and thin film LCMOtruong2007 have revealed similarities and differences in magnetic response, Raman line shapes and phonon anomalies near magnetic transitions. These differences have been explained by the different degree of cation ordering. To our knowledge, there are no similar reports for LNMO single crystals.
This paper reports a successful growth of LNMO single crystals and presents the results of our study of their magnetic properties between 5 and 350 K and polarized Raman spectra between 10 and 295 K. The crystals have high degree of Ni2+/Mn4+ ordering, small amount of lattice defects and exhibit the highest T K reported so far for ferromagnetic double perovskites. It was found that at microscopic level the crystals are heavily twinned and the effect of microtwinning on the polarized Raman spectra is analyzed in detail.
II Crystal growth
As a first step of the single crystal growth route polycrystalline LNMO was synthesized by the solid state reaction. Stoichiometric amounts of La2O3, NiO and MnO2 were mixed, compacted and then calcinated in air at 950∘C for 48 hours. The reacted product was ground and mixed with Pb3O4 flux (in 8:1 ratio). The mixture was melted and heated to 1220 ∘C in a platinum crucible of 50 mm diameter and 90 mm depth, covered with platinum lid. Single crystals were obtained by cooling the solution from 1220 to 930 ∘C at a cooling rate of 1.0 ∘C/h. The residual flux was separated from the as-grown crystals by decanting. The so obtained crystals were of rectangular shape and of typical size mm3. The elemental analysis showed that the atomic percent ratio La:Ni:Mn:O is within 10% close to the ideal 2:1:1:6 with Mn amount slightly exceeding that of Ni. In addition small amount of Pb (1%) was also found.
III Magnetic properties
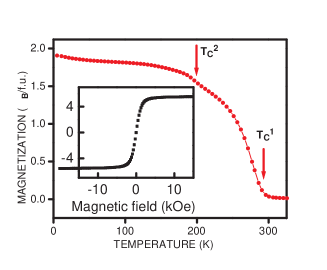
The magnetization as a fuction of temperature ( curves) in the 10-350 K temperature range and applied magnetic field ( loops) at 10 K were measured using a Superconducting quantum interference device (SQUID) magnetometer from Quantum Design. As it follows from Fig.1, a ferromagnetic-to-paramagnetic phase transition (FM-T) is clearly pronounced around 288 K, the highest transition temperature reported for LNMO so far. Another much weaker anomaly (FM-T) is seen at about 188 K. The high value of FM-T is consistent with Ni2+/Mn4+ cation ordering which favors a ferromagnetic NiOMn superexchange interaction. The FM-T anomaly indicates that in a small part of the volume there is only short range Ni/Mn ordering. The inset of Fig. 1 shows a typical hysteresis loop measured at 10 K. It is characterized by a well defined hysteresis with a coercive field of about 90 Oe and attains the approximate full magnetic saturation at about 8 kOe magnetic fields. It is important here to note that the polycrystalline ordered LNMO shows a relatively large coercive field ( Oe).rogado2005 This difference could be interpreted as the pinning of magnetic domains due to the presence of substantive amount of grain boundaries in the polycrystalline samples. The saturation magnetization of the LNMO crystal was found to be about 5.2 /f.u., which is very close to their theoretical value of spin only 5 /f.u. magnetic moment.rogado2005 This further confirms that the LNMO possess a long range Ni/Mn ordering.
IV Raman spectra
The Raman spectra were measured in backward scattering configuration using two different spectrometers: Labram-800 and T64000 (Horiba Jobin Yvon), both equipped with microscopes, optical cryostats and liquid-nitrogen-cooled CCD detectors. The spectra obtained with 488, 515 nm (Ar+) and 633 nm (He-Ne) were practically identical. It was also found that the spectra taken with same orientation of incident and scattering polarization with respect to cubic edges reproduce themselves for all six as grown cubic surfaces: an indication that the structure is twinned at a microscopic level. As the microtwinning determines the spectral lineshape for a given scattering configuration, it will be considered in more detail in the next subsection.
IV.1 Effect of microtwinning on the Raman spectra
From general consideration one expects for the monoclinic(pseudotetragonal) structure six twin variants with the lattice parameter along the , , , , , and directions. In the rhombohedral structure four twin variants with trigonal axis oriented oriented along the , , , and cubic directions may coexist. At fixed incident and scattered light polarizations (with respect to the quasicubic directions), the scattering configuration for the distinct twin variants will be different as it is linked to the orthogonal coordinate system of the Raman tensors and, hence, to the -axis, or . Therefore, the polarization selection rules, which determine the Raman scattering response, in the case of microtwinning will be the average of selection rules for all twin variants in the scattering volume. Further the polarization directions of the incident and scattering radiation will be given in a laboratory coordinate system oriented along the quasicubic crystallographic axes, namely , , , , and . The polarization selection rules for the twin variants of the monoclinic structure in , , , , , and backscattering configurations are given in Table I. For this structure phonon modes are Raman allowed. Similar analysis (not shown here) was done for the rhombohedral structure where the expected Raman modes are .
| Raman tensors |
| 0 | 0 | 0 | ||||
| 0 | ||||||
| 0 |
The twin variant polarization selection rules provide some clues for determination of Raman line symmetry of multitwinned samples. For both, or , structures the averaged intensity of the fully symmetrical modes are stronger in parallel ( or ) than in crossed ( or ) scattering configuration. Neither structure can, however, be excluded on the basis of polarization dependence of or modes as after averaging these dependences become similar for both structures. The structures can rather be distinguished by accounting for the number of expected and observed Raman modes and considering the frequency range of their appearance.
IV.2 Raman spectra
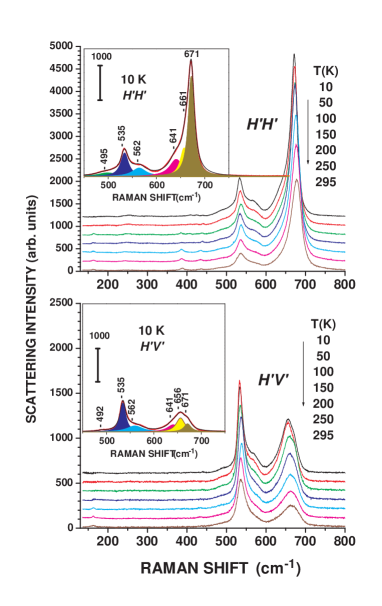
Fig.2 shows the polarized Raman spectra of LNMO single crystal measured at 300 K with all available exact scattering configurations with laser focus spot of m diameter. The identity of and pairs of spectra as well the fact that the same spectra were obtained from all quasicubic surfaces unambiguously evidences microtwinning at a microscopic level. The spectra are very similar and phonon line positions are very close to those of high quality LNMO thin filmsiliev2007 , but more spectral structures are observed in the low frequency range in our case. The lines at 128, , , 383, 435(?)and 678 cm-1 are stronger in the and spectra and can be assigned to modes. The modes are represented by the lines at 122, 163, 534, and 665 cm-1, which are stronger in the and spectra. The decomposition of the spectral structure between 480 and 700 cm-1 reveals additional Raman bands at , and cm-1 (see the insets in Fig.3), which rises the number of experimentally observed Raman modes from the LNMO crystal to 13, well above that expected for the rhombohedral structure (). The Raman spectra at room temperature are therefore more consistent with the monoclinic structure where larger number phonon modes are Raman allowed. Such a conclusion is further supported by the fact that except for some sharpening and shift of the lines the spectra practically do not change with lowering temperature down to 10 K. This is illustrated in Fig.3.
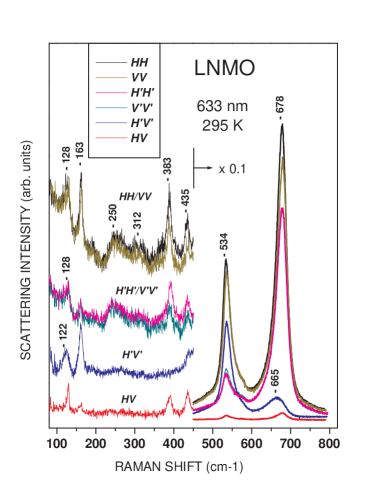
The assignment of the two strong Raman peaks in double perovskites, near 678 cm-1 () and 534 cm-1 ( or ) for LNMO, has previously been discussed.iliev2007a ; iliev2007 ; guo2008 It has been argued that the highest mode originates from the Raman allowed (breathing) mode of the parent structure, whereas that at 534 cm-1 is in the frequency range of anti-stretching and bending vibrations of (Mn/Ni)O6 octahedra, which are also Raman active in the structure. The weak Raman lines correspond to modes activated by the monoclinic distortions. The correlation between , , and Raman modes could be found in Ref.iliev2007a .
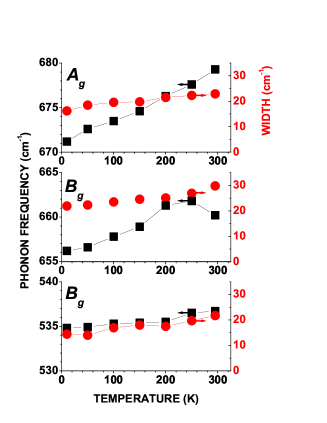
The temperature dependent and spectra of LNMO between 10 and 295 K are shown in Fig.3. The effect of lowering temperature is a moderate sharpening and weak shift of the Raman lines. The complex structure between 480 and 700 cm-1, however, is well pronounced and can be fitted in the whole temperature range by six Lorentzians, which allows to determine the temperature dependence of the corresponding phonon parameters. The variations with temperature of the frequency and width of the three most pronounced peaks at 678 cm-1 (), 665 cm-1 (), and 534 cm-1 () are given in Fig.4.
The linewidth of a simple phonon line is a measure of the phonon lifetime. It is determined by the dominating scattering mechanism, which could be temperature-independent scattering from lattice defects or temperature-dependent scattering from phonons. Following the standard model for anharmonic phonon decay through phonon-phonon scattering,ipatova1967 ; balkanski1983 the variations of the phonon linewidth with temperature follows the dependence:
| (1) |
where is the temperature-independent part of the linewidth, , is the phonon energy, is the Boltzmann constant. From Eq.(1) for one expects an increase of the phonon linewidth from 10 to 300 K by factors 1.48, 1.51, and 1.76, respectively, for the 678, 665, and 535 cm-1 modes. The actual increase observed experimentally is by factors 1.41, 1.36, and 1.51, respectively. It is expectedly lower, but the numbers are close enough, which implies the presence of relatively small amount of lattice defects.
The data of Fig.4 confirm earlier reports for anomalous softening of phonon frequencies below the magnetic transition due to strong spin-phonon coupling. Interestingly, while in the case of LNMO films the phonon softening has been strongly pronounced only for the high frequency mode,iliev2007 , in the LNMO single crystal all modes are affected. More detail analysis of the deviation from the standard anharmonic behavior, however, is not possible at this stage as there are not enough experimental points from the paramagnetic phase above FM-T K.
V Conclusions
We have grown successfully high quality LNMO single crystals of mm size and studied their magnetic properties and Raman scattering spectra. The magnetic transition temperature of 288 K is the highest for LNMO reported so far. It was found that the single crystals are heavily twinned at a microscopic level and the effect of twinning on the polarized Raman spectra was investigated in detail. The temperature dependent spectra provide evidence for relatively low amount of lattice defects and strong spin-phonon coupling in the magnetically ordered state.
Acknowledgements.
This work was supported in part by Grant No. TK-X-1712/ 2007 of the Bulgarian Science Fund, the State of Texas through the Texas Center for Superconductivity at the University of Houston, the Canadian Institute for Advanced Research, Canada Foundation for Innovation, Natural Sciences and Engineering Research Council (Canada), Fonds Québécois pour la Recherche sur la Nature et les Technologies (Québec) and the Université de Sherbrooke.References
- (1) W. Prellier, M.P. Singh, P. Murgavel, J.Phys.: Condensed Matter 17, R 803 (2005).
- (2) M. Fiebig, J.Phys. D 38, R123 (2005).
- (3) M.P. Singh, Ch. Simon, B. Reveau, W. Prellier, Phase Transitions 79, 973 (2006).
- (4) A. Wold, R.J. Arnott, J.B. Goodenough, J. Appl. Phys., 29, 307 (1958).
- (5) R I. Dass, J. Q. Yan, and J. B. Goodenough. Phys. Rev. B 67, 014401 (2003); ibid, 68 064415 (2003).
- (6) M. P. Singh, C. Grygiel, W. C. Sheets, Ph. Boullay, M. Hervieu, W. Prellier, B. Mercey, Ch. Simon, and B. Raveau Appl. Phys. Lett., bf 91, 012503 (2007).
- (7) H. Z. Guo, J. Burgess, E. Ada, S. Street, A. Gupta, M. N. Iliev, A. J. Kellock, M. Varela, S. Pennycook, Phys. Rev B 77, 174423 (2008).
- (8) N. S. Rogado, J. Li, A. W. Sleight, and M. A. Subramanian, Adv. Mater. 17, 2225 (2005).
- (9) J. B. Goodenough, Magnetism and the chemical bond, Inter Science Publ. NY, 1976.
- (10) C. L Bull, D. Gleeson and K. S. Knight, J. Phys. Condens. Mat. 15, 4927 (2003).
- (11) C. L. Bull and P. F. McMillan, J. Solid State Chem. 177, 2323 (2004).
- (12) H. Guo, J. Burgess, S. Street, and A. Gupta, Appl. Phys. Lett. 89, 022509 (2006).
- (13) J. Burgess, H. Z. Guo, A. Gupta, S. Street, Vibrational Spectroscopy 48, 113 (2008).
- (14) M. N. Iliev, M. V. Abrashev, A. P. Litvinchuk, V. G. Hadjiev, H. Guo, A. Gupta, Phys. Rev. B 75, 104118 (2007).
- (15) M. N. Iliev, H. Guo, and A. Gupta, Appl. Phys. Lett. 90, 151914 (2007).
- (16) K. D. Truong, J. Laverdi re, M. P. Singh, S. Jandl, and P. Fournier, Phys. Rev. B 76, 132413 (2007).
- (17) I. P. Ipatova, A. A. Maradudin, and R. F. Wallis, Phys. Rev. 155, 882 (1967).
- (18) M. Balkanski, R. F. Wallis, and E. Haro, Phys. Rev. B 28, 1928 (1983).