Swinging and Synchronized Rotations of Red Blood Cells in Simple Shear Flow
Abstract
The dynamics of red blood cells (RBCs) in simple shear flow was studied using a theoretical approach based on three variables: a shape parameter, the inclination angle , and phase angle of the membrane rotation. At high shear rate and low viscosity contrast of internal fluid, RBCs exhibit tank-treading motion, where rotates with swinging oscillation of shape and . At low shear rate, tumbling motion occurs and rotates. In the middle region between these two phases, it is found that synchronized rotation of and with integer ratios of the frequencies occurs in addition to intermittent rotation. These dynamics are robust to the modification of the potential of the RBC shape and membrane rotation. Our results agree well with recent experiments.
pacs:
87.16.D-, 05.45.-a, 82.40.BjI Introduction
Soft deformable objects, such as liquid droplets, vesicles, cells, and synthetic capsules exhibit a complex behavior under flows. For example, in capillary flow, fluid vesicles Vitkova et al. (2004), red blood cells (RBCs) Fung (1997, 2004); Skalak (1969); Gaehtgens et al. (1980); Noguchi and Gompper (2005a); McWhirter et al. (2009); Pozrikidis (2005), and synthetic capsules Lefebre et al. (2008) deform to parachute shapes, and RBCs also deform to slipper shapes Skalak (1969); Gaehtgens et al. (1980); Noguchi and Gompper (2005a); McWhirter et al. (2009). Shape transitions of fluid vesicles occur in simple shear flow Noguchi and Gompper (2004, 2005b); Noguchi (2009). Membrane wrinkling appears for fluid vesicles after inversion of an elongational flow Kantsler et al. (2007); Turitsyn and Vergeles (2008) and for synthetic capsules in simple shear flow Walter et al. (2001); Finken and Seifert (2006). Among these soft objects, RBC have received a great deal of attention, since they are important for both fundamental research and medical applications. In microcirculation, the deformation of RBCs reduces the flow resistance of microvessels. In patients with diseases such as diabetes mellitus and sickle cell anemia, the RBCs have a reduced deformability and often block the microvascular flow Fung (1997); Tran-Son-Tay et al. (1984); Nash and Meiselman (1983); Tsukada et al. (2001); Higgins et al. (2007).
In a simple shear flow with flow velocity , fluid vesicles and RBCs show a transition from a tank-treading (TT) mode with a constant inclination angle to a tumbling (TB) mode with increasing viscosity of the internal fluid Keller and Skalak (1982); Beaucourt et al. (2004); Mader et al. (2006); Kantsler and Steinberg (2006) or membrane viscosity Noguchi and Gompper (2004, 2005b). This transition is described well by the theory of Keller and Skalak (KS) Keller and Skalak (1982), which assumes a fixed ellipsoidal vesicle shape. Experimentally, synthetic capsules and RBCs show the oscillation of their lengths and , called swinging (SW) Chang and Olbricht (1993); Walter et al. (2001); Abkarian et al. (2007), during TT motion, and RBCs also transit from TB to TT with increasing Goldsmith and Marlow (1972); Abkarian et al. (2007). Recently, this dynamics was explained by the KS theory with the addition of an energy barrier for the TT rotation caused by the membrane shear elasticity Skotheim and Secomb (2007); Abkarian et al. (2007). More recently, this transition was also obtained by simulations Kessler et al. (2008); Sui et al. (2008). However, the detailed dynamics has not yet been investigated.
For fluid vesicles in high shear flow, shape transitions Noguchi and Gompper (2004, 2005b); Noguchi (2009) occur, and a swinging phase Kantsler and Steinberg (2006); Noguchi and Gompper (2007); Misbah (2006); Lebedev et al. (2007, 2008), where the shape and oscillate around , appears between the TT and TB phases. This SW mode is also called trembling Kantsler and Steinberg (2006); Lebedev et al. (2007, 2008) or vacillating-breathing Misbah (2006); it is explained by the KS theory extended to a deformable ellipsoidal vesicle Noguchi and Gompper (2007) and the perturbation theory for a quasi-spherical vesicle Misbah (2006); Lebedev et al. (2007, 2008). Shape deformation plays an essential role in the SW of fluid vesicles. The deformation is not necessary to explain the SW of elastic capsules Abkarian et al. (2007); Chang and Olbricht (1993); Walter et al. (2001); Skotheim and Secomb (2007); Kessler et al. (2008); Sui et al. (2008); Navot (1998); Ramanujan and Pozrikidis (1998) but is required for quantitative analysis. In this letter, we extend the theory in Ref. Skotheim and Secomb (2007) to include the shape deformation of RBCs and investigate the dynamics of deformable RBCs.
The internal fluid of RBCs behaves as a Newtonian fluid since RBCs do not have a nucleus and other intracellular organelles. The RBC membrane consists of a lipid bilayer with an attached spectrin network as cytoskeleton. The lipid bilayer is an area-incompressible fluid membrane. The shear elasticity of the composite membrane is induced by the spectrin network. Under physiological conditions, an RBC has a constant volume , surface area , Pas, Ns/m, membrane shear elasticity N/m, and bending rigidity J Noguchi (2009); Fung (2004); Mohandas and Evans (1994); Tran-Son-Tay et al. (1984); Dao et al. (2006).
The models and results are presented with dimensionless quantities (denoted by a superscript ). The lengths and energies are normalized by and , respectively. For RBCs, they are m and J. There are two intrinsic time units: the shape relaxation time by the shear elasticity , and the time of shear flow ; the reduced shear rate is defined as . The relative viscosities are and , where is the viscosity of the outside fluid. In typical experimental conditions, the Reynolds number is low, Re; hence, the effects of the inertia are neglected.
In Sec. II, we describe the extended KS theory Skotheim and Secomb (2007) for an elastic capsule with a fixed ellipsoidal shape, and the phase behavior of the capsule. In Sec. III. we introduce the shape equation for deformable RBCs and present the dynamics of deformed RBCs. The dependence of the function shape of the RBC free-energy potential is described in Sec. IV. Discussion and summary are given in Sec. V and Sec. VI, respectively. The comparison with experimental results is presented in Sec. V.
II Dynamics of elastic capsules with fixed shape
II.1 Models
II.1.1 Keller-Skalak Theory
Keller and Skalak (KS) Keller and Skalak (1982) analytically derived the equation of the motion of vesicles or capsules based on Jeffery’s theory Jeffery (1922). In the KS theory, the vesicles are assumed to have a fixed ellipsoidal shape,
| (1) |
where are the semi-axes of the ellipsoid, and the coordinate axes point along its principal directions. The and axes, with , are on the vorticity () plane, and the axis is in the vorticity () direction. The maximum lengths in three directions are , , and . The velocity field on the membrane is assumed to be
| (2) |
The energy supplied from the external fluid has to be balanced with the energy dissipated in the vesicle, , where and are the energies dissipated inside the vesicle and on the membrane, respectively. The motion of the vesicle is derived from this energy balance. Then the motion of the inclination angle is given by
| (3) | |||||
| (4) | |||||
| (5) |
The membrane-viscosity term has been derived by Tran-Son-Tay et al. Tran-Son-Tay et al. (1984). The factors appearing in Eqs. (3-5) are given by
where is an integral over the membrane surface, and is the normal vector of the surface.
For , a stable fixed point exists, and TT motion occurs, while for , there is no fixed point, and the angle periodically rotates (TB). As or increases, the transition from TT to TB motion occurs, where decreases from to . The membrane viscosity and the internal viscosity have a similar effect; hence, an effective internal viscosity can be defined as . The factor in depends on the vesicle shape and can give different dynamics for deformable vesicles, in particular for shape transformations between prolate and oblate vesicles Noguchi and Gompper (2004, 2005b).
The KS theory quantitatively predicts the TT-TB transition with increasing . However, it cannot explain the TB-TT transition with increasing . In the KS theory, vesicle motion does not depend on except that the TT or TB rotation velocity increases linearly with .
II.1.2 KS Theory with an Energy Barrier
Skotheim and Secomb extended the KS theory to take into account an energy barrier during TT membrane rotation Skotheim and Secomb (2007). For RBCs and synthetic capsules with non-spherical rest shape, their membranes are locally deformed during the TT rotation. Fischer experimentally demonstrated that the RBC membrane rotates back to the original position when the shear flow is switched off Fischer (2004). To describe the energy barrier, a phase angle and free energy potential are introduced; see inset of Fig.1. The potential is periodic, and at the rest shape. Thus, the motions of the inclination angle and phase angle are given by
| (6) | |||||
| (7) |
where . The equations of the original KS theory are recovered in the absence of barriers of the free energy , i.e., , where is independent of .
Skotheim and Secomb used a simple potential and a reduced energy . We employ the potential in this section and describe the dependence on the potential shape in Sec. IV. Eqs. (6) and (7) are numerically integrated using the fourth-order Runge-Kutta method. An oblate capsule with and is used as a model RBC.
II.2 Results
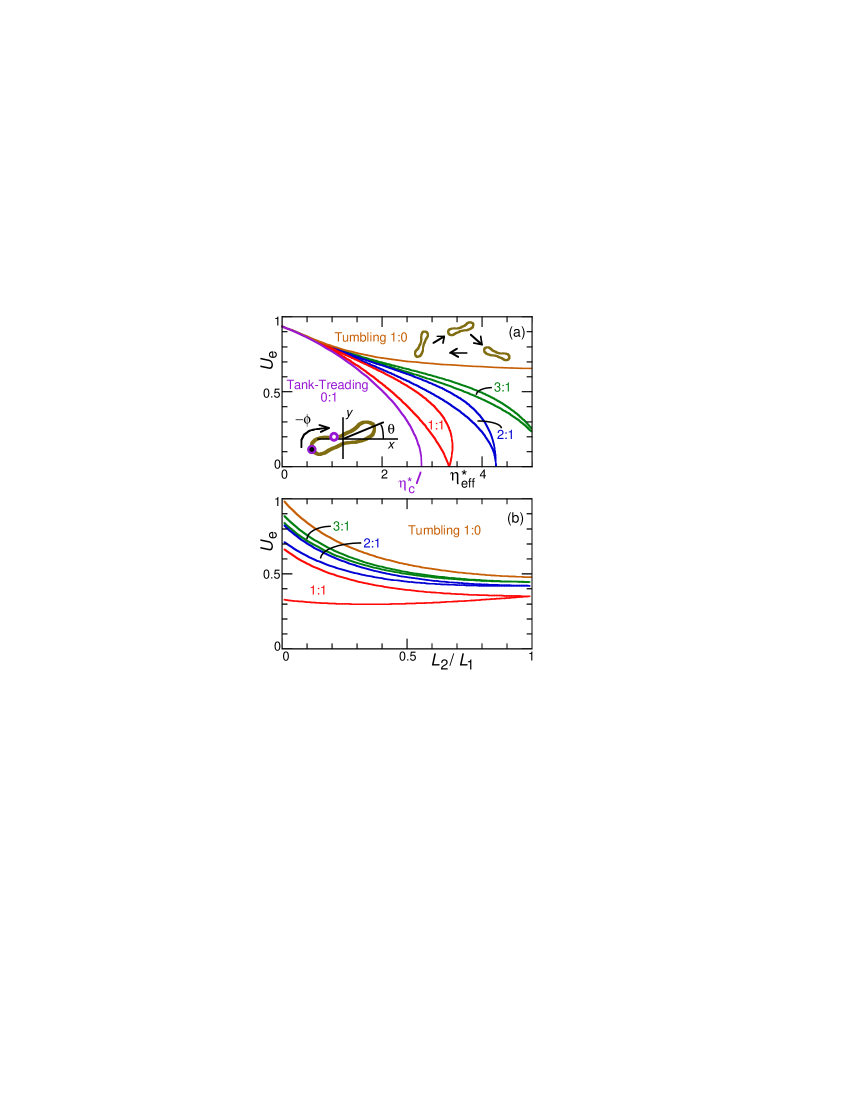
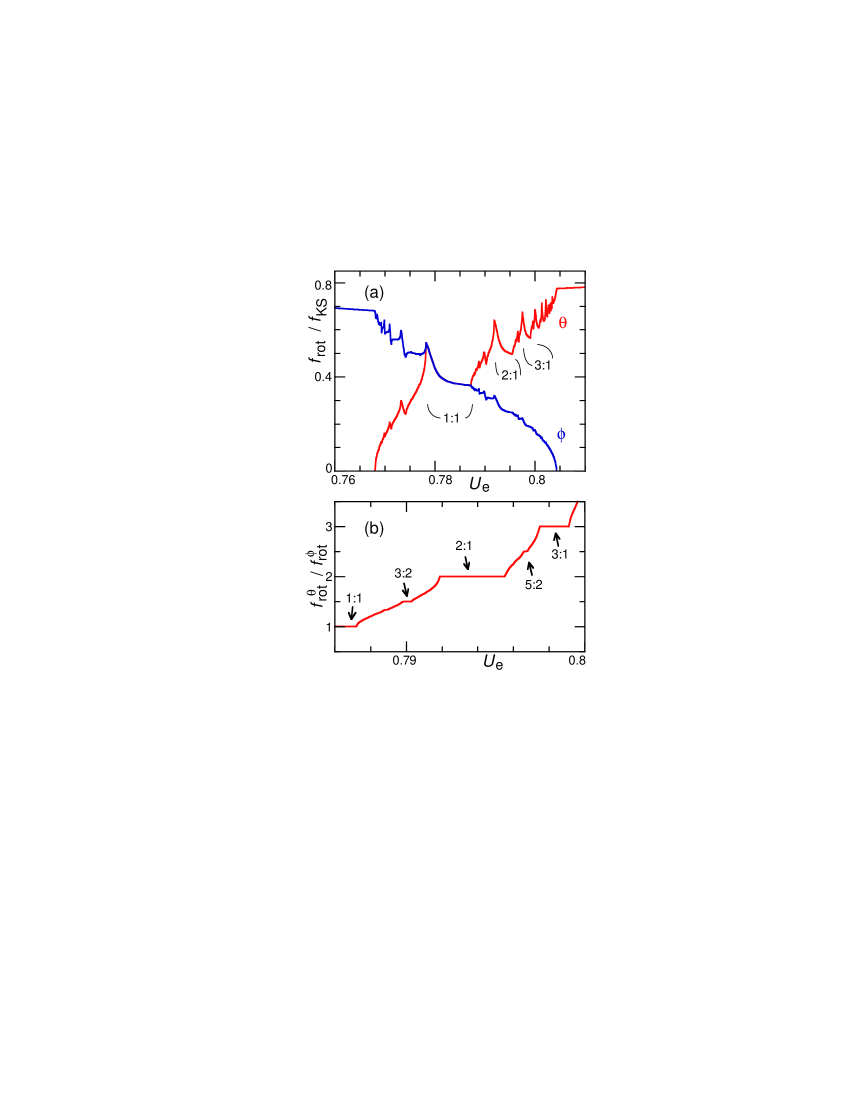
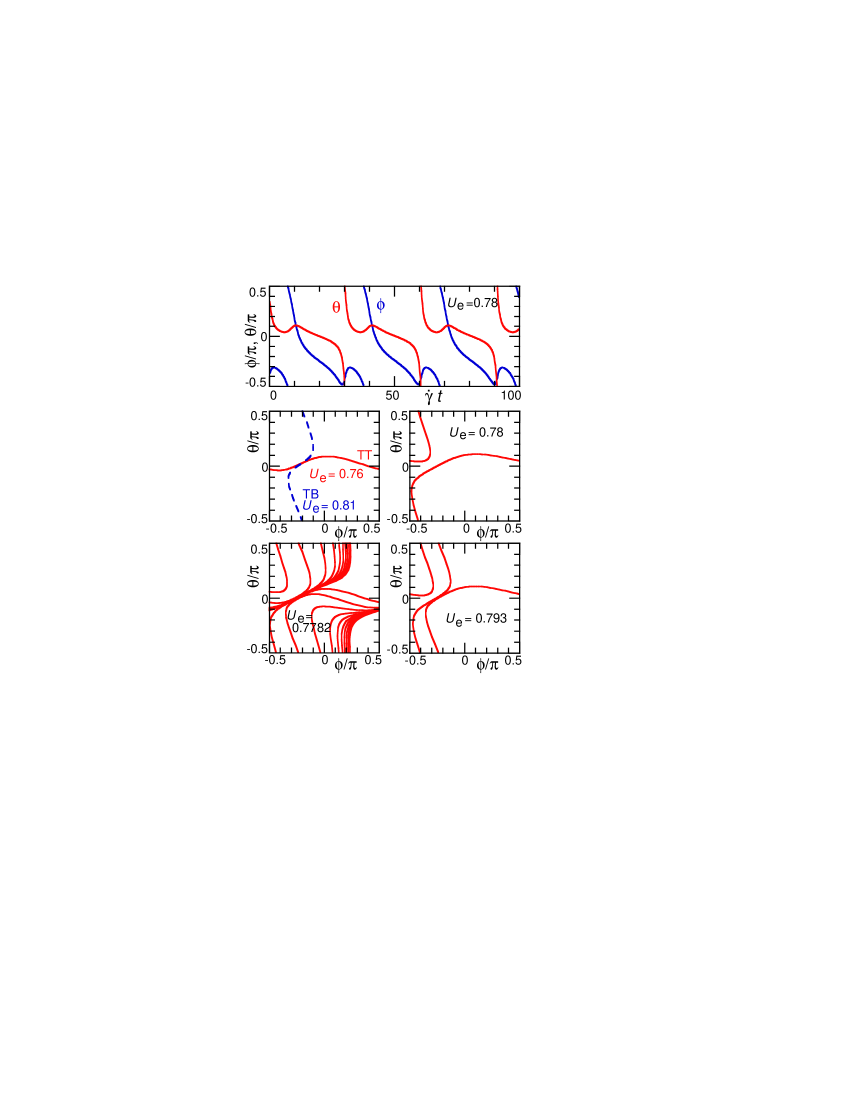
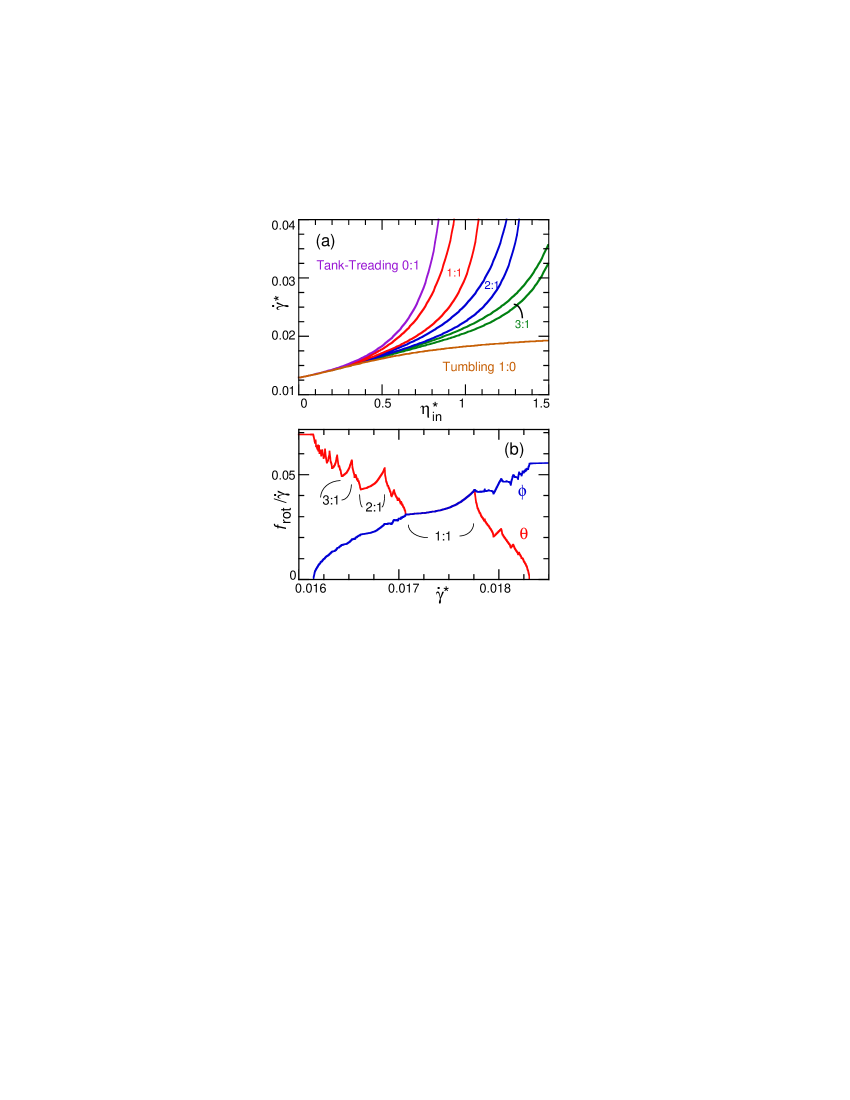
Figures 1-4 show the dynamics of elastic capsules with fixed shapes. At low shear rate (large ), the capsules show TB motion, since the free energy barrier locks the phase angle at . In TB, rotates but osculates; see the trajectory at in Fig. 3. At higher (smaller ) and low , TT motion occurs. In TT, oscillates (swing), and rotates instead of ; see the trajectory at in Fig. 3. The oscillation of or in TB or TT occurs with the rotation frequency or , respectively. Here, an angle change of is counted as one rotation. Skotheim and Secomb Skotheim and Secomb (2007) reported an intermittent phase between the TT and TB phases, where both rotations of and occur. The (TT) rotation is intermittently interrupted by the (TB) rotation slightly above the maximum energy barrier of the TT phase. However, we found that the phases of synchronized rotation of and also exist in this middle range between the TB and TT phases. An infinite number of synchronization phases with integer ratios of and exist; see Fig. 2. This type of synchronization is called the Devil’s staircase Bergé et al. (1984).
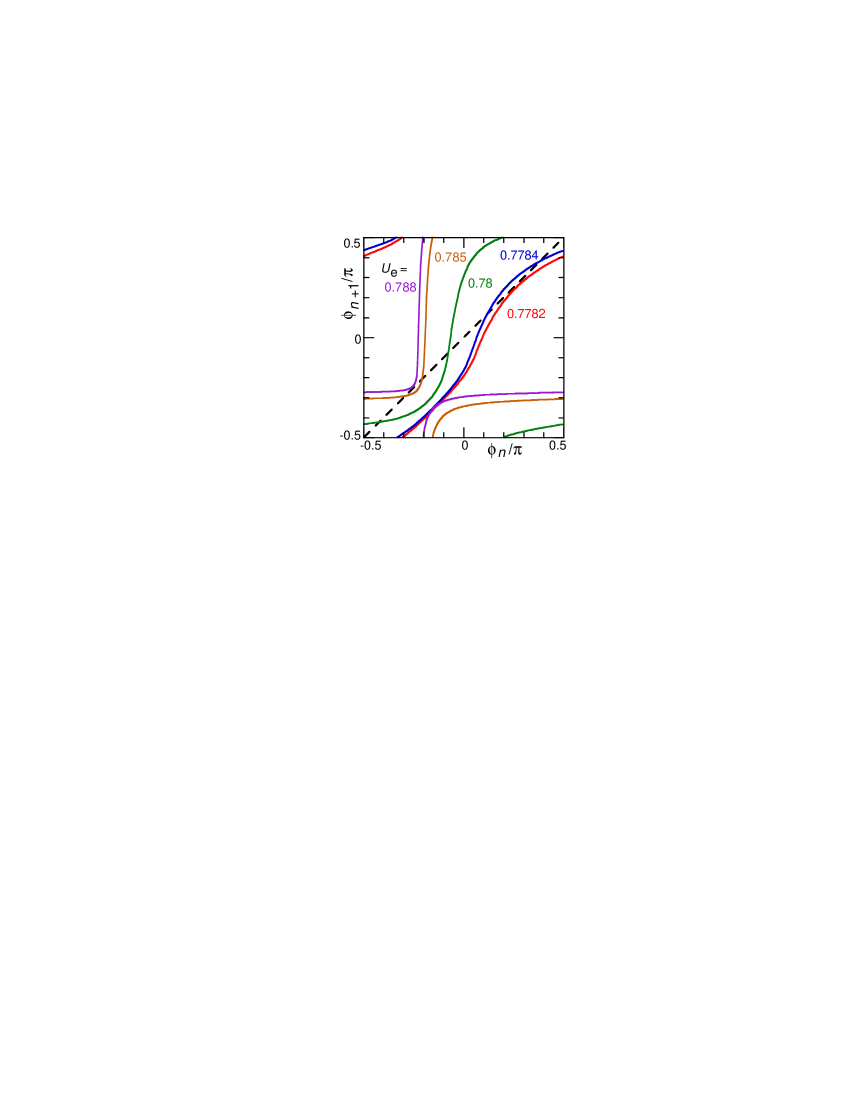
The trajectories of the synchronized rotations with and are shown in Fig. 3. The former has the widest range. The approach to synchronization is explained by the return map at in Fig. 4. The curve shifts to the left with increasing and has two (stable and unstable) crossing points with the line at , where the capsules approach the limit cycle with . At slightly below or above the synchronization region ( or ), intermittent rotation appears, like near the TT and TB regions Skotheim and Secomb (2007); see the trajectory at in Fig. 3.
The qualitative behavior of capsules does not depend on the aspect ratios and . However, the ranges of the synchronized rotations are narrower for more spherical capsules, as shown in Fig. 1(b). Thus, it would be difficult to observe synchronized rotations in quasi-spherical capsules. Note that the dynamics is independent of at ().
A fluid vesicle has no membrane shear elasticity (), and shows no synchronization between and since the potential does not depend on ; see Fig. 1(a). At , intermittent rotation also appears for the fluid vesicle. The tumbling frequency is given by in the KS theory Keller and Skalak (1982). A similar frequency dependence on is obtained in the extended KS theory: slightly above Skotheim and Secomb (2007).
III Dynamics of deformable RBCs
III.1 Shape equation
Previously, we extended the KS theory to include the shape deformation of fluid vesicles, on the basis of the perturbation theory Misbah (2006); Lebedev et al. (2008); Seifert (1999) of quasi-spherical vesicles Noguchi and Gompper (2007). It showed very good agreement with experimental data Kantsler and Steinberg (2006). Here, we have adapted it to RBC dynamics. The shape parameter does not increase monotonically for elongation, because of RBC dimples. Therefore, the shape parameter is employed, where for an oblate ellipsoid (). The equation of the shape evolution is given by
| (8) |
where and . Here, the terms of are added in and based on the theory in Refs. Lebedev et al. (2007, 2008). This revision improves the dependence of fluid vesicles in Ref. Noguchi and Gompper (2007); the phase diagram for becomes similar to that for .
The free energy is estimated by the simulation of a model RBC with elongated by mechanical forces, where the RBC membrane is modeled as a triangular network Noguchi (2009). In the simulation, vertices are connected by a bond potential with , J, and . The area and volume of the RBC are kept constant by harmonic potentials. Our simulation reproduces the force-length curves of the optical-tweezers experiment Mills et al. (2004) and other simulations Dao et al. (2006); Dupin et al. (2007); Vaziri and Gopinath (2008); see Fig. 5 in Ref. Noguchi (2009). The effective force is estimated from these force-length curves; see Fig. 5. The model RBC at has J higher energy than at with in the absence of external forces. This height of the energy barrier agrees with the value J in Ref. Skotheim and Secomb (2007), which was estimated from Fischer’s experiments Fischer (2004). Abkarian et al. estimated the height as to [] based on the velocity field of the KS theory [Eq. (2)] Abkarian et al. (2007). However, it gives much higher barrier J for , or smaller shear modules for J. Since the KS velocity field does not satisfy the local area conservation of membrane, it may give more stress on the membrane than the area-conserving velocity field Secomb and Skalak (1982), and the barrier height may be overestimated.
In this section, we employ the free-energy potential . The dependence on the potential function is discussed in Sec. IV. Instead of an interpolation Noguchi and Gompper (2004, 2005b, 2007), we used fit functions to obtain smooth functions for the numerical calculations: The normalized potentials , ; the shape parameter ; the coefficients , ; and . Eqs. (6), (7), and (8) are numerically integrated using the fourth-order Runge-Kutta method.
In this model, the viscosity ratio of the membrane and inner fluid and the reduced volume are fixed at and . Experimentally, the viscosity of outside fluid is typically varied and and are fixed at physiological values. Thus, corresponds to Pas. The reduced shear rate corresponds to or , at or , respectively.
III.2 Results
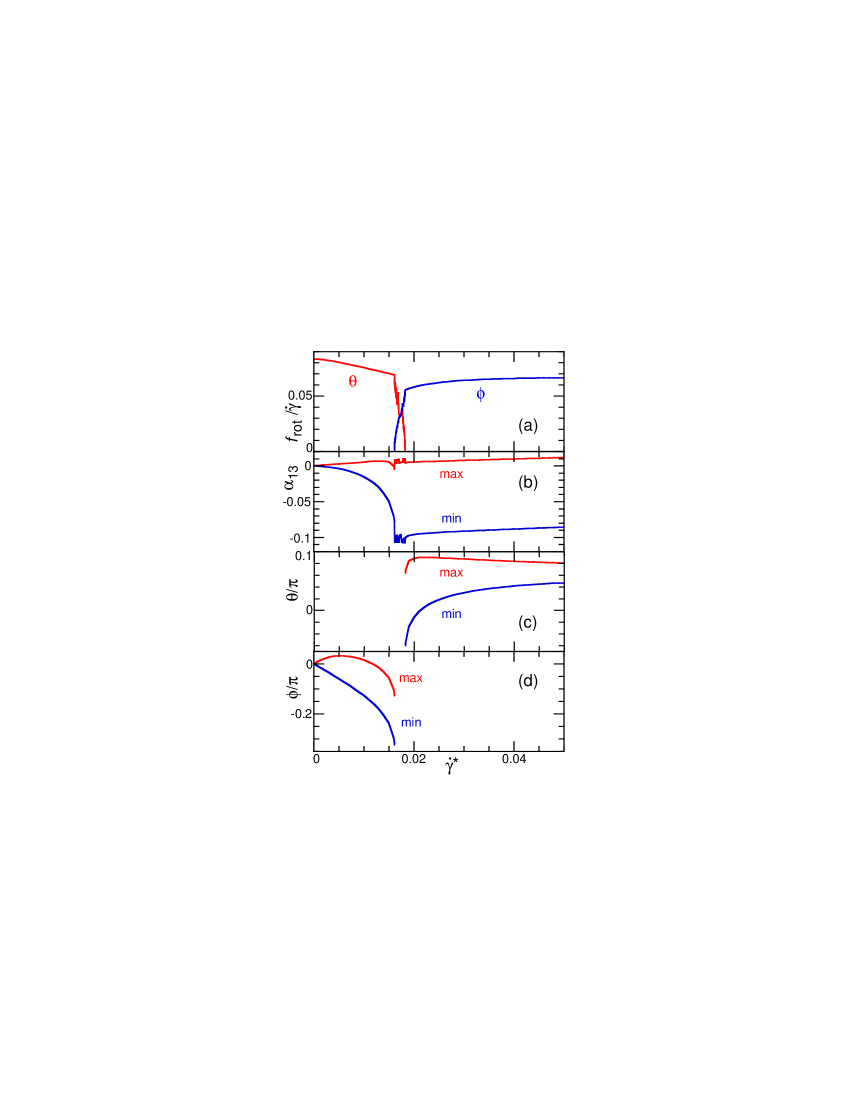
The phase diagram and rotation frequencies of the deformable RBC in simple flow are shown in Fig. 6. The shape deformation does not qualitatively change the phase diagram. The tumbling phase appears in the bottom of Fig. 6(a), since is used for the vertical axis instead of .
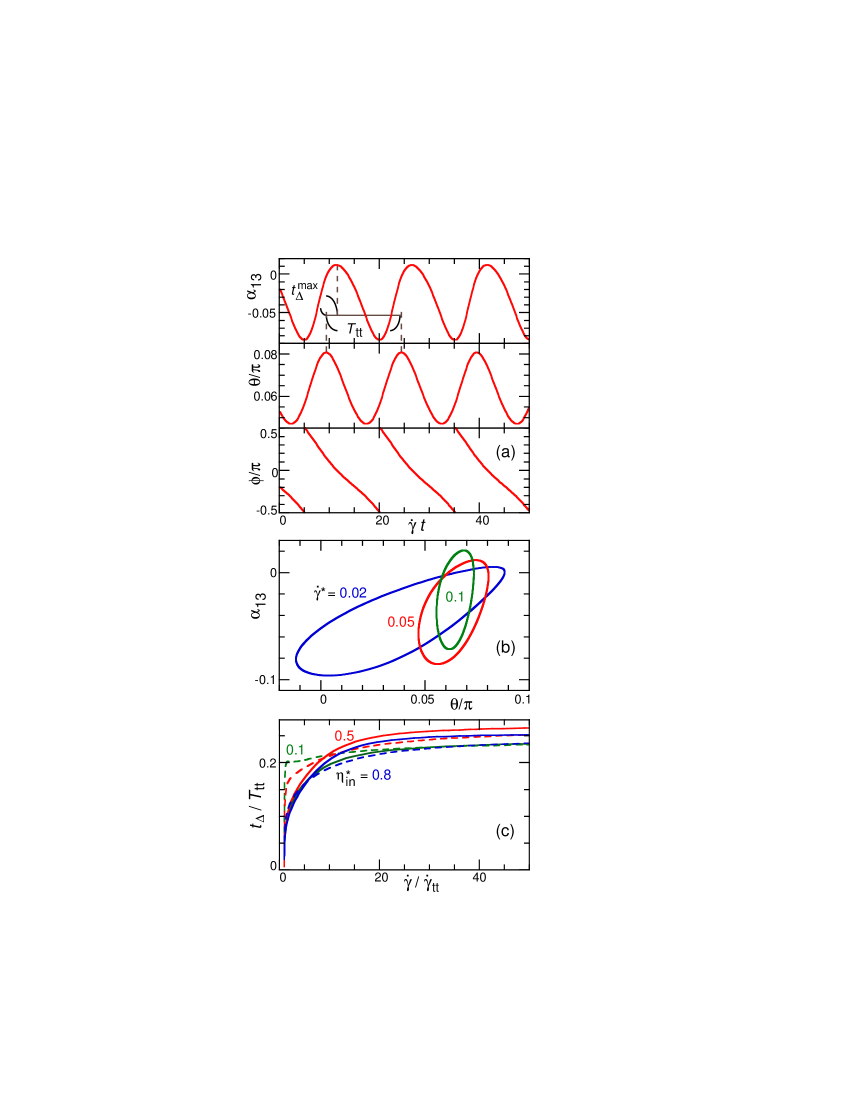
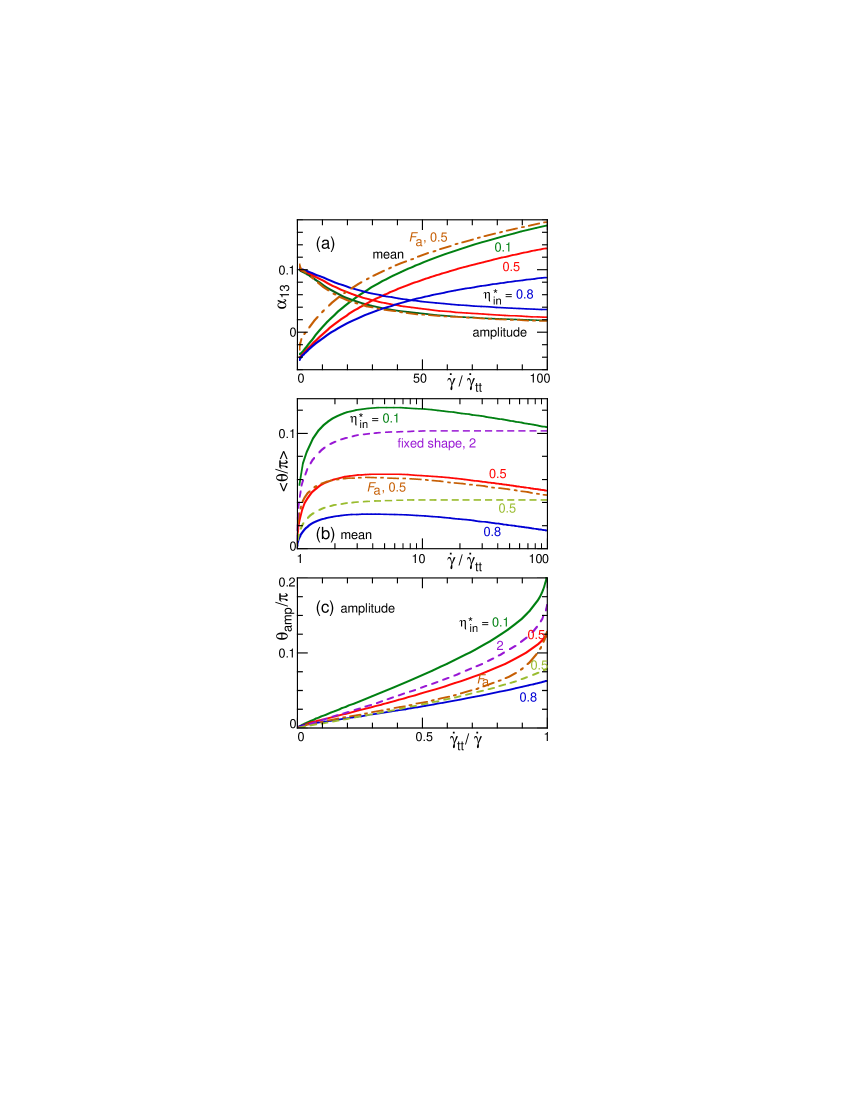
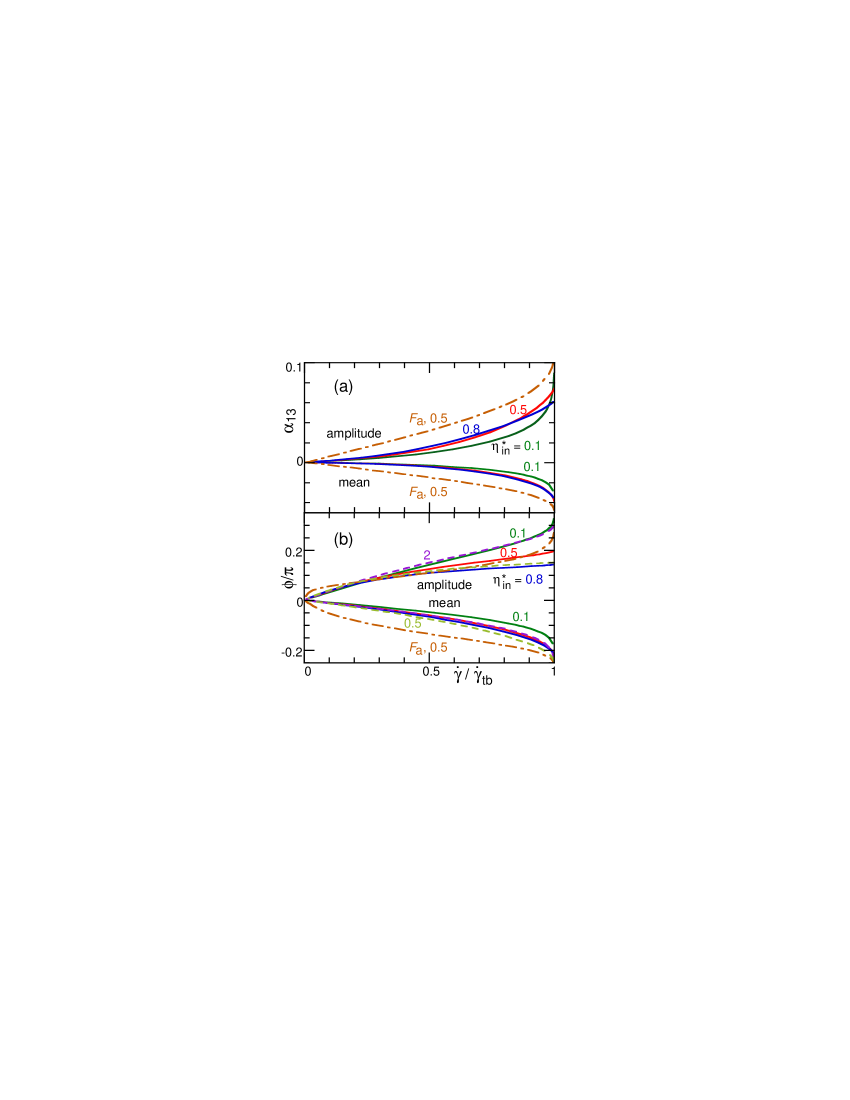
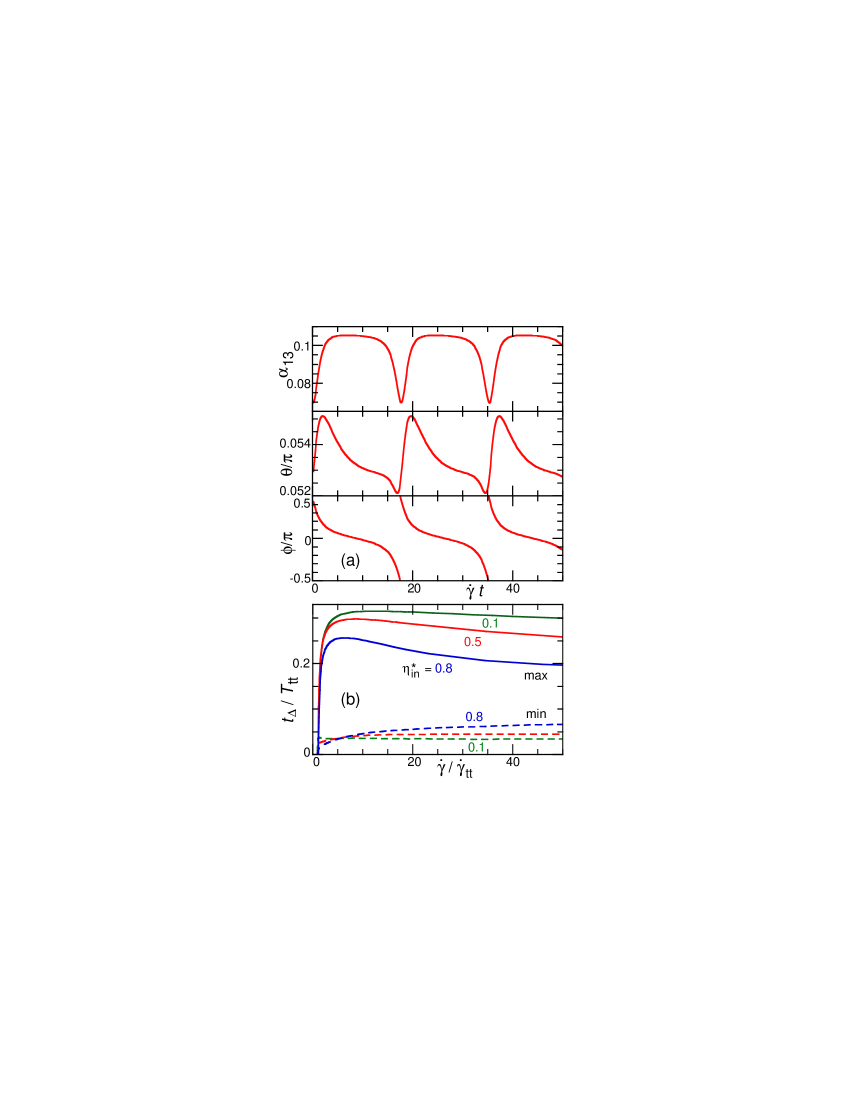
In the TT phase, the shape parameter and oscillate with the frequency ; see Figs. 7(b) and 8(a). As increases, the time-average increases, and the SW oscillation amplitudes of and decrease; see Fig. 9(a). The peak-to-peak amplitude is inversely proportional to for both the deformable and fixed-shape RBCs. For the fixed-shape RBCs, the mean angle increases with increasing and reaches the angle of the KS theory at (). For the deformable RBCs, has a maximum and then decreases because of the elongation of the RBCs; see Figs. 9(b).
In the TT phase, and oscillate with a fixed phase difference; see Fig. 8. The phase difference is calculated from the time difference between the maximum values of and and from between the minimum values. The difference between and represents the asymmetry of the oscillation functions. In a sinusoidal function, . It is found that and show in-phase oscillation () at small , and the phase difference approaches with increasing . Walter et al. experimentally observed a phase difference of for synthetic capsules; see Fig. 7 in Ref. Walter et al. (2001). Our results agree with their experiments.
In the TB phase, decreases and increases with increasing ; see Fig. 10. When the energy barrier at is overcome at , begins to rotate. The average decreases, since has a minimum at for . In TB, there is no significant difference between the deformable and fixed-shape RBCs.
IV Dependence on potential function
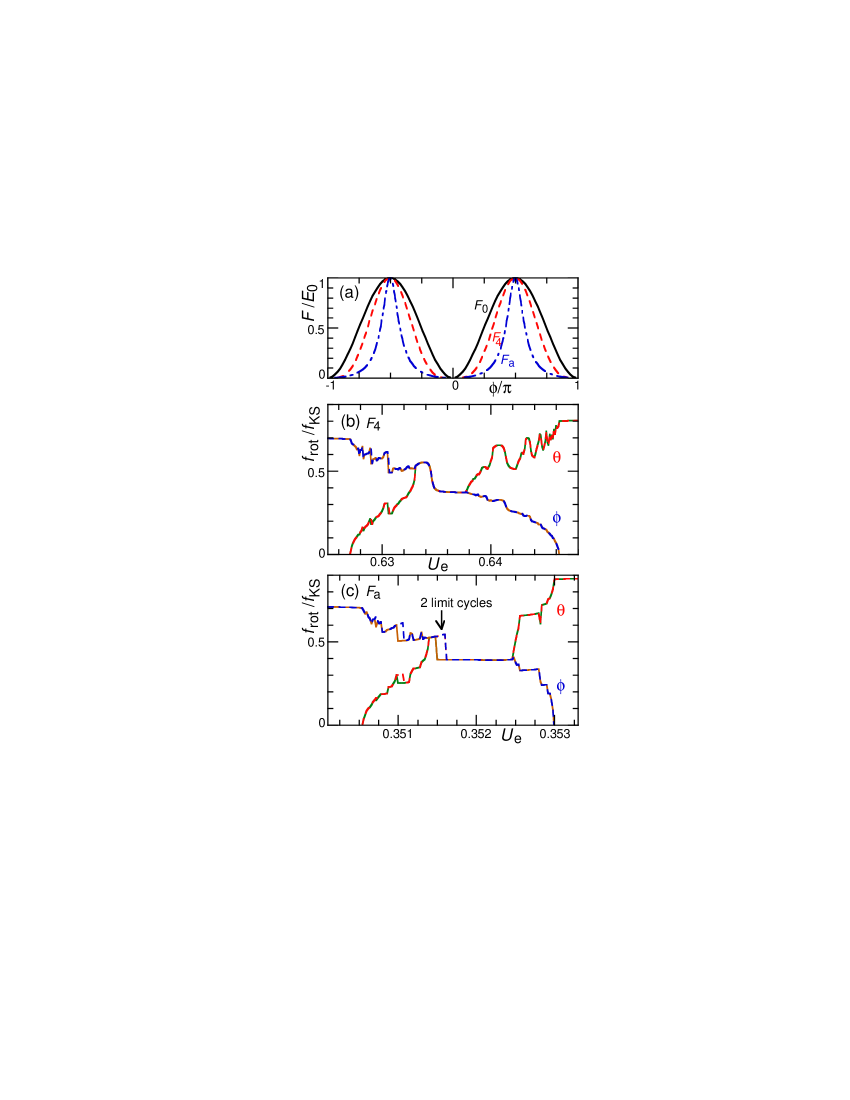
We compared the dynamics of RBCs with the fixed and deformable shapes in the previous section. The fixation of the RBC shape can be interpreted as the bending rigidity , or with . This difference of the potential functions in does not change the dynamics greatly. In this section, we investigate the dependence on the potential functions in . For fixed-shape capsules, we compare the dynamics with three potential functions: , , and ; see Fig. 11(a). The angle is the rotational angle , where is the position of a tracer on the membrane. The phase angle is defined as . The angle can be defined without assuming an ellipsoidal shape. The potential has the sharpest peak.
As the peak of potentials (, , ) sharpens, the transition shear rates and increase ( decreases), since the maximum forces increases at constant . Two limit cycles of the synchronized rotations can coexist for and , while no coexistence is observed for . The capsules approach different limit cycles with increasing and decreasing . For the synchronized rotations with , a steeper but continuous change appears in the curve for than for , and a discrete change with hysteresis appears for ; compare Figs. 2(a) and Figs. 11(b), (c).
The coexistence of two synchronized rotations occurs for the deformable RBCs with the free energy . The shape parameter and steeply change at during TT motion, as shown in Fig. 12. The oscillations of and do not approach sinusoidal curves, unlike the case for ; compare Figs. 8(c) and 12(b). In the TT and TB phases, the averages and amplitudes of the angles and do not show significant differences between the potential shapes in (, , and ), and in (fixed or deformable shape); see Figs. 9 and 10.
V Discussion
Let us compare our results with the experimental results Abkarian et al. (2007). The TT-TB transition is observed at for in Ref. Abkarian et al. (2007). It is in good agreement with our results, and with and and with . Abkarian et al. also reported the dependences in the TT phase, () and the SW amplitude . We also obtained these dependences for all types of potentials; see Figs. 7(a) and 9(c). Most of the dynamics in our calculations are qualitatively independent of the potential shapes, and the quantitative differences are smaller than the distribution widths of the experimental data. In the experiments, the transition shear rate and the other quantities have wide distributions because of the polydispersity of RBCs. RBCs become smaller and more viscous with age Tran-Son-Tay et al. (1984); Nash and Meiselman (1983). The viscoelasticity of the RBC membrane is changed by some diseases such as diabetes mellitus Tsukada et al. (2001). Further experimental and simulation studies are needed to tune up the RBC potential in our theoretical model.
In experiments, it is difficult to distinguish the intermittent rotations from transient rotations Abkarian et al. (2007). The intermittency has not yet been obtained by numerical simulations Kessler et al. (2008); Sui et al. (2008). The synchronized rotations, in particular with , would be much easier to observe in experiments and simulations. Kessler et al. Kessler et al. (2008) argued that the intermittent phase might be an artifact of the theory, since they did not obtain it in their simulations. In our study, however, the modifications of the theory do not qualitatively change the phase diagram. The Devil’s staircase is the general dynamics on a torus (two-dimensional plane with periodic boundary condition). We believe that the intermittent and synchronized rotations occur at higher than their simulated values.
Interestingly, for TT motion slightly above , the angle oscillates crossing ; see Figs. 7(c). Fluid vesicles also show SW oscillation of the vesicle shape and around between the TT and TB phases by a different mechanism, where the shrinkage of the vesicles at induces a change of the dynamic mode from TB () to TT () in the generalized KS theory Noguchi and Gompper (2007). Previously, we distinguished that in the SW oscillation of the elastic capsules, is always positive and the shape deformation is negligibly small, while in SW of fluid vesicles, changes its sign and the shape shows large deformation. However, we know now that the condition for is not always true. The clear difference is the dependence on or . SW induced by the shape deformation appears only in a narrow range of the viscosity, whereas SW induced by the membrane shear elasticity appears at a wide range of the viscosities with no lower viscosity limit. In the future, it will be interesting to investigate the coupling of different oscillation mechanisms in elastic capsules.
VI Summary
In summary, we described the dynamics of RBCs in simple shear flow using a simple theory. The phase diagram of RBCs is divided into three regions: tank-treading, tumbling, and intermediate regions. In the intermediate regions, RBCs exhibit intermittent or synchronized rotations of the inclination angle and phase angle . Synchronized rotations, in particular with , would be much easier to experimentally observe than intermittent rotations. In the TT (TB) phase, the shape and () oscillate with the frequency of () rotation. The coexistence of two synchronized rotations can appear when the potential function of has a sharp peak. The other dynamic properties are not sensitive to the function shape of the free-energy potential. We focused on the dynamics of RBCs in this paper, but the resulting dynamics would be generally applicable to other elastic capsules.
Acknowledgements.
We would like to thank G. Gompper (Jülich) for the helpful discussion. This study is partially supported by a Grant-in-Aid for Scientific Research on Priority Area “Soft Matter Physics” from the Ministry of Education, Culture, Sports, Science, and Technology of Japan.References
- Vitkova et al. (2004) V. Vitkova, M. Mader, and T. Podgorski, Europhys. Lett. 68, 398 (2004).
- Fung (1997) Y. C. Fung, Biomechanics: circulation (Springer, New York, 1997), 2nd ed.
- Fung (2004) Y. C. Fung, Biomechanics: mechanical properties of living tissues (Springer, Berlin, 2004), 2nd ed.
- Skalak (1969) R. Skalak, Science 164, 717 (1969).
- Gaehtgens et al. (1980) P. Gaehtgens, C. Dhrssen, and K. H. Albrecht, Blood Cells 6, 799 (1980).
- Noguchi and Gompper (2005a) H. Noguchi and G. Gompper, Proc. Natl. Acad. Sci. USA 102, 14159 (2005a).
- McWhirter et al. (2009) J. L. McWhirter, H. Noguchi, and G. Gompper, Proc. Natl. Acad. Sci. USA 106, 6039 (2009).
- Pozrikidis (2005) C. Pozrikidis, Phys. Fluids 17, 031503 (2005).
- Lefebre et al. (2008) Y. Lefebre, E. Leclerc, D. Barthès-Biesel, J. Walter, and F. Edwards-Lévy, Phys. Fluids 20, 123102 (2008).
- Noguchi and Gompper (2004) H. Noguchi and G. Gompper, Phys. Rev. Lett. 93, 258102 (2004).
- Noguchi and Gompper (2005b) H. Noguchi and G. Gompper, Phys. Rev. E 72, 011901 (2005b).
- Noguchi (2009) H. Noguchi, J. Phys. Soc. Jpn. 78, 041007 (2009).
- Kantsler et al. (2007) V. Kantsler, E. Segre, and V. Steinberg, Phys. Rev. Lett. 99, 178102 (2007).
- Turitsyn and Vergeles (2008) K. S. Turitsyn and S. S. Vergeles, Phys. Rev. Lett. 100, 028103 (2008).
- Walter et al. (2001) A. Walter, H. Rehage, and H. Leonhard, Colloids Surf. A 183, 123 (2001).
- Finken and Seifert (2006) R. Finken and U. Seifert, J. Phys. Condens. Matter 18, L185 (2006).
- Tran-Son-Tay et al. (1984) R. Tran-Son-Tay, S. P. Sutera, and P. R. Rao, Biophys. J. 46, 65 (1984).
- Nash and Meiselman (1983) G. B. Nash and H. J. Meiselman, Biophys. J. 43, 63 (1983).
- Tsukada et al. (2001) K. Tsukada, E. Sekizuka, C. Oshio, and H. Minamitani, Microvasc. Res. 61, 231 (2001).
- Higgins et al. (2007) J. M. Higgins, D. T. Eddington, S. N. Bhatia, and L. Mahadevan, Proc. Natl. Acad. Sci. USA 104, 20496 (2007).
- Keller and Skalak (1982) S. R. Keller and R. Skalak, J. Fluid Mech. 120, 27 (1982).
- Beaucourt et al. (2004) J. Beaucourt, F. Rioual, T. Séon, T. Biben, and C. Misbah, Phys. Rev. E 69, 011906 (2004).
- Mader et al. (2006) M. A. Mader, V. Vitkova, M. Abkarian, A. Viallat, and T. Podgorski, Eur. Phys. J. E 19, 389 (2006).
- Kantsler and Steinberg (2006) V. Kantsler and V. Steinberg, Phys. Rev. Lett. 96, 036001 (2006).
- Chang and Olbricht (1993) K. S. Chang and W. L. Olbricht, J. Fluid Mech. 250, 609 (1993).
- Abkarian et al. (2007) M. Abkarian, M. Faivre, and A. Viallat, Phys. Rev. Lett. 98, 188302 (2007).
- Goldsmith and Marlow (1972) H. L. Goldsmith and J. Marlow, Proc. R. Soc. Lond. B 182, 351 (1972).
- Skotheim and Secomb (2007) J. M. Skotheim and T. W. Secomb, Phys. Rev. Lett. 98, 078301 (2007).
- Kessler et al. (2008) S. Kessler, R. Finken, and U. Seifert, J. Fluid Mech. 605, 207 (2008).
- Sui et al. (2008) Y. Sui, H. T. Low, Y. T. Chew, and P. Roy, Phys. Rev. E 77, 016310 (2008).
- Noguchi and Gompper (2007) H. Noguchi and G. Gompper, Phys. Rev. Lett. 98, 128103 (2007).
- Misbah (2006) C. Misbah, Phys. Rev. Lett. 96, 028104 (2006).
- Lebedev et al. (2007) V. V. Lebedev, K. S. Turitsyn, and S. S. Vergeles, Phys. Rev. Lett. 99, 218101 (2007).
- Lebedev et al. (2008) V. V. Lebedev, K. S. Turitsyn, and S. S. Vergeles, New. J. Phys. 10, 043044 (2008).
- Navot (1998) Y. Navot, Phys. Fluids 10, 1819 (1998).
- Ramanujan and Pozrikidis (1998) S. Ramanujan and C. Pozrikidis, J. Fluid Mech. 361, 117 (1998).
- Mohandas and Evans (1994) N. Mohandas and E. Evans, Annu. Rev. Biophys. Biomol. Struct. 23, 787 (1994).
- Dao et al. (2006) M. Dao, J. Li, and S. Suresh, Mater. Sci. Eng. C 26, 1232 (2006).
- Jeffery (1922) G. B. Jeffery, Proc. R. Soc. London Ser. A 102, 161 (1922).
- Fischer (2004) T. M. Fischer, Biophys. J. 86, 3304 (2004).
- Bergé et al. (1984) P. Bergé, Y. Pomeau, and C. Vidal, Order within chaos: towards a deterministic approach to turbulence (Wiley, New York, 1984).
- Seifert (1999) U. Seifert, Eur. Phys. J. B 8, 405 (1999).
- Mills et al. (2004) J. P. Mills, L. Qie, M. Dao, C. T. Lim, and S. Suresh, Mech. Chem. Biosys. 1, 169 (2004).
- Dupin et al. (2007) M. M. Dupin, I. Halliday, C. M. Care, L. Alboul, and L. L. Munn, Phys. Rev. E 75, 066707 (2007).
- Vaziri and Gopinath (2008) A. Vaziri and A. Gopinath, Nat. Mater. 7, 15 (2008).
- Secomb and Skalak (1982) T. W. Secomb and R. Skalak, Q. J. Mech. Appl. Math. 35(2), 233 (1982).