An ultracompact X-ray binary in the globular cluster NGC 18511
Abstract
We present far-ultraviolet photometry obtained with the Hubble Space Telescope of the low-mass X-ray binary 4U 0513-40 in the globular cluster NGC 1851. Our observations reveal a clear, roughly sinusoidal periodic signal with min and amplitude 3%-10%. The signal appears fully coherent and can be modelled as a simple reprocessing effect associated with the changing projected area presented by the irradiated face of a white dwarf donor star in the system. All of these properties suggest that the signal we have detected is orbital in nature, thus confirming 4U 0513-40 as an ultracompact X-ray binary (UCXB). All four confirmed UCXBs in globular clusters have orbital periods below 30 minutes, whereas almost all UCXBs in the Galactic field have orbital periods longer than this. This suggests that the dynamical formation processes dominate UCXB production in clusters, producing a different orbital period distribution than observed among field UCXBs. Based on the likely system parameters, we show that 4U 0513-40 should be a strong gravitational wave source and may be detectable by LISA over the course of a multi-year mission.
1 Introduction
It has been known for several decades that bright low-mass X-ray binaries (LMXBs) are times overabundant in Globular clusters (GCs) relative to the Galactic field (Katz 1975; Clark 1975). More specifically, GCs contain 13 of the bright Galactic LMXBs, but only 0.01% of the total stellar mass content of the Galaxy. The reason for this is thought to be the existence of dynamical LMXB formation channels, which are only available in dense GC cores. Potential channels include the direct collision of a neutron star (NS) with a red giants (Verbunt 1987, Davies et al. 1992, Ivanova et al. 2005), the tidal capture of a main sequence star by a NS (Fabian, Pringle & Rees 1975; Bailyn & Grindlay 1987) and exchange interactions between NSs and primordial binaries (Hilles 1976; Rasio et al. 2000).
If the dominant LMXB formation channels are different in GCs and the Galactic field, the properties of their respective LMXB populations may also be different. In particular, most of the bright LMXBs in GCs might be ultracompact X-ray binaries (UCXBs; Bildsten & Deloye 2004, Ivanova et al. 2005). UCXBs, which are interacting binaries with extremely small binary separations ( cm) and short orbital periods ( 1 hr), appear to be rare amongst the Galactic field LMXB population: the list of confirmed UCXBs (with measured ) in in’t Zand et al. (2007) contains only 5 objects that belong to this population. By contrast, 3 of the 13 GC LMXBs are confirmed UCXBs; these are 4U 1820-30 in NGC 6624 ( min, Stella et al. 1987), 4U 1850-087 in NGC 6712 ( min, Homer et al. 1996) and CXO J212958.1+121002 in M 15 (=M15-X2; Dieball et al. 2005), with several more suggested to be ultracompact X-ray binaries on the basis of more indirect evidence (see e.g. Verbunt & Lewin 2006 for a review).
Since the period distribution of GC LMXBs may be a direct tracer of the dynamical close encounters taking place in GC cores, it is important to establish orbital periods for as many of these sources as possible. Doing so could also lead to a significant increase in the size of the total UCXB sample. This is desirable, because UCXBs are astrophysically important systems in their own right. This is because they are laboratories for accretion and binary evolution in extreme settings, and because they are strong gravitational wave sources that may be detectable by LISA (Nelemans & Jonker 2006; Nelemans 2009).
Here, we present time-resolved, far-UV photometry of the LMXB 4U 0513-40 in NGC 1851, which was suspected to be a UCXB based on several strands of circumstantial evidence (Deutsch etal 2000; Verbunt 2005; Nelemans & Jonker 2006; in’t Zand etal. 2007). Our far-UV data of this system contain a 17 min periodic signal that is present in all four observing epochs, is consistent with being coherent and is probably caused by a reflection effect associated with the irradiated surface of the donor star in this system. Based on all this, we argue that the observed periodic variability is an orbital signature, and thus that 4U 0513-40 should be regarded as a confirmed UCXB with min.
2 Observations and data reduction
NGC 1851 was observed three times with the F140LP filter in the Solar Blind Channel (SBC) of the Advanced Camera for Surveys (ACS) on board the HST. This instrument/detector/filter combination has a plate scale of 0.032″ pixel-1, a pivot wavelength of Å, and an rms bandwidth of Å. All of the observations took place in August of 2006. Each observing epoch consisted of 4 HST orbits, broken up into a series of 90 second exposures. In total, we obtained 273 of these exposures. In addition, we also examined archival data taken in March of 1999 with the Space Telescope Imaging Spectrograph (STIS), using the FUV-MAMA/F25QTZ detector/filter combination, with a plate scale of 0.025″ pixel-1, Åand Å.
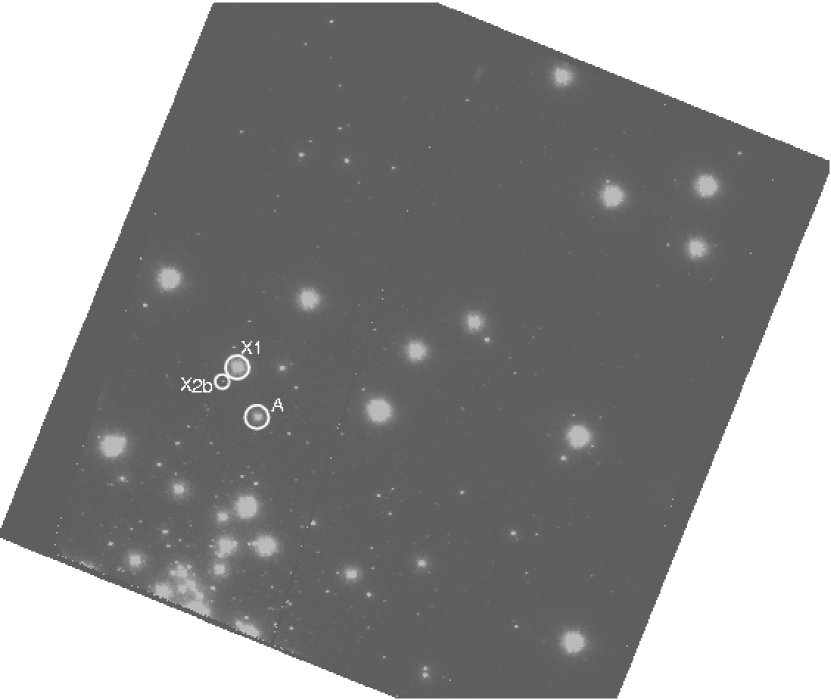
A full description of the data, as well as their reduction and analysis will be provided in a separate publication (Zurek et al. 2009, in preparation). Briefly, all of the FUV count rates and magnitudes presented in this paper were calculated via standard aperture photometry techniques, as implemented in the daophot package within IRAF111IRAF (Image Reduction and Analysis Facility) is distributed by the National Astronomy and Optical Observatories, which are operated by AURA, Inc., under cooperative agreement with the National Science Foundation.. For the photometry on our ACS/SBC (STIS/FUV-MAMA) images, we used an aperture radius of 4 (7) pixels and a sky annulus extending from 10 to 20 (15 to 35) pixels. Aperture photometry is sufficient for our purposes because the FUV image is not particularly crowded (see Figure 1).
The wavelength-dependent throughput curves of the ACS/SBC/F140LP and STIS/FUV-MAMA/F25QTZ instrument/detector/filter combinations are very similar, though not identical. Therefore we checked for far-UV variability by comparing the ACS and STIS count rates, after correcting for throughput differences and the different photometric aperture sizes and background regions that were used. We have calculated this correction factor from a set of (mostly blue horizontal branch) stars that are common to both sets of images. We find that for these stars, our ACS/SBC count rates are 3.3 times larger than our STIS/F25QTZ ones.
3 Analysis and Discussion
Homer et al. (2001) have already used the HST/STIS/F25QTZ observations to identify the optical/far-UV counterpart of 4U 0513-40. They confirm the suggestion of Deutsch et al. (2000) that “Star A” (in the nomenclature of Deutsch et al.) is the correct counterpart to the LMXB, while two other blue sources previously suggested as possible counterparts by Auriére, Bonnet-Bidaud & Koch-Miramond (1994), designated as X-1 and X-2b, are inconsistent with the precise Chandra position of 4U 0513-40. Figure 1 shows the location of these 3 sources in our ACS/SBC images.
Since Homer et al. (2001) had already reported a negative search for far-UV variability associated with Star A in the STIS observations, we started by focusing on the newer, higher signal-to-noise ACS data. The ACS-based far-UV light curves of all 3 objects are shown in Figure 2. It is immediately obvious that Star A, the counterpart proposed by Deutsch et al. (2000) and Homer et al. (2001), does, in fact, exhibit strong far-UV variability, especially between the 3 observing epochs. For example, the mean count rate drops by a factor of about 2 between epochs 2 and 3. No similar change in count rate is seen in either X-1 or X-2b, which bracket Star A in far-UV brightness.
We then searched for periodic signals in the data by carrying out a power spectral analysis. Figure 3 shows the Lomb-Scargle power spectra calculated for all 3 sources from the combined ACS data sets. It is immediately obvious that only Star A shows clear evidence of a signal at a frequency other than HST’s orbital frequency (). More specifically, there is an obvious peak at a frequency of about c d-1 (which corresponds to a period of min).
In an effort to better understand the Star A power spectrum (specifically the power excess at and the sidebands at ), we have created a simple model light curve. This model has exactly the same time sampling as the observations, contains a single 17-min periodic signal with amplitude 0.75 c s-1 and accounts for the dominant long-term trend in the data by setting the simulated mean count rate in each epoch equal to the observed one. The power spectrum generated from this simple noise free model is shown in the second panel of Figure 3 (labelled “Star A Simulation”), and clearly captures all of the main features of the data. This shows that both the sidebands around and the strong apparent signal at are sampling artifacts. The latter, in particular, is due to leakage from the low-frequency power excess associated with the long-term variability.
In order to test if the 17 min signal is persistent, we carried out power spectral analysis on each epoch independently, where we now also included the STIS data that was obtained 7 years before the ACS observations. The result is shown in Figure 4. The periodicity was indeed present in all 4 epochs (1 STIS + 3 ACS), but was noticeably weaker in the STIS data and in the third ACS epoch. Considered in isolation, the power excess at in each of those epochs would be marginally significant at best.
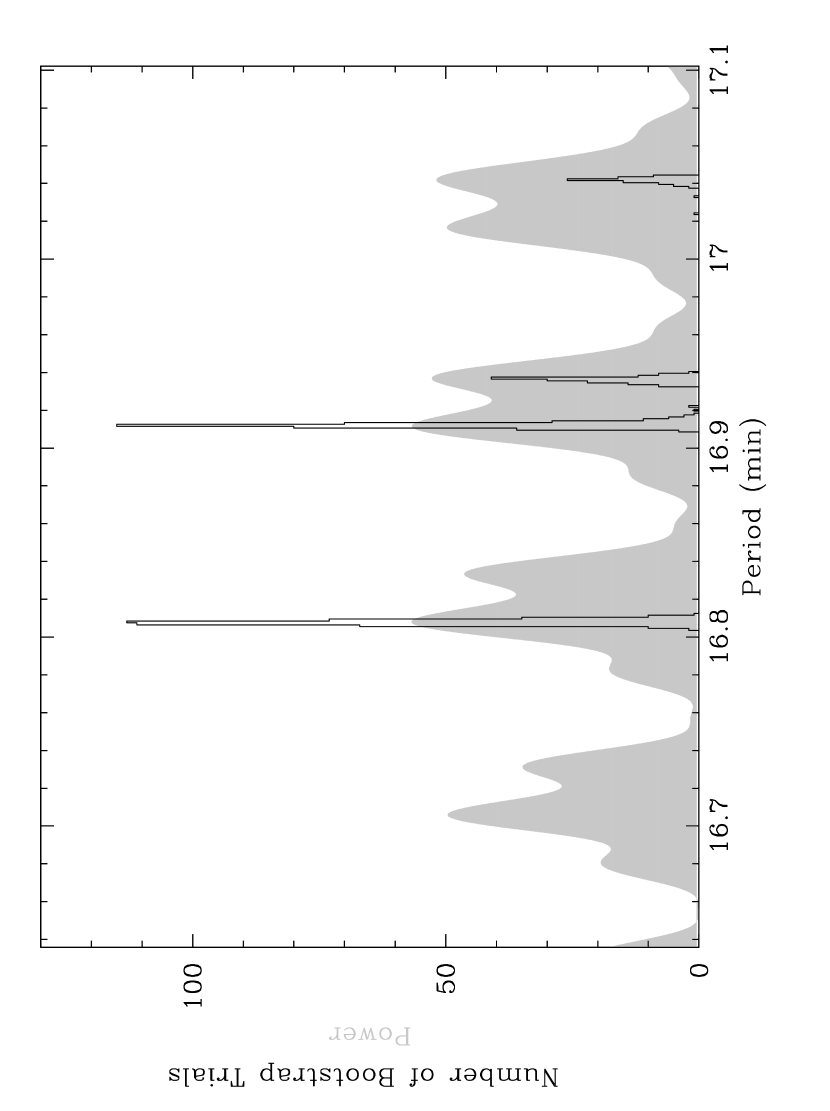
Both Figures 3 and 4 show that there are several possible aliases associated with the 17 min signal. In order to establish the relative likelihoods for each of these and get estimates of the errors associated with each of them, we carried out a bootstrap analysis. Only the ACS data was used for this purpose, since the signal is weakest in the STIS data and since no unique cycle count can be assigned to the large time interval between the STIS and ACS observations. We began by removing long-term trends from the data stream by estimating the mean count rate in each HST orbit and subtracting these averages from the data. Next, we created 1000 mock time series by sampling with replacement from the orbit-mean-subtracted ACS data. Finally, we created power spectra for all of these fake data sets and recorded the frequencies corresponding to peak flux. The histogram created from this set of peak frequencies is shown in Figure 5 (superposed on the orbit-mean subtracted power spectrum for all of the data, which is shown as the shaded region). As expected from the power spectrum, there are clearly four dominant plausible aliases. The relative number of bootstrap trials associated with each alias is a measure of the likelihood that this alias is the correct one (see Southworth et al 2006, 2007, 2008 and Dillon et al. 2008). Similarly, the location and width of the histogram peak associated with each alias provides a simple estimate of the period and period error for this alias. Our final results for the four viable aliases are:
| (1) | |||
| (2) | |||
| (3) | |||
| (4) |
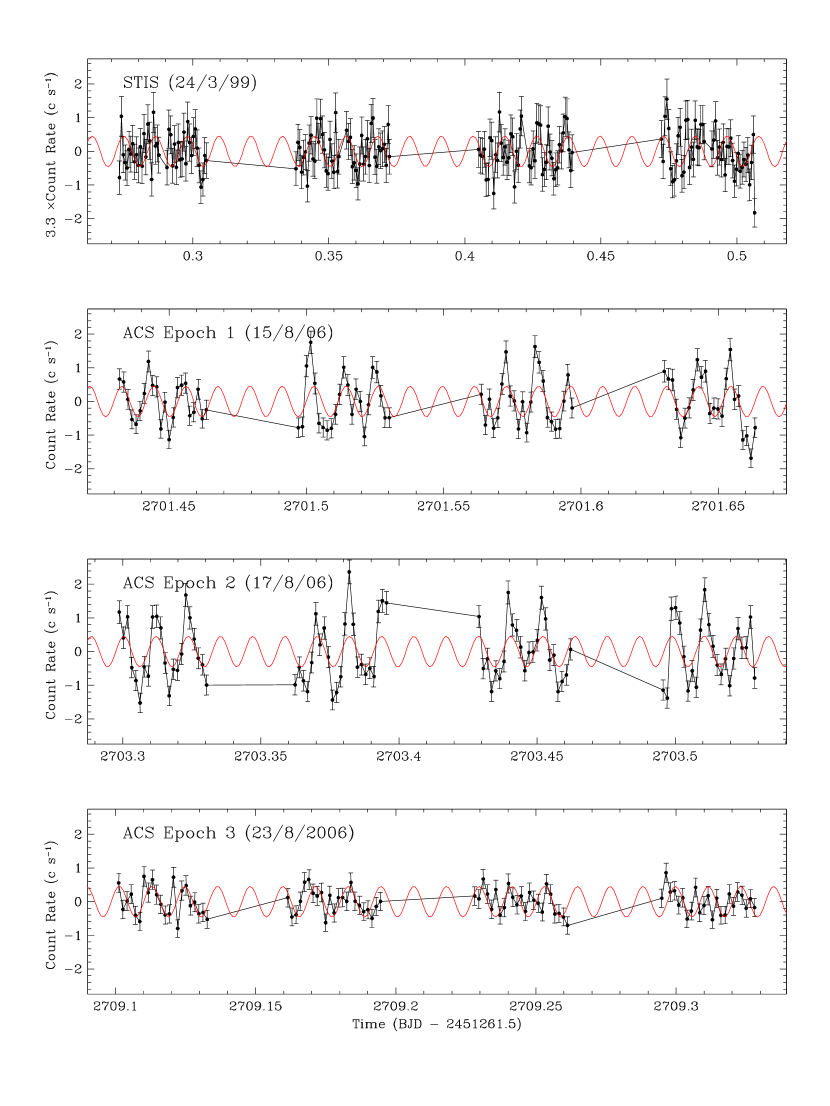
We also tried to establish more directly whether the periodic signal is consistent with being coherent across all of our epochs and whether the evidence for a changing amplitude is compelling. To this end, we carried out a least-squares fit to the orbit-mean-subtracted STIS+ACS data set for Star A. In this fit, the period was kept fixed at 222In fact, the period was fixed to be one of the many sub-aliases of that are present in the power spectrum of the combined STIS+ACS data., so the free parameters were the phase and amplitude (both assumed to be constant across the data). The result of this fit is shown in Figure 6. It illustrates rather clearly that the amplitude is not constant across epochs. As already noted above, the signal is strongest in ACS epochs 1 and 2 and weakest in the STIS data and ACS epoch 3. The fit also shows that the assumption of constant phase is reasonable, i.e. the observed signal is consistent with being coherent across the entire data set.
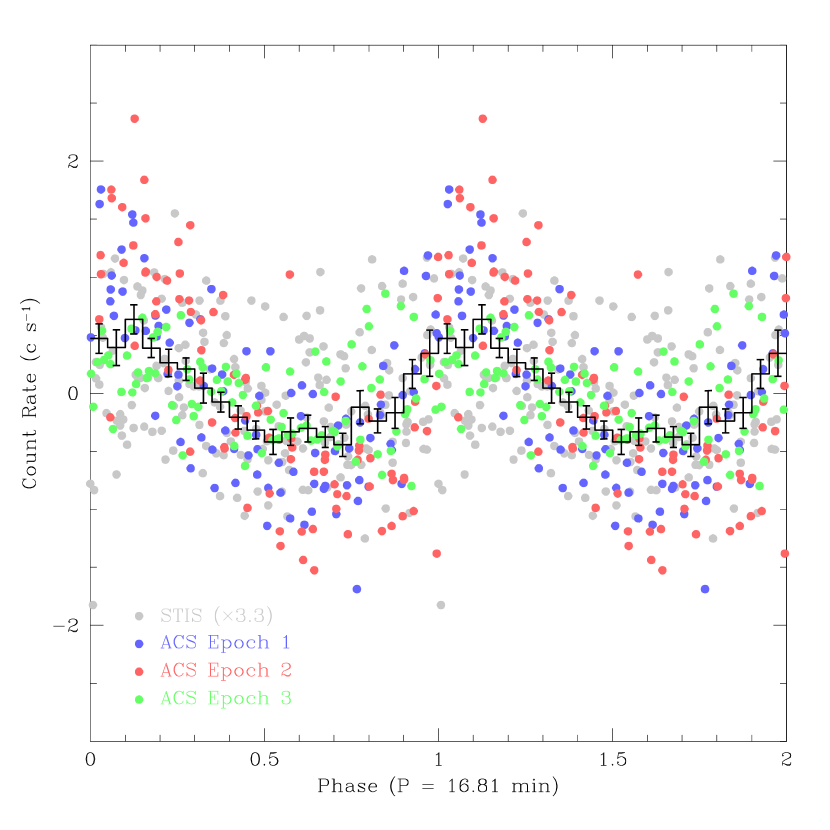
In order both to test further the coherence properties of the signal, and to determine its average waveform, we have folded the entire STIS+ACS data stream for Star A onto the same (sub-)alias that was adopted for the fit in Figure 6. The result is shown in Figure 7, along with the phase-binned average waveform. Again, the data seem to be consistent with the idea that the signal is fully coherent. Moreover, the average waveform is fairly simple and roughly sinusoidal.
As a final step, we carried out separate fits with fixed period to each individual epoch in order to quantify the changing amplitude of the 17-min signal. Table 1 lists the mean count rates and absolute as well as fractional amplitudes of the signal as estimated from these fits. The fractional amplitude varies by over a factor of 3 between epochs, from about 3% to 10%, with the largest change happening across the 6-day gap between ACS epochs 2 and 3. It is also worth noting that there appears to be a correlation between the FUV brightness of the system (i.e. the mean count rate) and the amplitude of the 17-min signal, in the sense that the amplitude is highest when the system is brightest. This correlation holds regardless of whether the amplitude is expressed in absolute or fractional terms.
It is worth noting that there is no inconsistency between our claim that the 17-min signal is present in the STIS observations, and the non-detection of a periodicity in the same data set by Homer et al. (2001). As mentioned above, the signal is only marginally detectable if this data set is analysed in isolation. What makes the weak power excess in the STIS observations convincing is that it is located at the same frequency as the obvious signal in the ACS data set. Indeed, Homer et al. (2001) place a formal upper limit of 5% on the amplitude of any signal between 5 min and 6 hrs. This is entirely consistent with our own estimate of a 4% amplitude for the 17 min signal in the STIS data (see Table 1).
4 Discussion
We have shown that the FUV counterpart to 4U 0513-40 in NGC 1851 exhibits a clear periodic signal with min. This signal is roughly sinusoidal, has an amplitude of 3%-10%, is present in all four FUV observing epochs and is consistent with being fully coherent. These properties are in line with those of the orbital signals seen in UV/optical observations of other UCXB (e.g. Homer et al. 1996; Anderson et al. 1997; Dieball et al. 2005) and with a simple model in which these signals are due to a “reflection effect” associated with the irradiated donor star in the system (Arons & King 1993).333The term “reflection effect” is actually somewhat misleading, since the UV/optical light from the irradiated face is due to reprocessing, not reflection. Our use of the term here reflects standard usage in the close binary literature.
In the Arons & King (1993) model, there are two components that contribute to the FUV/optical light: the irradiated front face of the donor star (which is likely to be a low-mass, Helium-core white dwarf), and the accretion disk, whose energy budget is also dominated by irradiation. The observed orbital signal is due to the changing projected area of the irradiated face of the donor star, with the fractional amplitude being set by the relative contributions of the disk and donor to the phase-averaged FUV/optical light. We have checked that this simple irradiation model matches roughly the fractional FUV signal using reasonable choices of parameters (including a moderate-to-high inclination). The dependence on total FUV brightness is explained straightforwardly by different FUV responses of the donor and disk to variations in the irradiating X-ray luminosity. In this context, a factor of 2 change in total FUV and fractional amplitude would requires roughly an order of magnitude variation in . This is consistent with the x-ray variability of the source in the RXTE data base, where factor of 10 changes in count rate are seen on time-scales as short as weeks. For comparison, the largest previously reported variations in X-ray luminosity from this source were a factor of 5 (Grindlay & Hertz 1983). It seems likely that additional effects such as changes in radius, changes in reprocessing efficiency, and disk shielding, play a significant role in the variations of the amplitude of the UV oscillations.
Based on all this, we are confident that the FUV signal we have discovered is orbital in nature and probably due to a simple reflection effect. We therefore confirm 4U 0513-40 as a UCXB with min, making it the fourth confirmed UCXB in a Galactic GC. The identification of this system as a UCXB is entirely consistent with existing circumstantial evidence regarding its nature. More specifically, the optical brightness, X-ray spectrum and burst properties of 4U 0513-40 have been known for some time to point towards a UCXB classification (e.g. Verbunt 2005).
Given the extremely short orbital period we have measured, it is interesting to ask if the gravitational wave signal produced by this source would be detectable by LISA. The gravitational radiation strain for a circular orbit is given in a convenient form by Nelemans, Yungelson & Portegies Zwart (2001) as:
| (5) |
where , is the mass of the neutron star primary, and is the mass of the white dwarf donor, and with the power coming out entirely in the second harmonic, for a circular orbit. If we adopt , kpc (Harris 1996) and (suggested for this by the mass-radius relations in Deloye & Bildsten [2003]), we find a strain of . This is at approximately the 1- level for a one year integration with LISA, suggesting that the system may be detectable if the mission lifetime is several years. In practice, this will, however, also depend on the strength and frequency-dependence of the gravitational-wave background due to double WDs, which may become dominant in the relevant frequency regime ( mHz; e.g. Nelemans et al. 2001). An additional challenge for detecting gravitational radiation from this object will be dealing with the possible effects of acceleration of the binary in the gravitational potential of the globular cluster, which could lead to a measurable frequency drift over several years, for which a correction would have to be made in order to keep all the gravitational wave power in a single frequency bin. The fact that the position and period of the source are already known (and the latter can still be substantially improved before LISA starts) will be helpful in this context and also ameliorate the hidden trials problem.
We finally point out that, as more UCXB periods are being determined, it seems increasingly likely that there are significant differences between the period distributions of field and GC UCXBs. All four of the confirmed GC UCXBs have min, whereas all five of the confirmed field UCXBs have min (Nelemans & Jonker 2006; in’t Zand, Jonker & Markwardt 2007). Clearly, this comparison cannot yet be taken at face value: the present numbers are still too small and selection effects have not been taken into account. Moreover, there is probably no absolute dividing line between the two orbital period distributions. For example, the field LMXB 4U 1543-624 probably has an orbital period of around 18 minutes (Wang & Chakrabarty 2004), even though it is not yet included in the list of confirmed UCXBs given by Nelemans & Jonker (2006) and in’t Zand et al. (2007). Nevertheless, the period distributions are in line with the expectation that different UCXB formation channels should dominate in the two different environments. If so, it may be possible to use the period distribution of field UCXBs as a tracer of binary evolution, and that of GC UCXBs as a tracer of stellar dynamics in dense environments.
References
- (1) Arons, J. & King, I. R. 1993, ApJ, 413, L121
- (2) Aurière, M., Le Fèvre, O. & Terzan, A. 1984, A&A, 138, 415
- (3) Bailyn, C. D. & Grindlay, J. E. 1987, ApJ, 316, L25
- (4) Bildsten, L. & Deloye, C. J. 2004, ApJ, 607, L119
- (5) Clark, G. W. 1975, ApJ, 199, L143
- (6) Davies, M. B., Benz, W. & Hills, J. G. 1992, ApJ, 401, 246
- (7) Deutsch, E. W., Margon, B., & Anderson, S. F. 2000, ApJ, 530, L21
- (8) Dieball A., Knigge C., Zurek D.R., Shara M.M., Long K.S., Charles P.A., Hannikainen D.C., van Zyl L., 2005, ApJ, 634, L105
- (9) Dillon, M., Gansicke, B.T., Augwerojwit, A., Rodriguez-Gil, P., Marsh, T.R., Barros, S.C.C., Szkody, P., Brady, S., Krajci, T. & Oksanen, A. 2008, MNRAS, 386, 1568
- (10) Fabian A. C., Pringle J. E., Rees M. J., 1975, MNRAS, 172, 15P
- (11) Harris, W.E. 1996, AJ, 112, 1487
- (12) Hills J.G., 1976, MNRAS, 175P, 1
- (13) Homer, L., Charles, P. A., Naylor, T. et al. 1996, MNRAS, 282, L37
- (14) Homer L., Anderson S.F., Margon B., Deutsch E.W., Downes R.A., 2001, ApJ, 550, L155
- (15) Homer, L. 2003, KITP Workshop: “The Physics of Ultracompact Stellar Binaries” (Feb 1-2, 2003), Coordinators: L. Bildsten, D. Chakrabarty, G. Nelemans, http://online.itp.ucsb.edu/online/ultra_c03/homer
- (16) in’t Zand J. J. M., Jonker P. G., Markwardt C. B., 2007, A&A, 465, 953
- (17) Ivanova, N., Rasio, F. A., Lombardi, J. C., Dooley, K. L. & Proulx, Z. F. 2005, ApJ, 621, L109
- (18) Katz, J. I. 1975, Nature, 253, 698
- Nelemans (2009) Nelemans, G. 2009, arXiv:0901.1778
- (20) Nelemans G., Jonker P. G., 2006, astro, arXiv:astro-ph/0605722
- (21) Rasio, F. A., Pfahl, E. D. & Rappaport S. 2000, ApJ, 532, L47
- (22) Stella, L., Priedhorsky, W., & White, N. E. 1987, ApJ, 312, L17
- (23) Southworth, J., Gansicke, B.T., Marsh, T.R., de Martino, D., Hakala, P., Littlefair, S., Rodriguez-Gil, P. & Szkody, P. 2006, MNRAS, 373, 687
- (24) Southworth, J., Marsh, T.R., Gansicke, B.T., Augwerojwit, A., Hakala, P., de Martino, D. & Lehto, H. 2007, MNRAS, 382, 1145
- (25) Southworth, J., Gansicke, B.T., Marsh, T.R., Torres, M.A..P., Steeghs, D., Hakala, P., Copperwheat, C.M., Aungwerojwit, A., & Mukadam, A. 2008, MNRAS, 391, 591
- (26) Verbunt, F. 1987, ApJ, 312, L23
- (27) Verbunt F., 2005, in “Interacting Binaries: Accretion, Evolution, and Outcomes, AIP Conference Proceedings, AIP Conference Series, 797, 30
- (28) Verbunt F., Lewin W.H.G., 2006, in Compact Stellar X-ray Sources, Cambridge University Press: Cambridge, UK (W.Lewin, M. van der Klis eds.)
| Epoch | Mean Count Rate | Absolute Amplitude | Fractional Amplitude |
|---|---|---|---|
| STIS | |||
| ACS1 | |||
| ACS2 | |||
| ACS3 |