Possible magnetic field variability during the 6.7 GHz methanol maser flares of G09.62+0.20
Abstract
Context. Polarization of maser emission contains unique information on the magnetic field in the densest regions of massive star formation.
Aims. Recently, the magnetic field induced Zeeman splitting was measured for the strongest known 6.7 GHz methanol maser, which arises in the massive star forming region G09.62+0.20. This maser is one of a handful of periodically flaring methanol masers. Magnetic field measurements can possibly provide insights into the elusive mechanism responsible for this periodicity.
Methods. The 100-m Effelsberg telescope was used to monitor the 6.7 GHz methanol masers of G09.62+0.20, in weekly intervals, for just over a two month period during which one of the maser flares occurred.
Results. With the exception of a two week period during the peak of the maser flare, we measure a constant magnetic field of mG in the two strongest maser components of G09.62+0.20 that are separated by over 200 AU. In the two week period that coincides exactly with the peak of the maser flare of the strongest maser feature, we measure a sharp decrease and possible reversal of the Zeeman splitting.
Conclusions. While the two phenomena are clearly related, the Zeeman splitting decrease only occurs near the flare maximum. Intrinsic magnetic field variability is thus unlikely to be the reason for the maser variability. The exact cause of both variabilities is still unclear, but it could be related to either background amplification of polarized emission or the presence of a massive protostar with a close-by companion. However, the variability of the splitting between the right- and left-circular polarizations could also be caused by non-Zeeman effects related to the radiative transfer of polarized maser emission. In that case we can put limits on the magnetic field orientation and the maser saturation level.
Key Words.:
masers – polarization – magnetic fields – stars: formation – stars: individual: G09.62+0.201 Introduction
Polarization observations of astrophysical masers provide important insights into the magnetic field properties of, among others, the dense regions surrounding massive protostars (e.g. Vlemmings, 2007, and references therein). In these regions, magnetic fields may play an crucial role in, e.g., suppressing fragmentation, altering feedback processes and stabilizing accretion disks. Linear polarization observations of maser emission can reveal the magnetic field morphology, while observations of the circular polarization, generated due to Zeeman splitting, can be used to measure the line-of-sight magnetic field strength. Especially for the non-paramagnetic molecules such as SiO, H2O and methanol, maser polarization also depends on intrinsic maser properties that determine the maser saturation level, such as brightness temperature, beaming angle and the rate of maser stimulated emission. Thus, polarization observations can, in addition to the magnetic field strength and structure, also provide constraints on maser properties that are otherwise hard to determine (e.g. Vlemmings et al., 2006). Circular polarization, or Zeeman splitting observations have been mostly focused on OH and H2O masers (e.g. Hutawarakorn & Cohen, 1999; Sarma et al., 2001; Bartkiewicz et al., 2005; Vlemmings et al., 2006). However, recent observations have revealed significant Zeeman splitting of the 6.7 GHz methanol transition (Vlemmings, 2008, hereafter V08) in a sample of 17 out of 24 of the brightest northern methanol maser sources, indicating an average magnetic field strength in the maser region of mG.
The massive star forming region G09.62+0.20 harbors the strongest known maser at 6.7 GHz. This maser, and its 12.2 GHz counterpart, undergoes periodic flares with a period of 244 days (e.g. Goedhart et al., 2003, 2004). At the height of its flare, the 6.7 GHz maser has been seen to reach a peak flux density of over 7000 Jy beam-1. There is a time-delay of 25 days between the flare in the strongest 6.7 GHz feature (hereafter the main feature) at km s-1and the secondary feature at km s-1, which also displays a different flare profile. The origin of the periodic behavior, however, is still unclear. The G09.62+0.20 star forming region consists of a complex of HII regions in various evolutionary stages. Its 6.7 GHz methanol masers have been mapped with the ATCA by Phillips et al. (1998), and the strongest features are shown to be associated with the hypercompact HII region labeled E by Garay et al. (1993). This region is speculated to be excited by a B0 star (Hofner et al., 1996). VLBA observations of the 12.2 GHz masers during the course of a flare (Goedhart et al., 2005) indicate that the maser regions simply brighten in intensity, with no change in morphology, implying that the cause of the flare arises beyond the maser region. It has been previously speculated that the periodicity could arise from either the background HII region, or an infrared pump source. The monitoring observations presented here were prompted by the detection of a possible magnetic field reversal between the main ( mG) and secondary ( mG) maser features in V08.
2 Observations and error analysis
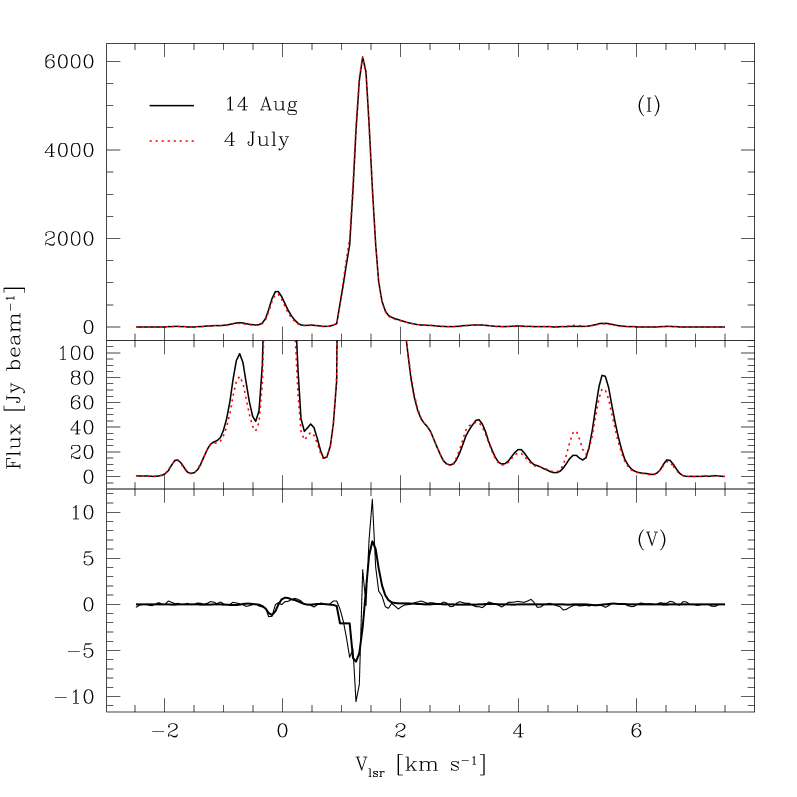
The 6668.519 MHz () methanol maser line of the massive star forming region G09.62+0.20 was monitored weekly over a period of slightly more than 2 months (11 sessions from 2008 June 14 to August 20) using the 5 cm primary focus receiver of the 100-m Effelsberg111The 100-m telescope at Effelsberg is operated by the Max-Planck-Institut für Radioastronomie (MPIfR) on behalf of the Max-Planck-Gesellschaft (MPG) telescope. The observing dates were chosen to encompass the expected flare events of the main and secondary variable maser features. Unfortunately a setup problem made two sessions (June 14 and July 31) unusable. In addition to G09.62+0.20, we observed G23.01-0.41 as a consistency check. As in the previous Effelsberg methanol maser Zeeman splitting observations (V08), the data were taken in position switch mode with a 2 minute cycle time. Data were collected using the fast Fourier transform spectrometer using two spectral windows, corresponding to the right- and left-circular polarizations (RCP and LCP). The spectral windows of MHz were divided in spectral channels, resulting in a km s-1channel spacing and were centered on the local standard of rest (LSR) source velocities. The data were reduced as described in V08, with amplitude calibration performed on 3C286. The spectrum of G09.62+0.20 for two Effelsberg observational epochs is shown in Fig. 1, along with the circular polarization spectrum for one of the epohcs. As seen in the figure, the shape of each maser feature is identical at each epoch. However, the velocity of the maser peak of the main feature shifts similarly in RCP and LCP by up to m s-1. This is likely caused by a delay of the flare of weaker maser features in the wings of the main feature (Goedhart et al., in prep.).
The target sources G09.62+0.20 and G23.01-0.41 were observed for 10 and 6 minutes respectively. Due to changing conditions, the rms noise levels varied over the different monitoring sessions. Additionally, the LCP rms noise level was between 50% and 300% larger than the RCP rms noise level. The LCP rms noise, which varied for the 10 min observations of G09.62+0.20 between 100 and 350 mJy, was thus the limiting factor to our Zeeman splitting determinations. Unfortunately, as the rms noise level was a factor of increased over that in the V08 observations, we were only able to detect significant Zeeman splitting in our consistency check source G23.01-0.41 at 4 of the epochs. Within the errors, these epochs were consistent with the V08 observations.
Synchronous observations of G09.62+0.20, as part of a program to monitor the variable methanol maser sources (Goedhart et al., 2005), were carried out using the 26m telescope at Hartebeesthoek Radio Astronomy Observatory (HartRAO). Full sampling of the flare was not possible due to scheduling constraints. Flux calibrations were done using continuum drift scans across Hydra A and 3C123 and a further check was made using the methanol maser G351.42+0.64 as a comparison source. Comparison with the HartRAO measurements enables us to estimate the absolute flux errors to be less than .

As our observations were aimed at detecting possible small variabilities of the Zeeman splitting, we performed an additional analysis of the channel rms noise in the spectrum of G09.62+0.20. To determine the increase of channel rms noise as a function of maser flux, we used the 5 individual 2 minute scans of two of the epochs to determine the channel rms in those channels that contained significant maser emission. The individual maser spectra were normalized to the peak flux of the combined scans to minimize the effect of intrinsic maser variability. We then calculate for each channel , where is the rms noise value for the emission free channels. Fig. 2 shows as a function of the maser flux in each of the channels with maser emission. We find that for all of the maser features, with one exception, stays approximately constant within a factor of up to a maser flux of Jy beam-1 after which it increases with . During the first epoch, only the maser feature at km s-1did not follow this relation and already deviated from the expected rms noise level when its flux became Jy beam-1. As this did not occur during the last epoch, this is possibly due to weak narrowband interference. Since the noise characteristic is similar for both polarizations and all epochs, the rms error increase is unlikely to be due to receiver saturation and would be unable to cause a systematic shift between RCP and LCP. However, the analysis does imply that the errors on Zeeman splitting determination in V08 should be increased. For the majority of the masers in V08, this increase is less than a factor of . However, for the masers of G09.62+0.20 the errors need to be increased with a factor of and for the main and secondary maser features respectively.
3 Variability of RCP-LCP frequency splitting
3.1 The case of G09.62+0.20

We determined the Zeeman splitting of the two brightest 6.7 GHz methanol maser features of G09.62+0.20 using the RCP-LCP cross-correlation method as described in V08. Fig. 3 shows the line-of-sight magnetic field strength for the two maser features at each epoch as derived from the Zeeman splitting , using km s-1 G-1 as the best estimate for the Zeeman splitting coefficient. In addition to the monitoring epochs, the figure also includes the folded in observations presented in V08. We find that the line-of-sight magnetic field strength in the secondary maser feature is stable during the observations, with an error weighted average magnetic field of mG. In contrast, the Zeeman splitting of the main maser feature sharply decreases at the time the maser flare reaches peak flux. Monitoring at weekly intervals has proven to be too coarse to put strong constraints on the length of the period with decreased . However, while the typical duration of a flare is up to two months, the decrease in Zeeman splitting lasts only for an approximate two week period around the peak of the flare. Determining a error weighted average magnetic field for the main maser feature using the 7 epochs on either side of the two week period with decreased Zeeman splitting, we find mG. Thus, the magnetic field strength is remarkably similar on both masers, even though both features are separated by more than 200 AU (Goedhart et al., 2005).
Fig. 3 thus indicates that, when the flare of the main maser feature reaches its peak flux, the Zeeman splitting decreases significantly and potentially even changes sign. As the observations of V08 that also revealed a much lower (and possibly reversed) were taken close to the peak of the previously flaring period, this behavior appears to repeat itself regularly. No significant Zeeman splitting decrease is seen for the secondary maser feature. The observations with the HartRAO telescope showed that the flare of this feature, while typically approximately 25 days after the flare of the main feature, was much more irregular and reached its peak at approximately the same time as the main feature. However, throughout the Effelsberg observations its flux variations were only while that of the primary feature was over .
3.2 Possible origin of the observed variability
The cause for the sudden decrease in Zeeman splitting during the maser flare is unknown. We can confidently rule out instrumental effects as the reason for the decrease of of the main maser feature for a number of reasons. First of all, no significant corresponding decrease is found for the secondary maser feature at the same epochs. Furthermore, the quite constant Zeeman splitting measured before and after the peak, and the fact that the negative Zeeman splitting was also found during the maser flare 8 months earlier, point to the stability of the instrumental setup as well as the robustness of the data reduction and analysis method.
The observed effect is thus likely intrinsic to the source. The measured decrease in however, starts after the maser flux has already entered the flaring stage. Thus, while the measured Zeeman splitting variation is related to the maser flare, it is unlikely that the flare itself is caused by changes in the magnetic field. Here we describe three possible scenarios that could give rise to the observed effect.
Background amplification: As the observed Zeeman splitting is generated by the average magnetic field throughout the entire maser region, the most straightforward cause of a drop in observed Zeeman splitting is the superposition of two maser regions with opposite magnetic fields. As described in Boboltz et al. (e.g. 1998), maser flares can often be attributed to the chance alignment of maser regions, when a foreground maser amplifies the emission from a background maser. Alternatively, instead of a maser, the background source could be a strongly polarized continuum source. In this case, polarization of the seed emission can cancel out any circular polarization generated within the maser. However, while this simple model also naturally explains the maser flare, the origin of the observed periodicity remains unclear.
Intrinsic magnetic field variability: A second option is that the observations reveal an actual change in the magnetic field within the maser region. Various mechanisms can produce a change in magnetic field. It has been suggested that the periodic maser flares are due to changes in the maser pumping resulting from a binary interaction between a massive protostar and companion (Goedhart et al., 2003). Interactions between the magnetospheres of the two companions could cause periodic behavior of the magnetic field, as has been observed in young low-mass binary systems (e.g. Massi et al., 2008). However, typical magnetic reconnection events do not last long enough to explain the approximate two weeks duration of the magnetic field variability. It is also unclear if the magnetic interaction would be noticeable in the methanol maser region at several hundred AU distance from the protostars. Still, an embedded binary will also give rise to other complex interactions besides that of the magnetic field, such as those between possible accretion disks and outflows. These interaction will be imprinted onto the observed magnetic field. Thus, if the observed magnetic field variability is truly due to intrinsic changes of the magnetic field, any possible explanation of the periodic maser flares will also need to take into account the behavior of the magnetic field.
Maser radiative transfer: Alternatively, we are observing a combination of Zeeman and non-Zeeman effects, competing when the maser is at its brightest. Non-Zeeman effects were briefly discussed in V08. Specifically the effect where the axis of symmetry for the molecular quantum states rotates when the maser saturates, and the rate of stimulated emission becomes larger than the Zeeman frequency shift , bears further investigation. An unfortunate error was introduced in the calculation of presented in V08, with the true being smaller than presented there. For a typical magnetic field strength , in the dense maser region, of order mG, s-1, approximately three times larger than the rate of stimulated emission s-1 for the most saturated 6.7 GHz methanol masers with a maser brightness temperature K sr. This assumes a typical maser beaming angle sr, which decreases rapidly when the maser saturates. Thus, for most typical methanol masers with of order a few times K, s and little or no intensity dependent polarization is generated. This is supported by the fact that no relation between maser intensity and Zeeman splitting was found in V08. However, the brightest masers of G09.62+0.20 could have an that approaches or even becomes larger than , raising the possibility of intensity dependent circular polarization mimicking the Zeeman splitting between the RCP and LCP spectra. The generation of circular polarization due to this effect has been investigated for a transition by Nedoluha & Watson (1990). Although the effect is likely smaller for the transition of the 6.7 GHz methanol masers involving higher angular momentum states, it is found that the sign of the circular polarization, and consequently the sign of the splitting between RCP and LCP, is opposite from that generated by the regular Zeeman effect when the angle between the magnetic field and the maser line of sight obeys . Observationally, this implies that with increasing maser brightness temperature and consequently , the observed splitting between RCP and LCP spectra decreases. As the average Zeeman splitting of the two maser features, with fluxes different by an order of magnitude, are identical, the non-Zeeman effect apparently only becomes important when the flare nears its maximum flux. This indicates the masers of G09.62+0.20 approach complete saturation at its peak. It will be possible to test the hypothesis of the non-Zeeman interpretation of the observed splitting variability by simultaneously observing the maser linear polarization, as similar considerations predict an intensity dependence of fractional linear polarization and polarization angle.
4 Conclusions
We have presented Effelsberg 100-m telescope monitoring observations of the RCP-LCP frequency splitting of the periodically flaring 6.7 GHz methanol masers of the massive star forming region G09.62+0.20. A significant decrease in Zeeman splitting and thus possibly magnetic field strength is detected on the strongest maser feature during a two week period surrounding the flare maximum. Besides this decrease, a remarkable constant of mG is detected for the two brightest maser features separated by over 200 AU. The cause for the decrease in measured Zeeman splitting is still unclear but it is either related to the mechanism that causes the periodic maser flaring or a result of a non-Zeeman effect when the maser saturation level becomes significant.
Thus, G09.62+9.20, with the relative predictability of the flares, varying levels of intensities amongst maser features and correlated variability in RCP-LCP frequency splitting, is an ideal natural laboratory to test theories relating to both massive star formation and maser physics.
Acknowledgements.
WV acknowledges support by the Deutsche Forschungsgemeinschaft through the Emmy Noether Research grant VL 61/3-1. WV also thanks Alex Lazarian and Bill Watson for kindly answering a number of his questions.References
- Bartkiewicz et al. (2005) Bartkiewicz, A., Szymczak, M., Cohen, R. J., & Richards, A. M. S. 2005, MNRAS, 361, 623
- Boboltz et al. (1998) Boboltz, D. A., Simonetti, J. H., Dennison, B., Diamond, P. J., & Uphoff, J. A. 1998, ApJ, 509, 256
- Garay et al. (1993) Garay, G., Rodriguez, L. F., Moran, J. M., & Churchwell, E. 1993, ApJ, 418, 368
- Goedhart et al. (2003) Goedhart, S., Gaylard, M. J., & van der Walt, D. J. 2003, MNRAS, 339, L33
- Goedhart et al. (2004) Goedhart, S., Gaylard, M. J., & van der Walt, D. J. 2004, MNRAS, 355, 553
- Goedhart et al. (2005) Goedhart, S., Minier, V., Gaylard, M. J., & van der Walt, D. J. 2005, MNRAS, 356, 839
- Hofner et al. (1996) Hofner, P., Kurtz, S., Churchwell, E., Walmsley, C. M., & Cesaroni, R. 1996, ApJ, 460, 359
- Hutawarakorn & Cohen (1999) Hutawarakorn, B. & Cohen, R. J. 1999, MNRAS, 303, 845
- Massi et al. (2008) Massi, M., Ros, E., Menten, K. M., et al. 2008, A&A, 480, 489
- Nedoluha & Watson (1990) Nedoluha, G. E. & Watson, W. D. 1990, ApJ, 361, L53
- Phillips et al. (1998) Phillips, C. J., Norris, R. P., Ellingsen, S. P., & McCulloch, P. M. 1998, MNRAS, 300, 1131
- Sarma et al. (2001) Sarma, A. P., Troland, T. H., & Romney, J. D. 2001, ApJ, 554, L217
- Vlemmings (2007) Vlemmings, W. H. T. 2007, in IAU Symposium, Vol. 242, IAU Symposium, 37–46
- Vlemmings (2008) Vlemmings, W. H. T. 2008, A&A, 484, 773
- Vlemmings et al. (2006) Vlemmings, W. H. T., Diamond, P. J., van Langevelde, H. J., & Torrelles, J. M. 2006, A&A, 448, 597