Structural phase transitions and fundamental band gaps of MgxZn1-xO alloys from first principles
Abstract
The structural phase transitions and the fundamental band gaps of MgxZn1-xO alloys are investigated by detailed first-principles calculations in the entire range of Mg concentrations , applying a multiple-scattering theoretical approach (Korringa-Kohn-Rostoker method). Disordered alloys are treated within the coherent potential approximation (CPA). The calculations for various crystal phases have given rise to a phase diagram in good agreement with experiments and other theoretical approaches. The phase transition from the wurtzite to the rock-salt structure is predicted at the Mg concentration of , which is close to the experimental value of . The size of the fundamental band gap, typically underestimated by the local density approximation, is considerably improved by the self-interaction correction. The increase of the gap upon alloying ZnO with Mg corroborates experimental trends. Our findings are relevant for applications in optical, electrical, and in particular in magnetoelectric devices.
pacs:
61.50.Ks,81.30.HdI Introduction
In recent years, much effort has been devoted to research on ZnO, inspired mostly by its attractive properties for optoelectronic applications.Özgur et al. (2005) This interest arises from specific properties, e. g. a large piezoelectric coefficient, photoconductivity, and transparency in the visible and infrared wavelength regimes. The range of applications of this semiconductor can be considerably extended by alloying. Prominent dopants are Co and in particular Mg, on which we focus in this work. An increase of the Mg concentration can transform the crystal lattice from the wurtzite structure () of ZnO to the rock-salt structure () of MgO. Accompanied by this structural phase transition is a substantial increase of the fundamental band gap. The latter can be tuned from 3.35 eV to 7.7 eV.Özgur et al. (2005); Chen and Cui (2006) In view of a possible band-gap engineering, MgxZn1-xO alloys may also be considered as suitable insulating spacers in magnetoelectronic devices, in particular in magnetic tunnel junctions.
According to the equilibrium phase diagram,Segnit and Holland (1965); Raghavana et al. (1991) the solid solution of MgxZn1-xO is of eutectic type at normal conditions. It is characterized by an extensive solubility of zincite in MgO (up to 33 mol%) and by a restricted solubility of MgO in ZnO (4 mol%). The solubility depends strongly on experimental conditions and can be considerably increased at high temperatures and high pressures.Baranov et al. (2005); Solozhenko et al. (2006) Non-equilibrium growth processes, like pulsed laser deposition (PLD)Ohtomo et al. (1998); Sharma et al. (1999); Choopun et al. (2002); Narayan et al. (2002); Kunisu et al. (2004) and molecular beam epitaxial methodsPark et al. (2001); Takagi et al. (2003); Fujita et al. (2004); Vashaei et al. (2005), allow to grow high-quality MgxZn1-xO thin films for a large range of concentrations . For -MgxZn1-xO, produced by PLD, a maximum solubility has been reported for .Choopun et al. (2002); Bhattacharya et al. (2003) When increasing the Zn concentration, the and the phases separate, and MgxZn1-xO exhibits a structure for .Bendersky et al. (2005) The solubility limit and the phase formation in MgxZn1-xO are strongly influenced by experimental conditions and by the substrate on which the MgxZn1-xO film is grown. In general, alloying of ZnO and MgO proceeds by substituting Mg atoms by Zn atoms in the cubic structure and vice versa in the hexagonal structure.
The composition and the crystalline structure affect directly the electronic properties of MgxZn1-xO. Numerous absorption and photoluminescence spectroscopy experiments show that the fundamental band gap depends differently on the Zn concentration in the and phases.Chen et al. (2004); Schmidt-Grund et al. (2005) The width of the band gap increases most linearly with Mg concentration for both the and the phase, but the slope in cubic MgxZn1-xO is about twice as large as in the hexagonal structure.Chen et al. (2003) This experimental finding clearly indicates that MgxZn1-xO is a promising candidate for band-gap engineering. For instance in a magnetic tunnel junction, electrons that are transmitted from one electrode to the other have to pass the nonconducting spacer.Datta (1995) The transmission probability decays with spacer thickness and with the width of the spacer’s fundamental band gap.Dederichs et al. (2002); Zhang and Butler (2003) As a consequence, the spin-dependent conductance, i. e. the tunnel magnetoresistance, could be tuned by varying the fundamental band gap. Further, the magnetoresistance depends essentially on the properties of the ferromagnet-insulator interface, as was shown for Fe/MgO/Fe tunnel junctions.Zhang et al. (2003); Tusche et al. (2005) Hence, detailed knowledge of its geometric structure is necessary, and our theoretical investigation of the bulk structural phases can be regarded as one step towards that goal.
In addition to the extensive experimental work, there exist many detailed theoretical studies of both ZnO and MgO. Among them are Refs. Jaffe and Hess, 1993; Desgreniers, 1998; Recio et al., 1998; Hill and Waghmare, 2000; Jaffe et al., 2000; Limpijumnong and Lambrecht, 2001a, b; Baranov et al., 2002; Sun et al., 2005; Laskowski and Christensen, 2006; Uddin and Scuseria, 2006, using a variety of ab initio computational methods. There are, however, not many studies of MgxZn1-xO alloys, possibly due to the complex interplay of their electronic and geometric structures. Recently, thermodynamical stability and ordering tendencies of the alloys have been carefully investigated using the cluster-expansion method.Sanati et al. (2003) Based on the parameterization of total energies for various alloy configurations, the latter allows to study accurately structural properties, including short-range order (SRO) effects.Zunger (1994); Laks et al. (1992) It is found that the transition occurs at , which is consistent with experiment (, Ref. Ohtomo et al., 1998; similar results were obtained by a pseudopotential method using supercellsKim et al. (2001)). The cluster expansion method was also used by Seko et al. for investigating phase transitions, including vibrational effects through lattice dynamics calculations.Seko et al. (2005) The authors demonstrate that the transition pressure decreases with increasing Mg content, which is explained as follows. Below the solubility limit of MgO in ZnO, the phase is energetically preferred to the phase in MgO. Above the solubility limit, the configurational entropy increases by the transition from a mixed -ZnO/-MgO to a single phase.
A brief critical review of previous theoretical ab initio investigations has shown that: (i) In ZnO, the energy levels of the localized Zn- electrons are found relatively high and thus close to the valence bands, resulting in strong hybridization with O- states. Since these hybridization effects have to be correctly taken into account, the all-electron methods are preferred to the pseudopotential methods in which localized electrons are neglected. (ii) Because the Zn- electrons are localized, they are not well described within the local spin density approximation (LSDA) to density functional theory (DFT). To treat these electronic states adequately, one has to go beyond the LSDA, for example by applying the self-interaction correction (SIC) to the LSDA. (iii) Previous studies often focused on the and structures of the ordered alloys (i. e. or ). A detailed investigation of the complete transition path (with continuous variation of ) is still missing. For the latter it is inevitable to treat disordered alloys, for example within the coherent potential approximation.
In the present paper, we report on a systematic first-principles study of structural and electronic properties of ordered and disordered MgxZn1-xO alloys using an all-electron full-charge density Korringa-Kohn-Rostoker (KKR) method.Korringa (1947); Kohn and Rostoker (1954) Alloying of MgO and ZnO is described within CPA,Soven (1967) as formulated in multiple-scattering theory (KKR-CPA).Gyorffy (1972) One objective of this investigation is to describe accurately the structural phase transition from the to the structure in MgxZn1-xO, by continuously increasing the Mg concentration. The second objective addresses the formation of the fundamental band gap in MgxZn1-xO. It is further shown how the hybridization between Zn- and O- states affects the width of the band gap, by comparing results obtained within the LSDA with those obtained by applying the self-interaction correction.Perdew and Zunger (1981); Lüders et al. (2005) The validity of the present approach, especially the use of the CPA, is discussed by comparing our results with those of previous studies.Kim et al. (2001); Sanati et al. (2003); Seko et al. (2005) In summary, our study addresses important issues in MgxZn1-xO alloys which, with respect to magnetic tunnel junctions, might also be relevant for magnetoelectronics.
The paper is organized as follows. The model of the transition path from the to the structure is sketched in Section II. Details of the computational approach are presented in Section III. Results are discussed in Section IV. By comparing our results for the ordered alloys with those of other theoretical work and with experiment, the validity of our approach has been established. Our main results for the disordered alloys are discussed in Section V. In Section VI, the formation and evolution of the fundamental band gap as a function of Mg and Zn contents in the system is analyzed. Concluding remarks close the paper in Section VII.
II Modeling the structural phase transition
To investigate structural phase transitions in MgxZn1-xO, a transition path suggested for the continuous structural transformation in GaN was adopted.Limpijumnong and Lambrecht (2001a) This path has been already successfully applied in studies of structural deformations in MgOLimpijumnong and Lambrecht (2001b) and in ZnO.Limpijumnong and Jungthawan (2004) The structural transition is described as a homogenous strain deformation from the to the phase by passing an intermediate hexagonal structure (, refered to as -MgO in Ref. Limpijumnong and Lambrecht, 2001a). This hexagonal structure can as well occur in epitaxial systems due to the reduction of the interlayer distance, which was recently observed for thin ZnO films. Tusche et al. (2007); Meyerheim et al. (2009) A similar scheme is the Bain’s path for the transition from the face-centered-cubic to the body-centered-cubic structure.Marcus et al. (2002)
In the first step on the transition path (), the internal parameter is linearly increased while simultaneously decreasing the ratio (Fig. 1). At the space group changes from to . In the second step (), the lattice is compressed uniaxially along the direction and simultaneously is decreased further. The phase is characterized by , , and , whereas the phase has , , , and . For the phase, and . For details, see Ref. Limpijumnong and Lambrecht, 2001b.
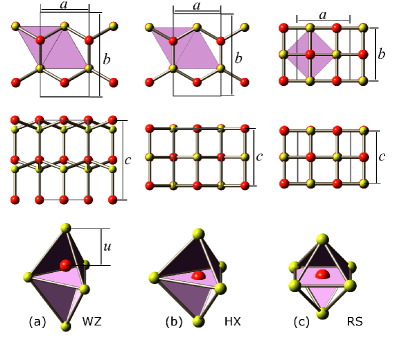
To perform total-energy minimizations (see Section III), the appropriate unit cell of an orthorhombic lattice with space group was used (Fig. 1). The latter is a common subgroup of all three phases.Sowa (2001) In our calculations, the parameter , specifying the relative positions of the subsublattices,Limpijumnong and Lambrecht (2001b) and the ratio (defined in Fig. 1) are fixed by the geometry of a particular phase. The parameter , which is the internal vertical displacement of the cation atoms in the oxygen plane, and the ratio were obtained by the total energy minimization for the pure compounds (i. e., -ZnO and -MgO) within LSDA. They are kept fixed at these values for MgxZn1-xO alloys for all concentrations .
III Computational details
The electronic and geometric structures of MgxZn1-xO alloys are obtained within density-functional theory. The local density approximation and its self-interaction correction (see below) are implemented in a multiple-scattering approach (the Korringa-Kohn-Rostoker method, KKR).Zabloudil et al. (2005) Disordered alloys are described within the coherent potential approximation (CPA).Gonis (1992)
For closed-packed systems, for example transition metals, the crystal potential is commonly approximated as a sum over the so-called ‘muffin-tin potentials’Weinberger (1990) (that is, spherically symmetric potentials centered at each lattice site, while in the interstitial region the potential is constant). For open systems, this approximation results in a relatively poor description of the electronic structure. It has turned out that the usual trick of inserting the so-called ‘empty spheres’ into the interstitial region is not sufficient for MgO and ZnO, in particular in view of the high degree of accuracy needed in the evaluation of total energies. Obviously, the latter is inevitable for a reliable description of structural phase transitions. Consequently, a full-charge density approximation was applied. Here, the total energy is estimated from the non-spherical charge density and the full potential. All radial integrals are calculated using the unit cell geometry; the single-site problem is still solved with a spherical potential averaged within a Voronoi cell. The accuracy of this approach is as good as that of a full-potential method but is not as time-consuming. The validity of the full charge-density approximation was checked by comparison with results of the corresponding KKR full-potential calculations for the ordered -ZnO and -MgO compounds.
The disordered MgxZn1-xO can be viewed as a substitutional binary alloy in which the metal sublattice (Zn, Mg) is subject to chemical disorder. The oxygen sublattice remains unaffected. Hence, the coherent potential approximation (CPA) is an obvious choice for describing MgxZn1-xO at an arbitrary concentration . Within the CPA, Mg and Zn impurities are embedded into an effective coherent potential medium which is determined self-consistently.Gonis (1992); Zabloudil et al. (2005) Since the KKR-CPA is a single-site approximation, it does not allow to investigate the influence of chemical short-range order on the electronic properties (SRO can be taken into account by the cluster CPA,Weinberger et al. (1988) the locally self-consistent Green function methodAbrikosov et al. (1997) or the non-local CPA approachRowlands et al. (2006)). However, for many alloys the single-site CPA provides a reasonable description of the electronic structure.Abrikosov and Johansson (1998) For MgxZn1-xO, the validity of the KKR-CPA was established through a direct comparison with KKR supercell calculations (which include SRO effects) for , , and . The major structural and electronic properties, such as the equilibrium lattice constants, bulk moduli, equilibrium pressures, and fundamental band gaps, are reproducible within both the KKR-CPA and the supercell approach. Hence we conclude that SRO effects cannot be ruled out but they are of minor importance for the issues addressed in this work. A detailed investigation of SRO effects is beyond the scope of the present work.
Although the Mg-2p electron states lie comparably deeply in energy (about 2 Rydberg below the valence bands), they have been treated as valence states. It is found that the hybridization of the associated electronic states with the valence states is important for an accurate determination of total energies, especially for the evaluation of both the ratio and the parameter in the structure. The same procedure was applied in an earlier all-electron study of MgO, using a full-potential linearized muffin-tin orbital (FP-LMTO) method.Limpijumnong and Lambrecht (2001b)
Since the Zn- states are energetically close to the O- states, they have to be considered as valence electrons as well. It is well-known that the hybridization of the localized Zn- electrons with the O- electrons is crucial for an accurate investigation of the band-gap formation in ZnO.Usuda et al. (2002) Being strongly localized, the Zn- states are not adequately described within the local density approximation. The LSDA contains the (unphysical) self-interaction of an electron with itself (see e. g. Refs. Lüders et al., 2005 and Temmerman et al., 1998), an effect whose importance increases with the degree of electron localization. As a consequence of the self-interaction, the energy levels of the localized electrons obtained within the LSDA lie too high and their hybridization with the O- states is too strong. The calculated fundamental band gap in ZnO is therefore considerably too small as compared to experiment.
An improved description of localized electrons is achieved by the self-interaction correction Perdew and Zunger (1981); Lüders et al. (2005) in which the unphysical self-interaction is removed from the LSDA exchange-correlation functional. In this approach, SIC is applied to various configurations of localized electron states, and the configuration with the lowest total energy defines the ground state energy and configuration. The SIC-LSD approach, being based on a variational principle, is parameter free and treats on equal footing both itinerant and localized electrons. When no localized electrons are present in the system, then the SIC-LSDA total energy is equivalent to the LSDA total energy. Thus the LSDA energy functional is a local minimum of the SIC-LSDA functional. For ZnO in both the and the phase it is found that all -electrons have to be SI-corrected. Since the Zn- states have semi-core character, application of the SIC leads to a uniform increase of the binding energies of these states, to a decrease of the total energy, and to an increased fundamental band gap in ZnO. Because other electronic states were treated within the LSDA, we label this calculations SIC-LSDA for short.
To check whether SIC affects only the fundamental band gap or also structural properties, we have compared results of a SIC-LSDA calculation for ZnO with those of an LSDA calculation, based on the same computer code. It has been shown that structural properties calculated within both LSDA and SIC-LSDA are very close, whereas the band gap obtained within SIC-LSDA has been substantially larger than in the LSDA case. This finding has been further verified for disordered MgxZn1-xO alloys at selected concentrations. As a result, in order to save computational costs, only LSDA has been used for the studies of the structural properties. In contrast, here, the fundamental band gap has been investigated at the respective equilibrium lattice constants within SIC-LSDA. For both the LSDA and SIC-LSDA calculations the Perdew-Wang exchange-correlation functional has been applied.Perdew and Wang (1992)
The equilibrium volumes, bulk moduli, pressures, and enthalpies have been calculated for zero temperature from the total energy fitted to the Murnaghan equation of state.Murnaghan (1944) Lattice vibrations, finite-temperature effects, and relativistic corrections have not been considered. The angular momentum cut-offs have been chosen as for the Green function expansion and for both the charge-density and the potential representation. The convergence with and with normalization of the Green function was significantly improved by use of Lloyd’s formula in this work.Lloyd (1967); Zeller (2004) The concentration, , of Mg impurities in ZnO has been varied in steps of .
IV Structural properties of ordered ZnO and MgO in and phases
Due to the large number of structural parameters, a complete structure optimization of MgxZn1-xO alloys is an involved task. Apart from these parameters, the alloy composition is an additional degree of freedom which complicates the problem further. Therefore, the number of parameters to be optimized has been reduced by concentrating on volume changes in the , , and structures upon variation of (see Section II).
To our knowledge, the KKR method was not used before for optimizing and structures. Hence extensive calculations for pure ZnO and MgO have been required to determine both the optimum and . In accomplishing this, the procedure suggested in Ref. Limpijumnong and Lambrecht, 2001b has been followed. Since the calculation of lattice relaxations from forces is rather complicated and not sufficiently accurate within the KKR method, we have calculated the total energies consecutively varying three parameters: the lattice constants , the and the internal parameter . The total energy has been calculated at a given for a sufficiently dense mesh of lattice constants and then fitted to the Murnaghan equation of state. The initial value of the parameter has been taken from the experiment for a particular structure and then successively varied as long as the absolute total energy minimum has not been reached. To establish the validity of the present KKR approach for structure optimization, our results have been compared with those of other first-principles calculations. We note that our calculations for both ZnO and MgO in various structures have been carried out for the same unit cell on the same level of approximation.
The adequacy of the present approach is evidenced by the agreement with experimental data and the results of other theoretical approaches (see Tables 1 and 2). It is found that our results agree with those obtained by the other all-electron methods, as opposed to the pseudo-potential methods. In particular, the parameters obtained in this work compare well with those reported by Limpijumnong and coworkers.Limpijumnong and Lambrecht (2001b); Limpijumnong and Jungthawan (2004) This agreement might be attributed to the fact that both studies follow the same optimization scheme (as suggested in Refs. Limpijumnong and Lambrecht, 2001b and Limpijumnong and Jungthawan, 2004) and that the Zn- as well as the Mg- electrons have been treated as valence electrons.
| Phase | Theory | Experiment | |
| (Å3) | 22.80111Ref. Limpijumnong and Jungthawan, 2004: PPW., 22.83, 22.87222Ref. Jaffe et al., 2000: LCAO., 22.91333Ref. Uddin and Scuseria, 2006: LCAO., 22.93444Ref. Seko et al., 2005: PPW., 23.4555Ref. Kim et al., 2001: PPW.666Ref. Lambrecht et al., 1999: FP-LMTO., 23.62777Ref. Ahuja et al., 1998: FP-LMTO., 23.7855footnotemark: 5 | 23.80 888Ref. Desgreniers, 1998.999Ref. Karzel et al., 1996. | |
| 1.59077footnotemark: 7, 1.602, 1.60555footnotemark: 5, 1.60733footnotemark: 3, 1.60866footnotemark: 6, 1.61011footnotemark: 1, 1.61422footnotemark: 2, 1.61744footnotemark: 4 | 1.60288footnotemark: 899footnotemark: 9 | ||
| 0.37922footnotemark: 2, 0.38011footnotemark: 177footnotemark: 766footnotemark: 6, 0.38133footnotemark: 3 | 0.38288footnotemark: 899footnotemark: 9 | ||
| (GPa) | 154, 15455footnotemark: 5, 15533footnotemark: 3, 15766footnotemark: 6, 16077footnotemark: 7, 16211footnotemark: 122footnotemark: 244footnotemark: 4 | 14388footnotemark: 8, 18399footnotemark: 9 | |
| (Å3) | 22.12 | ||
| 1.200 | |||
| (GPa) | 165 | ||
| (Å3) | 18.7011footnotemark: 1, 18.7633footnotemark: 3, 18.8744footnotemark: 4, 18.88, 18.9822footnotemark: 2, 19.0877footnotemark: 7, 19.4555footnotemark: 5 | 19.4899footnotemark: 9, 19.6088footnotemark: 8 | |
| (GPa) | 20055footnotemark: 5, 201, 20333footnotemark: 3, 20622footnotemark: 2, 21011footnotemark: 1, 21144footnotemark: 4, 21977footnotemark: 7 | 20299footnotemark: 9, 22888footnotemark: 8 |
| Phase | Theory | Experiment | |
| (Å3) | 22.50101010Ref. Limpijumnong and Lambrecht, 2001b: FP-LMTO.,, 22.5355footnotemark: 5, 23.1566footnotemark: 6, 23.20 | ||
| 1.55055footnotemark: 5, 1.610, 1.6201010footnotemark: 10, 1.63366footnotemark: 6 | |||
| 0.380, 0.380 1010footnotemark: 10 | |||
| (GPa) | 121, 13155footnotemark: 5, 1371010footnotemark: 10 | ||
| (Å3) | 20.901010footnotemark: 10, 21.71 | ||
| 1.200, 1.2001010footnotemark: 10 | |||
| (GPa) | 135, 1481010footnotemark: 10 | ||
| (Å3) | 17.5455footnotemark: 5, 17.801010footnotemark: 10, 17.9644footnotemark: 4, 18.0322footnotemark: 2, 18.19, 18.65111111Ref. Baranov et al., 2002: FP-KKR. | 18.67121212Ref. Wyckoff, 1963., 18.75131313Ref. Sangster and Stoneham, 1981. | |
| (GPa) | 167, 17055footnotemark: 5, 1721111footnotemark: 11, 17444footnotemark: 4, 1781010footnotemark: 10, 18622footnotemark: 2 | 169141414Ref. Cohen and Gordon, 1981., 172151515Ref. Sangster et al., 1970. |
As for the structural properties, we find agreement concerning the volume ratios of the different phases and the equilibrium pressures at the phase transitions (see Tables 3 and 4). For ZnO there is only the phase transition while for MgO there are two transitions, namely and . In particular for ZnO, our theoretical results compare well with experimental ones (see Table 3).
| Theory | Experiment | |
|---|---|---|
| 1.2022footnotemark: 2, 1.21, 1.2233footnotemark: 344footnotemark: 455footnotemark: 5, 1.2477footnotemark: 7 | 1.2199footnotemark: 9, 1.2288footnotemark: 8 | |
| (GPa) | 3.933footnotemark: 3, 6.633footnotemark: 3, 8.077footnotemark: 7, 8.211footnotemark: 1, 8.6, 8.733footnotemark: 3 | 8.788footnotemark: 8, 9.199footnotemark: 9 |
For MgO we find agreement with other theoretical estimations too (Table 4). However, the equilibrium pressure for the - phase transition might be an exception. The apparent disagreement with the result reported in Ref. Limpijumnong and Lambrecht, 2001b may be related to the instabilities of the and the structures (Figs. 2 and 3a). Moreover, due to the negative pressure these phases cannot be realized experimentally, hence ruling out a clarifying comparison of theory with experiment. In favor of our work, we would like to mention that the present calculations reproduce well and . One might speculate that earlier implementations of multiple-scattering theory failed to optimize these structural parameters in any open structure due to the slow angular momentum convergence of the Green function (see Section III; the convergence is significantly improved by using Lloyd’s formula).Maghadam et al. (2001)
| Theory | |
|---|---|
| 1.171010footnotemark: 10, 1.19 | |
| (GPa) | 1010footnotemark: 10, |
| 1.24, 1.261010footnotemark: 10, 1.2855footnotemark: 5 | |
| (GPa) | , 1010footnotemark: 10 |
In summary, the agreement of our results for the ordered alloys with those of other theoretical investigations and experiments indicates that the present approach is as reliable and accurate as any other state-of-the-art methods.
V Structural properties of disordered MgxZn1-xO alloys
Having established that our results for ordered ZnO and MgO are consistent with the structural properties obtained by other theoretical methods and by experiments, we now turn to the discussion of results for disordered MgxZn1-xO alloys. To reduce the number of parameters to be optimized, both and were fixed respectively to and in the structure and to and in the structure. This approximation is justified by the weak dependence of both and on the atomic species (Mg or Zn; cf. Tables 1 and 2). Consequently, the structure (the actual phase), Mg concentration , and unit cell volume remain to be varied. The results of the total-energy calculations involving these three variables are discussed below. The results of the total energy calculations are comprised in the formation enthalpy (at T=0)
| (1) |
of a structure of MgxZn1-xO, relative to the most stable forms of ZnO () and MgO () compounds.Sanati et al. (2003)
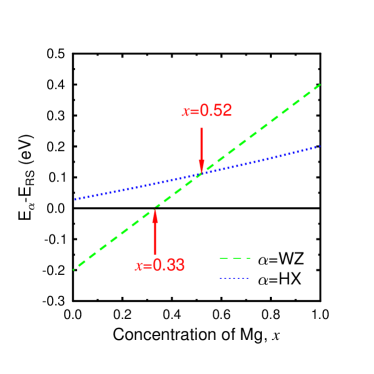
The formation enthalpy is positive throughout, as seen in Fig. 2, in agreement with previous theoretical studies.Sanati et al. (2003); Seko et al. (2005) There are two global minima (i. e. the most stable phases; black, dark regions), for pure ZnO in () and pure MgO in phase (). This finding implies a tendency towards phase separation if the integration of different constituents into the medium cannot be maintained.Sanati et al. (2003)
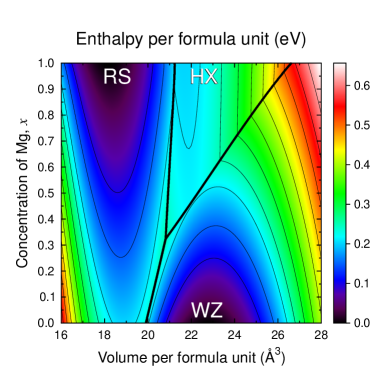
In the following, five special cases are discussed in more detail, namely , , , , and .
With low Mg concentration, the phase is favorable in any case (Fig. 3a). The pressure needed for a transition is positive and increases monotonously (Fig. 4).
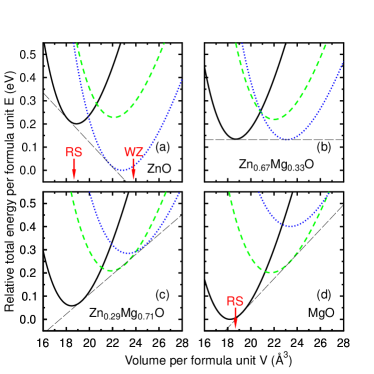
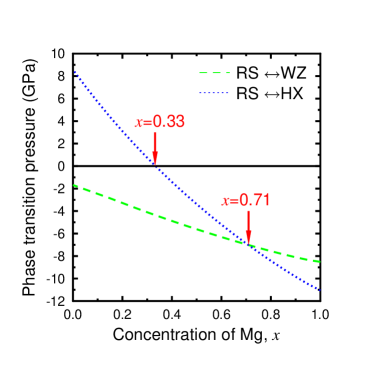
For the total energy of the structure is larger than for the and the phases, implying that an intermediate phase cannot be established (Fig. 2). Consequently, a direct transition is possible at positive pressure. At (Figs. 3b and 5) this phase transition can take place at zero pressure. This finding is consistent with the theoretical work of Sanati and coworkersSanati et al. (2003) and is also observed experimentally in ZnO-MgO heterostructures.Ohtomo et al. (1998)
At the and the transitions occur at the same pressure (Fig. 4). This is evident from Fig. 3c because all total energy curves can be connected by a single tangent. We note that for the transition is possible at zero pressure, and the corresponding total energies relative to phase are identical (see Fig. 5).
For pure MgO (; Fig. 3d), the structure exhibits the global minimum at a volume of which is about 2 % less than the experimental value (see Table 2). By applying a negative pressure (i. e. by increasing the volume along the tangent) the phase is transformed into the structure, in agreement with the work of Limpijumnong and coworkers.Limpijumnong and Lambrecht (2001b)
VI Band gap in MgxZn1-xO alloys
Since MgxZn1-xO alloys arouse great interest as band gap-engineering materials, in this section we study the evolution of their fundamental band gap as a function of the Zn and Mg contents. We restrict our consideration to the and phases, as only these appear interesting from the experimental point of view.
Band gap formation can be correctly described only within a many-body theory which takes properly into account the electron-hole excitations. However, the approximationHedin and Lundqvist (1969), probably the most popular first-principles many-body approach for calculating excitation energies, is too expensive for studying alloys with arbitrary concentrations and also having constituents with localized electrons. Therefore, for this study we have used only the LSDA and SIC-LSDA approaches. The calculated band gaps have been estimated from the density of states (DOS), band structure and Bloch spectral function, corresponding to the theoretical equilibrium lattice structure of a given chemical composition.
Using LSDA for -MgO we obtain a band gap of , which is of the experimental value (). For the pure -ZnO, LSDA gives the band gap of , which is only of the experimental value of . In MgO, the difference between the calculated and experimental values originates mostly from the fact that the electron-hole excitations are neglected in LSDA, which can be corrected effectively with the approximation.Schönberger and Aryasetiawan (1995) For ZnO the problem is more complex, as in addition to the neglect of the electron-hole excitations, the localized nature of Zn 3 electrons is not adequately represented within LSDA. This failure of LSDA is largerly related to the inherent unphysical self-interaction. The latter affects the band gap by placing the localized 3 electrons of Zn at too low binding energies, thus leading to their strong hybridization with the O- states. In LSDA the Zn- states are about too high with respect to the experimental value of about –Powell et al. (1971); Vesely et al. (1972) (see the DOS of ZnO in Fig. 6). In the and phases, the states are placed at slightly different energies, and in the the corresponding band width is larger due to the more closed-packed crystal environment. The strong -hybridization dramatically reduces the band gap, which can be improved only slightly within the approximation, if based on the LSDA Green’s function.Usuda et al. (2002) It is the aim of our future studies to use the SIC-LSDA band structure of ZnO for the subsequent calculation. The SIC-LSDA band gap we have calculated is for -ZnO and for -ZnO. Thus, the SIC-LSDA band gap for the -ZnO constitutes 69% of the experimental value of . This tells us that SIC-LSDA is at least as good for the pure ZnO, as LSDA is for the pure MgO. The reason being, that SIC-LSDA describes both itinerant and localized electrons on equal footing. Of course, in MgO the band gap is constituted by the electrons which are itinerant and thus unaffected by the spurious self-interaction, while in ZnO the 3 electrons of Zn play a defining role in establishing the band gap. The SIC-LSDA approach, by removing the unphysical self-interaction of all 10 Zn electrons, describes them much more adequately than LSDA.
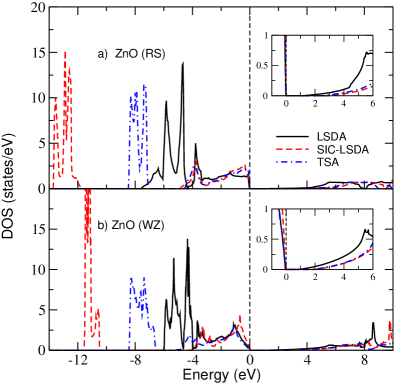
What happens as a result of SIC is that all the -states of Zn move to higher binding energies and the Zn-derived bands become narrower thereby reducing the -hybridization and increasing the band gap, as seen in Fig. 6. The structural properties of MgxZn1-xO are believed to be little affected by this uniform shift downwards in energy of the -states, leading mostly to a uniform lowering of the total energy.
Being an effective one-electron ground state theory, SIC-LSDA does not provide a quasi-particle spectrum to compare with spectroscopies. Missing the crucial screening/relaxation effects (self-energy), it predicts the 3 Zn electrons at too high binding energies, as opposed to LSDA where they come out too low (Fig. 6). One can implement a simple fix to correct for the screening effects in SIC-LSDA, based on the Slater’s transition state theory.Slater (1972); Liberman (2000) Following the concept of the latter, we calculate the SIC-LSDA-based removal energies of localized electrons as an average of the calculated SIC-LSDA and LSDA -state expectation values
| (2) |
Effectively, the above equation states that only half of the SIC potential should be applied at the stage of calculating the density of states, after the self-consistency has been achieved. We refer to Eq. 2 as the transition state approximation (TSA) and show the resulting DOS of ZnO in Fig. 6. We can see that Zn -states, calculated using TSA, appear at lower binding energies, as compared to the strict SIC-LSDA result. Consequently, the TSA-binding energies of Zn states are in better agreement with experimental values of –Powell et al. (1971); Vesely et al. (1972). The effective hybridization of Zn -states with the oxygen -states is stronger as in the SIC-LSDA case, which leads to a reduction of the band gap to and (52% of the experimental value) in and phases, respectively.
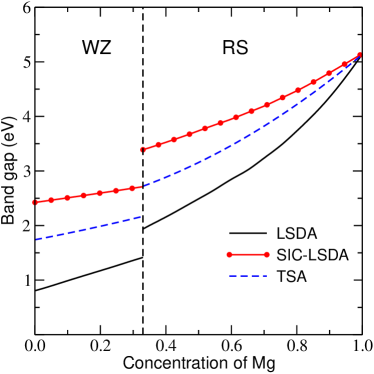
In MgxZn1-xO alloys the size of the band gap depends on the concentration of Mg impurities, as seen in Fig. 7 and Table 5. While at the Mg rich end the LSDA band gaps are closer to experiment, at the other end the SIC-LSDA band gaps are more adequate. As for the TSA results, they fall mostly in between the LSDA and SIC-LSDA band gaps, especially for small Mg concentrations, where the hybridization of the O 2 bands with the Zn 3 states is of great significance (see Fig. 7). The behaviour of the band gap as a function of Mg concentration is also different between the various approaches. While the LSDA curves are rather parabolic, the SIC-LSDA and TSA band gaps seem to change almost linearly with concentration, thus following more closely experimental resultsChen et al. (2004); Schmidt-Grund et al. (2005). This is mostly due to the fact that the actual magnitudes of the band gaps change slower with concentration in SIC-LSDA and TSA than in LSDA. The reason being that the larger Zn content, the more inadequate LSDA is and the smaller the resulting band gaps.
| LSDA | TSA | SIC-LSDA | Experiment | |
| Band gap [eV] | ||||
| -MgO | 5.15 | 7.70 | ||
| -ZnO | 0.80 | 1.74 | 2.42 | 3.35 |
| Bowing parameter [eV] | ||||
| 1.90 | 0.91 | 0.59 | 0.70 0.2 Chen et al. (2004) | |
| 4.88 | 4.05 | 3.65 | 3.60 0.6 Schmidt-Grund et al. (2005) | |
Although, both LSDA and SIC-LSDA underestimate the size of the band gap, , its dependence on the Mg concentration, , can be compared with experimental results. One way of doing it is to estimate the so-called bowing parameter, , appearing in the commonly used definition of the fundamental band gap dependence on the composition , namely
where the bowing parameter is given by
| (3) |
Thus to evaluate the bowing parameter one needs to know the band gaps of the pure MgO() and ZnO(), as well as their alloy with the concentration .
According to our total energy calculations the MgxZn1-xO at occurs in the phase which is in agreement with the experiment of Chen et al..Chen et al. (2004) However, the crystal structure of MgxZn1-xO thin film alloys depends strongly on the growth method. In variance to Ref. Chen et al., 2004, the MgxZn1-xO films with , prepared with the PLD procedure, were found to have the structure. Therefore, for direct comparison with the experiments we have used Mg0.50Zn0.50O in both and phases. The resulting calculated bowing parameters for MgxZn1-xO alloys are presented in Table 5. We can see that the LSDA systematically overestimates the bowing parameter for both structures, while the straight SIC-LSDA agrees very well with experiments. The TSA results fall in between the LSDA and SIC-LSDA values.
Summarizing this section, we have to say that despite rather good agreement of our SIC-LSD bowing parameter with experiments, to be truly predictive, one would need a more robust method like a combination of SIC and . This way we could also predict the correct magnitudes of the band gaps and enter the serious business of band gap engineering.
VII Conclusions and outlook
Structural phase transitions and the fundamental band gaps of MgxZn1-xO alloys have been investigated by detailed first-principles calculations. The multiple-scattering theoretical approach used here (Korringa-Kohn-Rostoker method) allows to treat disordered alloys within the coherent potential approximation, that is MgxZn1-xO alloys with arbitrary Zn concentration , with an accuracy as good as in other first-principles methods. The importance of treating localized states of ZnO appropriately within the framework of the local-density approximation to density-functional theory is established, thereby confirming the usefulness of the self-interaction correction.
The delicate interplay of geometry and electronic structure is not only of importance for bulk systems, as shown in this work. In nanotechnology, interfaces and surfaces play an essential role. Therefore, a correct description of disordered alloys and their electronic structure, in particular at the Fermi energy, is necessary for predicting material properties, besides confirming and explaining experimental results. However, to be fully predictive regarding the properties of such systems as MgxZn1-xO alloys, of importance for device applications, one needs a first-principles approach like a combination of with SIC-LSDA.
Acknowledgements.
This work is supported by the Sonderforschungsbereich SFB 762, ”Functionality of Oxidic Interfaces”. Research at the Oak Ridge National Laboratory was sponsored by the Division of Materials Sciences and Engineering, Office of Basic Energy Sciences, US Department of Energy, under Contract DE-AC05-00OR22725 with UT-Battelle, LLC. We gratefully acknowledge H. L. Meyerheim for many stimulating discussions. The calculations were performed at the John von Neumann Institute in Jülich and Rechenzentrum Garching of the Max Planck Society (Germany).References
- Özgur et al. (2005) U. Özgur, Y. I. Alivov, C. Liu, A. Teke, M. A. Reshchikov, S. Doğan, V. Avrutin, S.-J. Cho, and H. Morkoç, Journal of Applied Physics 98, 041301 (2005).
- Chen and Cui (2006) N. B. Chen and C. H. Cui, Materials Science and Engineering B 126, 16 (2006).
- Segnit and Holland (1965) E. R. Segnit and A. E. Holland, Journal of the American Ceramic Society 48, 409 (1965).
- Raghavana et al. (1991) S. Raghavana, J. P. Hajrab, G. N. K. Iyengarb, and K. P. Abrahamc, Thermochimica Acta 189, 151 (1991).
- Baranov et al. (2005) A. N. Baranov, V. L. Solozhenko, C. Chateau, G. Bocquillon, J. P. Petitet, G. N. Panin, T. W. Kang, R. V. Shpanchenko, E. V. Antipov, and Y. J. Oh, J. Phys.: Condens. Matt. 17, 3377 (2005).
- Solozhenko et al. (2006) V. L. Solozhenko, A. N. Baranov, and V. Z. Tukevich, Sol. State Commun. 138, 534 (2006).
- Ohtomo et al. (1998) A. Ohtomo, M. Kawasaki, T. Koida, K. Masubuchi, H. Koinuma, Y. Sakurai, Y. Yoshida, T. Yasuda, and Y. Segawa, Appl. Phys. Lett. 72, 2466 (1998).
- Sharma et al. (1999) A. K. Sharma, J. Narayan, J. F. Muth, C. W. Teng, C. Jin, A. Kvit, R. M. Kolbas, and O. W. Holland, Appl. Phys. Lett. 75, 3327 (1999).
- Choopun et al. (2002) S. Choopun, R. D. Vispute, W. Yang, R. P. Sharma, T. Venkatesan, and H. Shen, Appl. Phys. Lett. 80, 1529 (2002).
- Narayan et al. (2002) J. Narayan, A. K. Sharma, A. Kvit, C. Jin, J. F. Muth, and O. W. Holland, Sol. State Commun. 121, 9 (2002).
- Kunisu et al. (2004) M. Kunisu, I. Tanaka, T. Yamamoto, S. T., and T. Mizoguchi, J. Phys.: Condens. Matt. 16, 3801 (2004).
- Park et al. (2001) W. I. Park, G. C. Yi, and H. M. Jang, Appl. Phys. Lett. 79, 2022 (2001).
- Takagi et al. (2003) T. Takagi, H. Tanaka, S. Fujita, and S. Fujita, Jpn. J. Appl. Phys. 42, L401 (2003).
- Fujita et al. (2004) S. Fujita, T. Takagi, H. Tanaka, and S. Fujita, phys. stat. sol. (b) 241, 599 (2004).
- Vashaei et al. (2005) Z. Vashaei, T. Minegishi, T. Suzuki, M. W. Cho, T. You, and A. Setiawan, J. Appl. Phys. 98, 054911 (2005).
- Bhattacharya et al. (2003) P. Bhattacharya, R. R. Das, and R. S. Katiyar, Appl. Phys. Lett. 83, 2010 (2003).
- Bendersky et al. (2005) L. A. Bendersky, I. Takeuchi, K.-S. Chang, W. Yang, S. Hullavarad, and R. D. Vispute, J. Appl. Phys. 98, 083526 (2005).
- Chen et al. (2004) N. B. Chen, H. Z. Wu, D. J. Qiu, T. N. Xu, J. Chen, and W. Z. Shen, J. Phys.: Condens. Matt. 16, 2973 (2004).
- Schmidt-Grund et al. (2005) R. Schmidt-Grund, D. Fritsch, B. Schubert, M. Rheinländer, H. Schmidt, H. Hochmut, M. Lorenz, D. Spemann, C. M. Herzinger, and M. Grundmann, AIP Conf. Proc. 772, 201 (2005).
- Chen et al. (2003) J. Chen, W. Z. Shen, N. B. Chen, D. J. Qiu, and H. Z. Wu, J. Phys.: Condens. Matt. 15, L475 (2003).
- Datta (1995) S. Datta, Electronic Transport in Mesoscopic Systems (Cambridge University Press, Cambridge, 1995).
- Dederichs et al. (2002) P. H. Dederichs, P. Mavropoulos, O. Wunnicke, N. Papanikolaou, V. Bellini, R. Zeller, V. Drchal, and J. Kudrnovský, J. Magn. Magn. Mater. 240, 108 (2002).
- Zhang and Butler (2003) X.-G. Zhang and W. H. Butler, J. Phys.: Condens. Matt. 15, R1603 (2003).
- Zhang et al. (2003) X.-G. Zhang, W. H. Butler, and A. Bandyopadhyay, Phys. Rev. B 68, 092402 (2003).
- Tusche et al. (2005) C. Tusche, H. L. Meyerheim, N. Jedrecy, G. Renaud, A. Ernst, J. Henk, P. Bruno, and J. Kirschner, Phys. Rev. Lett. 95, 176101 (2005).
- Jaffe and Hess (1993) J. E. Jaffe and A. C. Hess, Phys. Rev. B 48, 7903 (1993).
- Desgreniers (1998) S. Desgreniers, Phys. Rev. B 58, 14102 (1998).
- Recio et al. (1998) J. M. Recio, M. A. Blanco, V. Luaña, R. Pandey, L. Gerwand, and J. S. Olsen, Phys. Rev. B 58, 8949 (1998).
- Hill and Waghmare (2000) N. A. Hill and U. Waghmare, Phys. Rev. B 62, 8802 (2000).
- Jaffe et al. (2000) J. E. Jaffe, J. A. Snyder, Z. Lin, and A. V. Hess, Phys. Rev. B 62, 1660 (2000).
- Limpijumnong and Lambrecht (2001a) S. Limpijumnong and W. R. L. Lambrecht, Phys. Rev. Lett. 86, 91 (2001a).
- Limpijumnong and Lambrecht (2001b) S. Limpijumnong and W. R. L. Lambrecht, Phys. Rev. B 63, 104103 (2001b).
- Baranov et al. (2002) A. N. Baranov, V. S. Stepanyuk, W. Hergert, A. A. Katsnelson, A. Settels, R. Zeller, and P. H. Dederichs, Phys. Rev. B 66, 155117 (2002).
- Sun et al. (2005) J. Sun, H.-T. Wang, J. He, and Y. Tain, Phys. Rev. B 71, 125132 (2005).
- Laskowski and Christensen (2006) R. Laskowski and N. E. Christensen, Phys. Rev. B 73, 045201 (2006).
- Uddin and Scuseria (2006) J. Uddin and G. E. Scuseria, Phys. Rev. B 74, 245115 (2006).
- Sanati et al. (2003) M. Sanati, G. L. W. Hart, and A. Zunger, Phys. Rev. B 68, 155210 (2003).
- Zunger (1994) A. Zunger, in Statics and Dynamics of Alloys Phase Transition, edited by P. E. A. Turchi and A. Gonis (Plenum, New York, 1994), p. 361.
- Laks et al. (1992) D. B. Laks, L. G. Ferreira, S. Froyen, and A. Zunger, Phys. Rev. B 46, 12587 (1992).
- Kim et al. (2001) Y.-S. Kim, E.-C. Lee, and K. J. Chang, J. Korean Phys. Soc. 39, 92 (2001).
- Seko et al. (2005) A. Seko, F. Oba, A. Kuwabara, and I. Tanaka, Phys. Rev. B 72, 024107 (2005).
- Korringa (1947) J. Korringa, Physica 13, 392 (1947).
- Kohn and Rostoker (1954) W. Kohn and N. Rostoker, Phys. Rev. 94, 1111 (1954).
- Soven (1967) P. Soven, Phys. Rev. 156, 809 (1967).
- Gyorffy (1972) B. L. Gyorffy, Phys. Rev. B 5, 2382 (1972).
- Perdew and Zunger (1981) J. P. Perdew and A. Zunger, Phys. Rev. B 23, 5048 (1981).
- Lüders et al. (2005) M. Lüders, A. Ernst, M. Däne, Z. Szotek, A. Svane, D. Ködderitzsch, W. Hergert, B. L. Györffy, and W. M. Temmerman, Phys. Rev. B 71, 205109 (2005).
- Limpijumnong and Jungthawan (2004) S. Limpijumnong and S. Jungthawan, Phys. Rev. B 70, 054104 (2004).
- Tusche et al. (2007) C. Tusche, H. L. Meyerheim, and J. Kirschner, Phys. Rev. Lett. 99, 026102 (2007).
- Meyerheim et al. (2009) H. L. Meyerheim, C. Tusche, A. Ernst, S. Ostanin, I. V. Maznichenko, K. Mohseni, N. Jedrecy, J. Zegenhagen, J. Roy, I. Mertig, et al., Phys. Rev. Lett. 102, 156102 (2009).
- Marcus et al. (2002) P. M. Marcus, F. Jona, and J. L. Qiu, Phys. Rev. B 66, 064111 (2002).
- Sowa (2001) H. Sowa, Act. Cryst. A57, 176 (2001).
- Zabloudil et al. (2005) J. Zabloudil, R. Hammerling, L. Szunyogh, and P. Weinberger, eds., Electron Scattering in Solid Matter (Springer, Berlin, 2005).
- Gonis (1992) A. Gonis, Green Functions for Ordered and Disordered Systems, vol. 4 of Studies in Mathematical Physics (North-Holland, Amsterdam, 1992).
- Weinberger (1990) P. Weinberger, Electron Scattering Theory of Ordered and Disordered Matter (Clarendon Press, Oxford, 1990).
- Weinberger et al. (1988) P. Weinberger, R. Dirl, A. M. Boring, A. Gonis, and A. J. Freeman, Phys. Rev. B 37, 1383 (1988).
- Abrikosov et al. (1997) I. A. Abrikosov, S. I. Simak, B. Johansson, A. V. Ruban, and H. L. Skriver, Phys. Rev. B 56, 9319 (1997).
- Rowlands et al. (2006) D. A. Rowlands, A. Ernst, J. B. Staunton, and B. L. Györffy, Phys. Rev. B 73, 165122 (2006).
- Abrikosov and Johansson (1998) I. A. Abrikosov and B. Johansson, Phys. Rev. B 57, 14 164 (1998).
- Usuda et al. (2002) M. Usuda, N. Hamada, T. Kotani, and M. van Schilfgaarde, Phys. Rev. B 66, 125101 (2002).
- Temmerman et al. (1998) W. M. Temmerman, A. Svane, Z. Szotek, and H. Winter, in Electronic Density Functional Theory: Recent Progress and New Directions, edited by J. F. Dobson, G. Vignale, and M. P. Das (Plenum Press, New York, 1998), p. 327.
- Perdew and Wang (1992) J. P. Perdew and Y. Wang, Phys. Rev. B 45, 13 244 (1992).
- Murnaghan (1944) F. D. Murnaghan, in Proceedings of the National Academy of Sciences 30, 244 (1944).
- Lloyd (1967) P. Lloyd, Proc. Phys. Soc. 90, 207 (1967).
- Zeller (2004) R. Zeller, J. Phys.: Condens. Matt. 16, 6453 (2004).
- Lambrecht et al. (1999) W. R. L. Lambrecht, S. Limpijumnong, and B. Segall, MRS Internet J. Nitride Semicond. Res. 4S1, G6.8 (1999).
- Ahuja et al. (1998) R. Ahuja, L. Fast, O. Eriksson, J. M. Wills, and B. Johansson, J. Appl. Phys. 83, 8065 (1998).
- Karzel et al. (1996) H. Karzel, W. Potzel, M. Köfferlein, W. Schissl, M. Steiner, U. Hiller, G. M. Kalvius, D. W. Mitchell, T. P. Das, P. Blaha, et al., Phys. Rev. B 53, 11425 (1996).
- Wyckoff (1963) R. W. G. Wyckoff, Crystal Structures, vol. 1 (Interscience Publishers, New York, 1963), 2nd ed.
- Sangster and Stoneham (1981) M. J. L. Sangster and A. Stoneham, Phil. Mag. B 43, 597 (1981).
- Cohen and Gordon (1981) A. J. Cohen and R. G. Gordon, Phys. Rev. B 14, 4593 (1981).
- Sangster et al. (1970) M. J. L. Sangster, G. Peckham, and D. H. Saunderson, J. Phys. C: Sol. State Phys. 3, 1026 (1970).
- Maghadam et al. (2001) N. Y. Maghadam, G. M. Stocks, X.-G. Zhang, D. M. C. Nicholson, W. A. Shelton, Y. Wang, and J. S. Faulkner, J. Phys.: Condens. Matt. 13, 3073 (2001).
- Hedin and Lundqvist (1969) L. Hedin and S. Lundqvist, in Solid State Physics, edited by F. Seitz and D. Turnbull (New York: Academic, 1969), vol. 23.
- Schönberger and Aryasetiawan (1995) U. Schönberger and F. Aryasetiawan, Phys. Rev. B 52, 8788 (1995).
- Powell et al. (1971) R. A. Powell, W. E. Spicer, and J. C. McMenamin, Phys. Rev. Lett. 27, 97 (1971).
- Vesely et al. (1972) C. J. Vesely, R. L. Hengehold, and D. W. Langer, Phys. Rev. B 5, 2296 (1972).
- Slater (1972) J. C. Slater, Advances in Quantum Chemistry 6, 1 (1972).
- Liberman (2000) D. A. Liberman, Phys. Rev. B 62, 6851 (2000).