Current affiliation: ]Department of Physics, Mississippi State University, Mississippi State, MS 39762, USA. Current affiliation: ]Cyclotron Institute, Texas AM University, College Station, Texas 77843, USA Current affiliation: ]Department of Physics, Krishnath College, Behrampore 742101, INDIA.
Study of nuclei in the vicinity of the “Island of Inversion” through fusion-evaporation reaction
Abstract
We report the first observation of high-spin states in nuclei in the vicinity of the “island of inversion”, populated via the 18O+18O fusion reaction at an incident beam energy of 34 MeV. The fusion reaction mechanism circumvents the limitations of non-equilibrated reactions used to populate these nuclei. Detailed spin-parity measurements in these difficult to populate nuclei have been possible from the observed coincidence anisotropy and the linear polarization measurements. The spectroscopy of 33,34P and 33S is presented in detail along with the results of calculations within the shell model framework.
pacs:
21.20.Lv, 23.20.En, 23.20.Gq, 21.60.Cs, 27.30.+tI Introduction
Neutron-rich nuclei are currently of great interest as they
exhibit structural properties very different from
nuclei near the -stability line. Evolving shell gaps and
disappearance of magic numbers seen in neutron-rich nuclei
challenge the conventional shell model theory. The “island of
inversion” comprised of neutron-rich isotopes of Mg, Na, and
Ne with N20 is one of the best examples of such unexpected
structure changes observed in nuclei with large neutron-proton
asymmetry.
Investigations into the extent of this island and the
transition region around it
will lead to a greater understanding of the evolution of
the structure of the atomic nucleus.
Nuclei in and around the “island of inversion” have in general been
studied using transfer/deep inelastic
reaction Fornal et al. (1994); Asai et al. ; Ollier et al. (2005); Broda (2006); Krishichayan et al. (2006),
or -decay Nathan and Alburger (1977)
or heavy ion inelastic scattering or deuteron inelastic scattering Iwasa et al. (2003).
However such non-equilibrated reactions have certain limitations, like
contamination from dominant fusion-evaporation channels, low production
cross-sections, low spin population and coincident emissions
from the binary partner. The above limitations can
be circumvented to a very large degree by using fusion-evaporation reactions with a
neutron-rich target and a neutron-rich projectile.
In this paper we present the results of a spectroscopic
investigation of nuclei in the
vicinity of the “island of inversion”(33,34P and 33S), populated
via the fusion-evaporation reaction.
II EXPERIMENTAL METHOD
33,34P and 33S nuclei were populated utilizing the 18O+18O reaction. The 18O beam at an incident energy of 34 MeV was provided by the 14 UD BARC-TIFR Pelletron facility at TIFR, Mumbai. The choice of the incident energy was determined by the earlier reported excitation function measurements Eyal and Dastrovosky (1972) which indicate a considerable cross-section for these nuclei at this incident energy. The neutron-rich 18O target was prepared by heating a 50 mg/cm2-thick Ta foil in an atmosphere of enriched Oxygen to form Ta2O5. The total 18O equivalent thickness was estimated to be 1.6 mg/cm2 on both sides of the Ta foil. The de-exciting rays were detected by an array of 7 Compton-suppressed Clover detectors placed at 30∘, 60∘, 90∘, 120∘ and 150∘ with respect to the beam direction in the median plane. An event was recorded when at least 2 Clovers fired in coincidence. A total of 1 billion such - coincidences were recorded. The data were recorded using CAMAC based data acquisition system LAMPS LAM and analyzed using IUCSORT Pattabiraman et al. (2004a, b); Pattabiraman et al. (2006) and RADWARE C. Radford (1995) software packages. The data were pre-sorted to correct for any on-line drifts to ensure that there were relatively no gain changes between any two list mode data sets within the experiment and, then, were precisely gain matched to ensure that data from each detector had a constant energy dispersion. The energy calibration was performed using radioactive sources 152Eu and 133Ba and beam-off radioactivity data. The data were sorted into symmetric and asymmetric - matrices. The genetic correlation between the de-exciting rays was established from the symmetric - matrix after background subtraction and efficiency correction. The asymmetric matrices were used to assign the spin and parity for the observed levels on the basis of angular correlation and the linear polarization measurements, as described in the next section.
III EXPERIMENTAL RESULTS
III.1 Determination of spins and parities
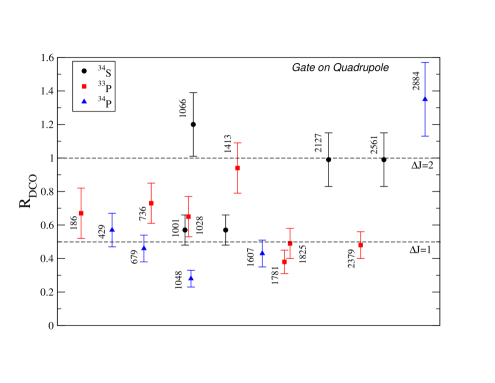
The multipolarity assignments have been performed from the observed coincidence angular correlations. Assuming pure (stretched) transition, the coincidence intensity anisotropy can be used to distinguish between J = 1 and J = 2 transitions. A qualitative assignment for the multipolarity of the -transition from the angular correlation measurements is obtained following the procedure detailed in Ref. Krane and Steffen (1970). The experimental in the present work is defined as:
| (1) |
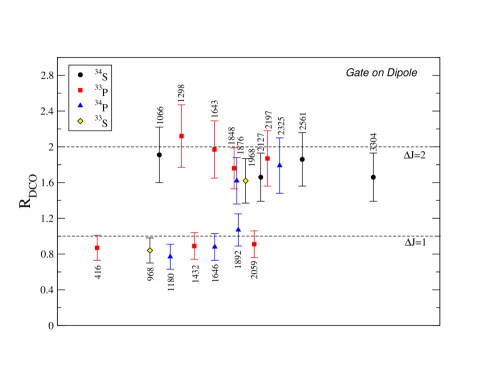
where is 300 and 1500. When the gating transition () is a stretched quadrupole transition, 1 for a pure quadrupole () and 0.5 for stretched pure dipole transition(). Similarly, a gate on a dipole transition would result in 2 for a pure quadrupole and 1 for a pure dipole transition. These intensity ratios were obtained from the angle-dependent - matrices assuming stretched transition for the gates and after incorporating necessary efficiency corrections. The experimental values determined from quadrupole and dipole gates have been plotted for several transitions belonging to 33,34P, 33,34S in Fig. 1 and Fig. 2 respectively. The present statistics did not permit us to extend these measurements to the weak transitions. As seen from the figures, it is possible to distinguish between J = 1, and J = 2 transition following the above procedure. For mixed transitions the plot essentially provides a qualitative way of determining the dominant multipolarity considering the proximity of the value to the J = 1 or the J = 2 line.
The angular correlation measurement is not sensitive to the electric or magnetic character of the radiation. The information on this was obtained from the linear polarization measurements. Clover detectors have an advantage over conventional single crystal detectors as they allow such measurements to be made.
The angular distribution of linearly polarized gamma rays from an axially oriented ensemble of nuclei is given by R. M. Steffan and K. Alder (1975); Fagg and Hanna (1959)
| (2) |
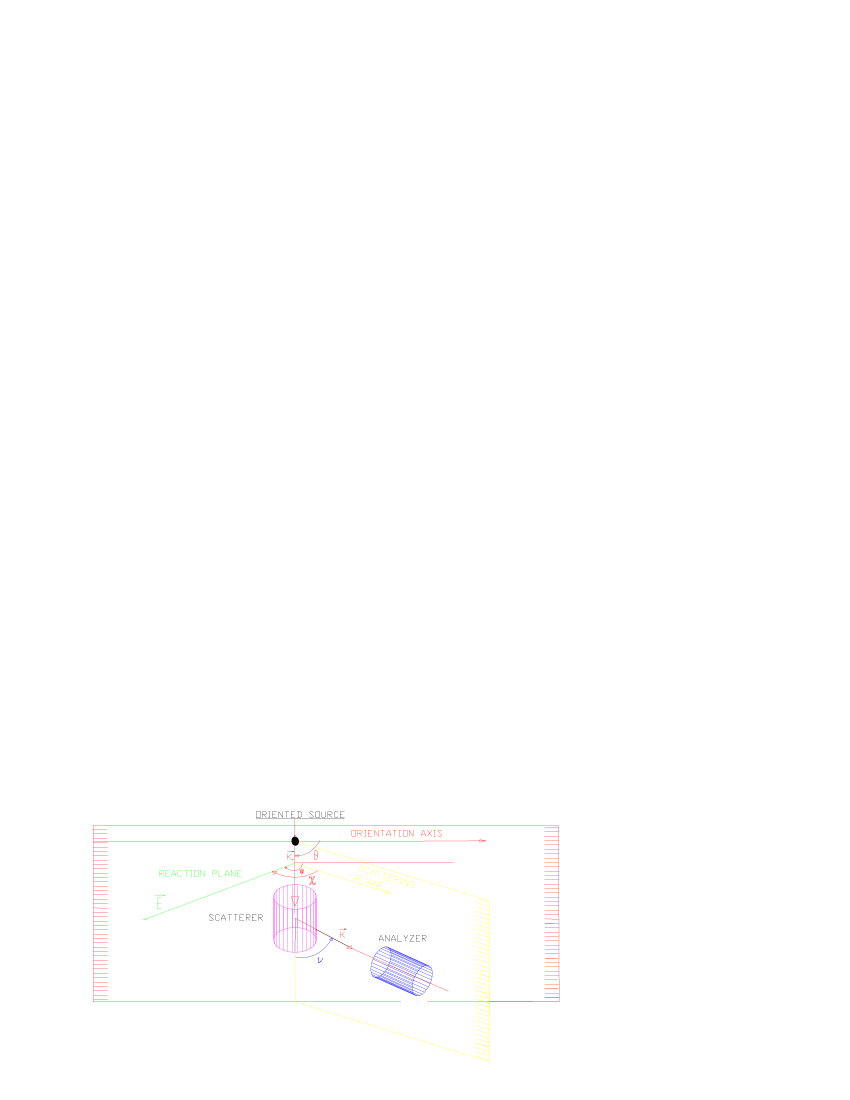
where Bλ are orientation tensors describing the degree of orientation of the parent nucleus and Uλ are deorientation coefficients. Pλ are the ordinary Legendre polynomials and P are the unnormalized associated Legendre polynomials. Aλ are angular distribution coefficients which depend on the spin of the initial and final state and the multipolarity of the -transition. The coefficients Aλ2 depend on the electromagnetic character of the radiation Deng et al. (1992). is the angle that the electric vector of the emitted quanta makes with the orientation axis and is the angle between the electric vector E of the emitted quanta and the reaction plane (Fig. 3).
The degree of linear polarization P of a ray is defined as the difference between the intensities of the radiation presenting an electric vector parallel to the reaction plane ( = 00) and that with an electric vector perpendicular to the plane ( = 900) Deng et al. (1992); Jones et al. (1995); Starosta et al. (1999):
| (3) |
where the normalization is such that
-1 P() +1.
P()= 0 for an
unpolarized -ray and has a maximum value
at = 900,
| (4) |
where a2 and a4 are the angular distribution coefficients and the H2 and H4 coefficients depend on the initial and final spin and the mixing ratio, Aoki et al. (1979); Der Mateosian and Sunyar (1974).
Experimentally linear polarization of gamma rays was detected and measured through Compton scattering Deng et al. (1992). The differential Compton scattering cross-section is given by Deng et al. (1992)
| (5) |
where r0 is the classical electron radius, is the Compton scattering angle with respect to the direction of the incident ray, and is the angle between the electric vector E of the primary radiation and the scattering plane defined by the direction of the incident and the scattered photons (Fig. 3). This cross-section is relatively high and polarization sensitive for a wide photon energy range. Maximum scattering occurs at = 900.
The Clover detectors used in the experiment acted effectively as Compton polarimeters. The detectors placed at 900 were particularly useful since polarization is maximum in that direction. Each crystal of a Clover detector acts as a scatterer and the two adjacent crystals act as the absorbers. The asymmetry between the perpendicular and parallel scattering with respect to the reaction plane distinguishes between electric and magnetic transitions. The experimental asymmetry or (IPDCO stands for “Integrated Polarizational- Directional Correlation from oriented nuclei”) at 900 between perpendicular and parallel coincidence rates is defined Starosta et al. (1999) as
| (6) |
where N⟂ and N∥ are the number of photons with a given energy scattered along the direction perpendicular and parallel to the reaction plane, respectively, in the detectors placed at 900 and in coincidence with another photon detected in at least one other detector in the array. This is called an integrated PDCO because the polarization of one quantum is measured and the information is integrated over all the possible emission directions of the accompanying coincident radiation.
“a” denotes the correction due to the asymmetry in response of the clover segments. This factor is energy dependent (a = a0+a1Eγ), and is determined using a radioactive source (having no spin alignment) under similar conditions. This correction is defined as Starosta et al. (1999); Jones et al. (1995)
| (7) |
The values for a0 and a1 for the present experimental setup were 1.00007(0.00698) and 7.8966710-7 keV-1(5.6146210-7) respectively.
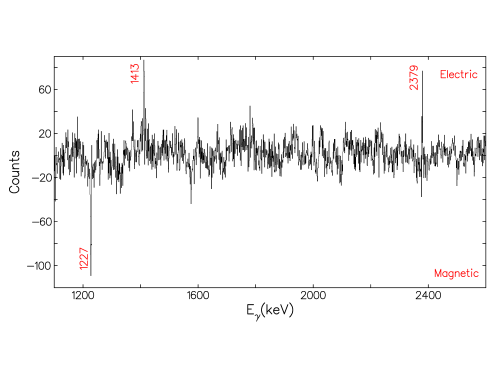
values were evaluated from asymmetric - matrices whose one axis corresponds to the perpendicular or parallel scattered events in the clovers at 900 and the other axis corresponds to the total energy recorded in any of the other detectors. Gates were put on the full energy peaks of the perpendicular and parallel matrices to obtain spectra representing either perpendicular or parallel scattering respectively, and from these, the and values were obtained for each transition. Fig. 4 is a representative background subtracted difference spectrum of perpendicular and parallel gates. The positive peaks indicate electric transitions whereas negative peaks indicate magnetic transitions.
The linear polarization is related to the asymmetry by the polarization sensitivity Q(Eγ) as Starosta et al. (1999); Jones et al. (1995)
| (8) |
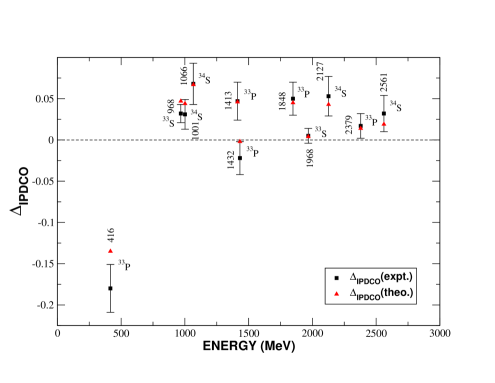
Q(Eγ) is dependent on the incident gamma-ray energy and the geometry of the polarimeter and its values, were obtained for a similar setup as reported by Palit et al. Palit et al. (2000). The theoretical polarizations were determined using eq.(4) by calculating the angular distribution coefficients , and the H2, H4 functions for each value of the multipole mixing ratio using the formalism given in Refs. Aoki et al. (1979); Der Mateosian and Sunyar (1974); Yamazaki (1967). The theoretical values were obtained from the theoretical polarization values using eq.(8), and are plotted along with the experimentally obtained values as a function of in Fig. 5 for several strong transitions in 34S, 33P and 33S. The results show a good agreement between the theoretical and experimental values. At a given energy, a positive value of the asymmetry parameter indicates an electric transition, a negative value indicates a magnetic transition and a near-zero value is indicative of an admixture.
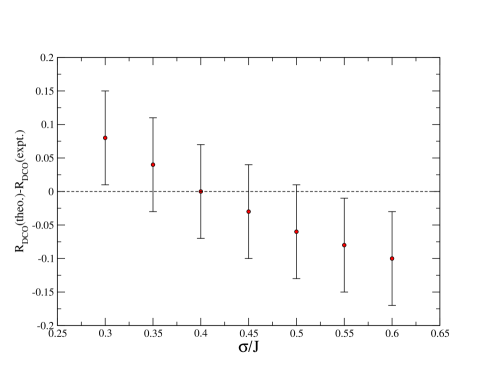
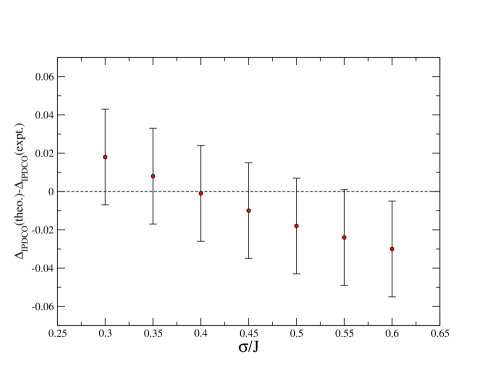
The calculation of theoretical polarization requires two inputs, viz., the width of the m-state distribution and the mixing ratios. Polarization depends significantly on the distribution of the nuclear state over its magnetic substates. When the alignment is partial, the angular distribution coefficients for complete alignment Yamazaki (1967) have to be multiplied with the attenuation coefficients as formulated by Der Mateosian and Sunyar Der Mateosian and Sunyar (1974), which depend on the factor where is the width of the distribution of the m-states, assuming a Gaussian distribution Yamazaki (1967). The choice of was made following the simultaneous analysis of the and values for several transitions of known spin and parity. Fig. 6 and Fig. 7 depict the determination of for one such transition, the 1066-keV [5- 3-, = 0] belonging to 34S. This nucleus has been populated with substantial cross-section in the present experiment and its level scheme has been extensively reported earlier by Mason et al. Mason et al. (2005). The theoretical values were obtained using the code ANGCOR Krane and Steffan (1970) as a function of . Fig. 6 represents the comparison of the theoretical values with the experimentally obtained values. As seen from the figure, a value of 0.35 - 0.45 appears to be reasonable. A similar plot has been made for the values of the same transition in Fig. 7. Here also the theoretical values agree with the experimental ones in the same range. This exercise was repeated for other transitions in 34S of known mixing ratios NND . It was observed that a value of = 0.4 consistently reproduced the observed and values and hence this value was used in all our calculations.
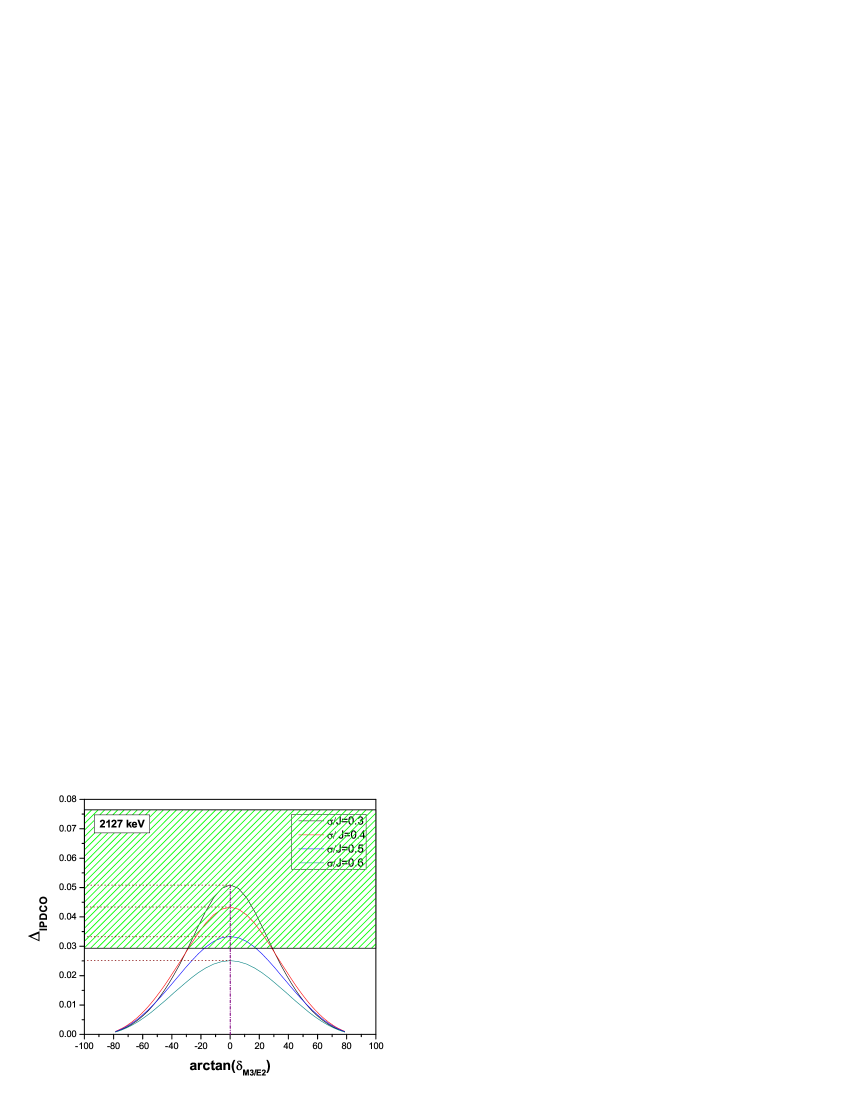
Fig. 8 shows the theoretical asymmetry values for a pure E2 transition ( = 2+ 0+) as a function of mixing ratio at different values of . The shaded area gives the range of observed values for the known 2127-keV, E2 transition (2+ 0+) in 34S. An increase in decreases polarization. At = 0.6 the theoretical values are not consistent with the experimental values. The theoretical asymmetry value at = 0 for = 0.4 lies well within the experimentally observed range. This also justifies our choice of .
The calculated and observed and values for several strong transitions in 34S, 33P and 33S are given in Table I. The and values are consistently reproduced within error bars in each case.
Wherever quantitative measurements were not possible due to insufficient statistics, parity assignment was done qualitatively from the corresponding gated perpendicular and parallel spectra. When gates were put on coincident gamma transitions and more counts were observed in the perpendicular gated spectra than in the parallel, the observed -ray was assigned an electric nature. The reverse was true for assignment of a magnetic nature. Thus the previously reported spin-parities of the levels in 33,34S and 33,34P that were observed in the present experiment, have been confirmed either quantitatively or qualitatively.
III.2 Level schemes
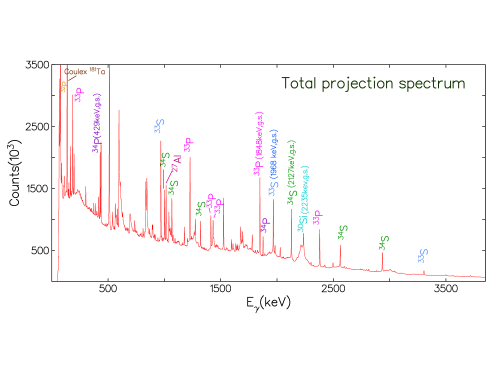
The nuclei populated in the experiment as determined from the projection spectra and supported by the beam-off radioactivity data were 34S, 33S, 34P, 33P, 32P and 30Si. Fig. 9 depicts the projection spectrum of the symmetric - matrix. The use of fusion evaporation reaction to populate the above-mentioned nuclei has clearly enhanced their production compared to deep-inelastic/transfer reactions Krishichayan et al. (2006) as is evident from Fig. 10. The comparison also shows a much cleaner and contamination free spectrum obtained in the present experiment. Moreover, higher spin states have become accessible as a result of utilizing fusion evaporation reaction mechanism.
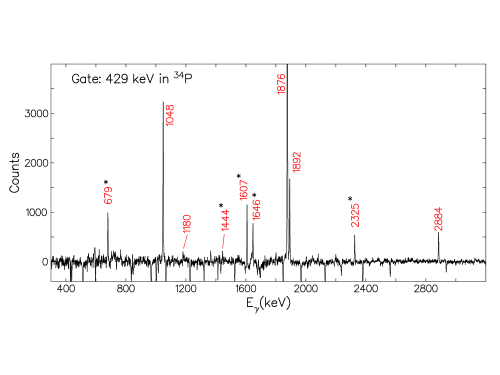
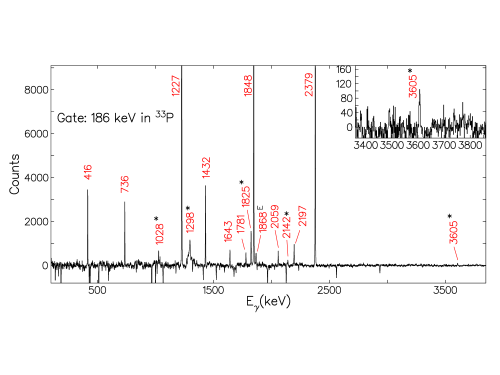
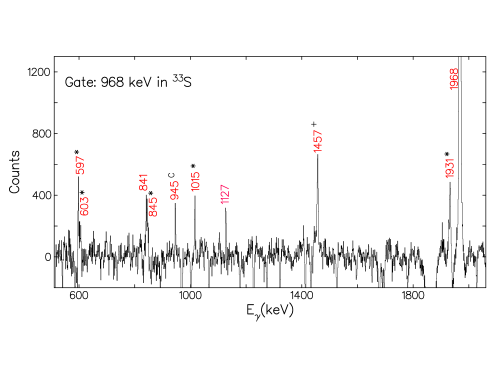
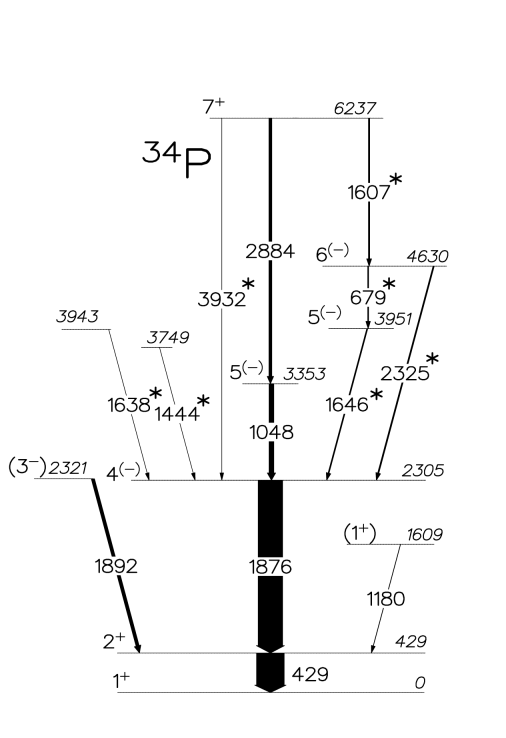
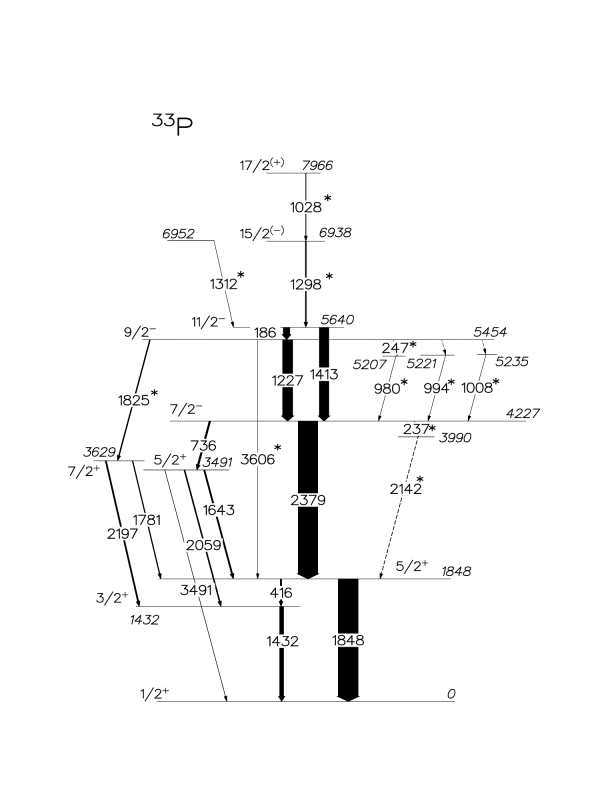
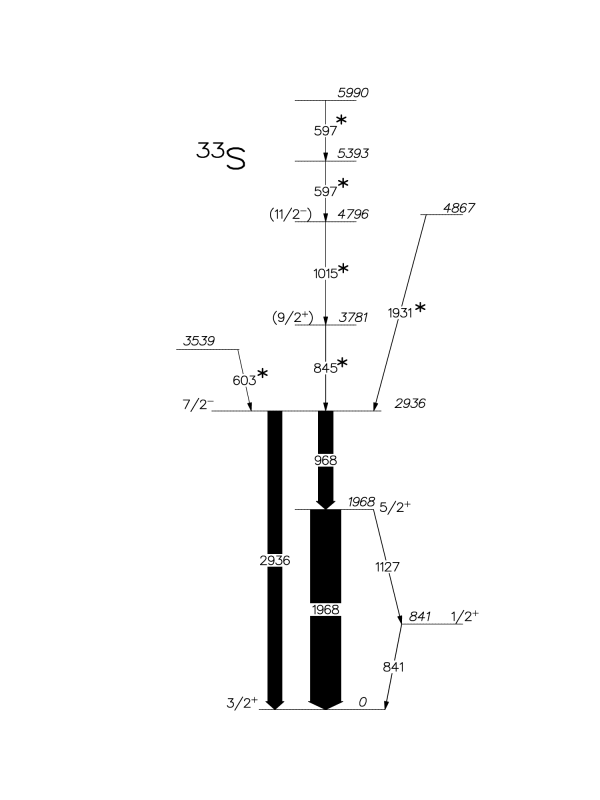
The level schemes of these nuclei have been extended with the addition of several new transitions. Figs. 11, 12 and 13 are spectra obtained by gating on the symmetric - matrix by the 429-keV, 186-keV, and 968-keV -rays belonging to 34P, 33P, and 33S, respectively. The deduced level schemes are shown in Figs. 14, 15 and 16. The energies, relative intensities and assigned multipolarities of the observed transitions, the assigned excitation energies and spin-parities of the levels, and the -ray branching ratios for decay of those levels are listed in Table II.
A quantitative measure of and/or linear polarization has not been possible for some transitions. In those cases, a qualitative assignment has been made as explained in the previous section. The multipolarities listed in TABLE II for such transitions are essentially the dominant multipolarity; the extent of mixing could not be determined. The present setup did not permit us to obtain the mixing ratios experimentally. However mixing ratio range has been deduced from the and values for some transitions in 34P, as explained later. The comparison between theoretical and experimental and values in 34S, 33P, and 33S is based on previously-reported mixing ratios (TABLE I).
III.2.1 34P
Previous investigations of the level structure of 34P employed non-equilibrated reactions to populate this difficult to access N = 19 nucleus. These studies reported different subsets of the excited levels in 34P. Ajzenberg-Selove et al. Ajzenberg-Selove et al. (1977) were the first to report the excited states of 34P at 423, 1605, 2225, 2309 and (3345) keV(10 keV) using the 34S(t,3He)34P reaction. On the other hand, 429-, 1608- and 1178-keV gamma rays were identified by both Nathan et al. Nathan and Alburger (1977) and Pritychenko et al. Pritychenko et al. (2000) in -decay and intermediate-energy Coulomb excitation measurements respectively. Pritychenko et al. Pritychenko et al. (2000) also observed a new 627-keV transition de-exciting the (2+) level at 2225 keV. However the 1608-keV and 627-keV transition were not observed in any of the subsequent investigations using transfer and deep-inelastic reactions Fornal et al. (1994); Ollier et al. (2005); Krishichayan et al. (2006). All the excited states of 34P reported by Ollier et al. Ollier et al. (2005), except the level at 4723 keV were observed in the present work. Several other strong transitions, of 679, 1444, 1607, 1638, 1646, 2325 and 3932 keV belonging to 34P have been identified and placed in the level scheme by coincidence and intensity arguments. The placements of the new transitions were also facilitated to a large extent by the observation of cross-over transitions. The 1607-keV transition was found to be in coincidence with the 429- and 1876-keV transitions and hence is different from the 1608-keV transition reported by Nathan et al. Nathan and Alburger (1977) and Pritychenko et al. Pritychenko et al. (2000). The 1046-keV transition reported by Ollier et al. Ollier et al. (2005) but not observed by Krishichayan et al. Krishichayan et al. (2006) has been observed in the present experiment, but with an energy of 1048-keV. Further, this transition exhibited a shape asymmetry at forward and backward angles, which is indicative of a lifetime of the order of a few pico-second for the 3353 keV level.
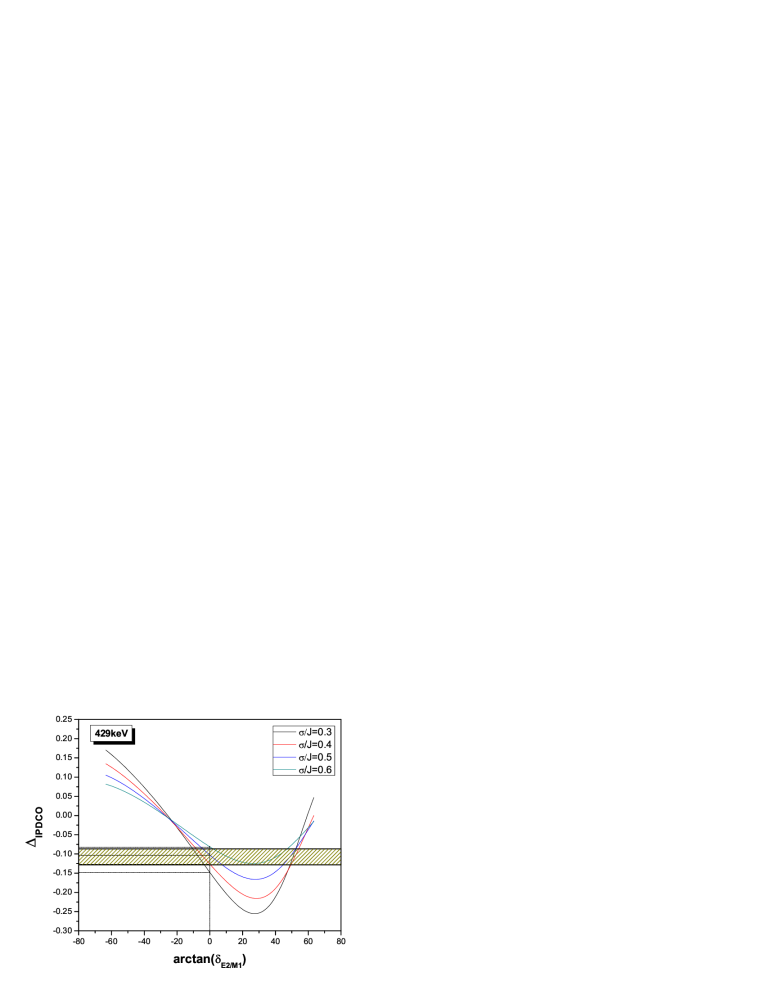
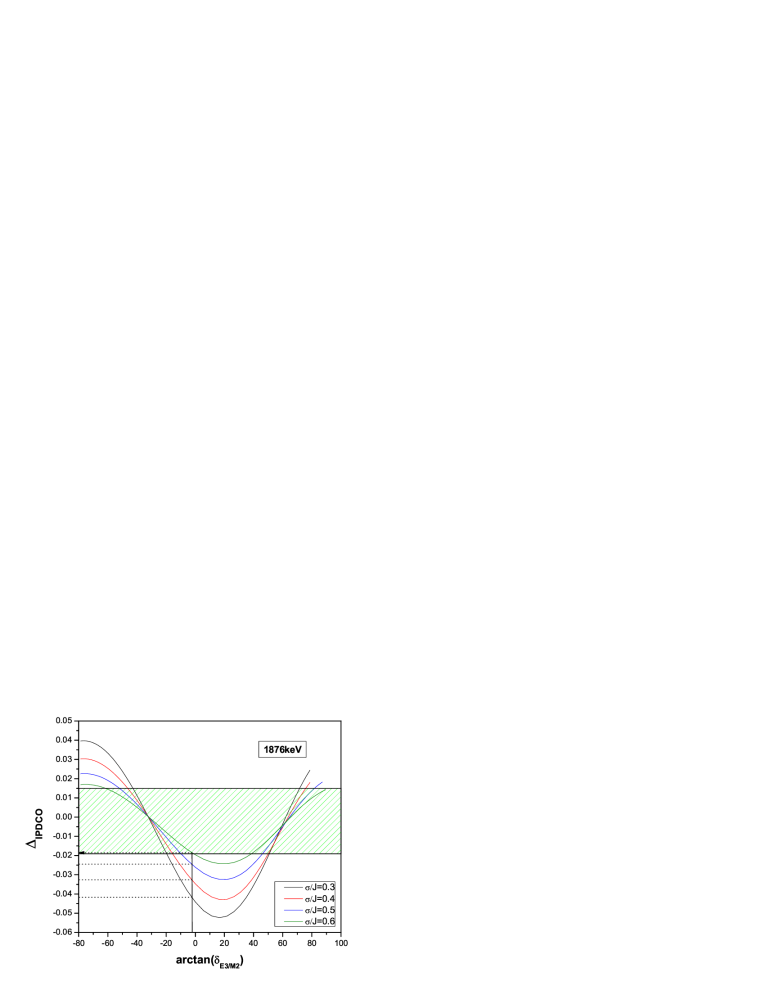
One of the main motivations of the present experiment was to undertake polarization and coincidence angular correlation measurements following fusion reaction to confirm the spin-parity assignment of the 2305-keV level in 34P. In Ref. Krishichayan et al. (2006), we had assigned = 4+ to this level, whereas it had been assigned 4- by earlier workers Ajzenberg-Selove et al. (1977); Asai et al. . The 429-keV was established as a magnetic dipole transition from the DCO and polarization analysis method described in the previous section. The 1876-keV ray de-exciting the 2305-keV level has a value 1.62(26) (Fig. 2) and linear polarization measurements yielded a near-zero value for , establishing it as a highly mixed (L = 2, L = 3) transition for the first time (Fig. 19). This is also evident from the difference between the 429-keV gated perpendicular and parallel scattering spectra (Fig. 17), where the number of counts under 1876 keV peak is nearly zero. In such cases, the polarization measurements cannot distinguish between M2/E3 and E2/M3 mixing. Fig. 18 depicts the theoretical asymmetry curves for 2+ 1+ M1/E2 radiation as a function of mixing ratio, at different values of . The shaded area represents the experimental dispersion in of the 429-keV ray. At = 0.4, the theoretical values are consistent with experimental values over the range -8 arctan() 00 and 49 arctan() 540. However, as seen from Fig. 18, the mixing ratio predicted by the shell model (as detailed in the subsequent section and indicated by the vertical dotted line) limits the value to the former range. We have similarly plotted the theoretical asymmetry values for a M2/E3 mixing 4- 2+ as a function of mixing ratio, at different values of (Fig. 19). The shaded area on this graph represents experimental range of for the 1876-keV transition. The theoretical values are consistent with the experimental values over the range -46 arctan() -150 and 50 arctan() 760 for = 0.4. The latter range of very large mixing ratios being physically unreasonable, has not been considered. When we repeated this exercise considering a E2/M3 mixing, we obtained almost the same ranges of mixing ratios. Thus an unambiguous identification of the 1876-keV transition as M2/E3 or E2/M3 is not possible following this procedure. The value at = 0.4 corresponding to the mixing ratio predicted by the shell model calculations (Section IV) does not lie within the aforementioned ranges in both cases. This mismatch has been discussed in detail in the subsequent section.
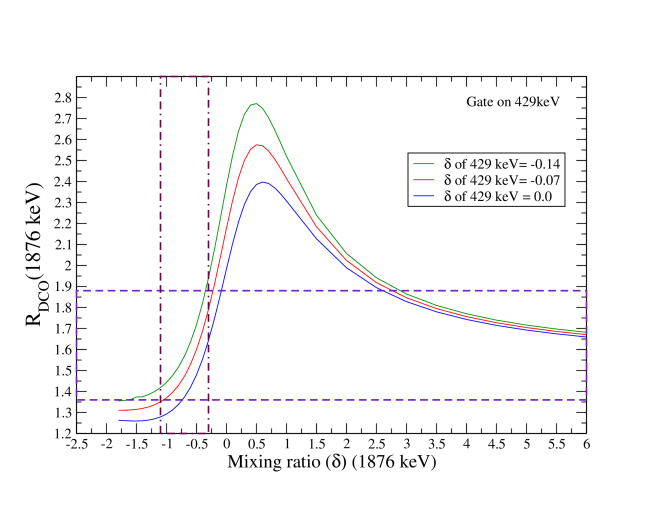
Fig. 20 shows the variation of theoretical for the 1876-keV -ray as a function of its mixing ratio when the gate is on the 429-keV, the ground state transition. The three plots correspond to the three values of 429 [ -0.14 -0.07 0.0] that were determined earlier from Fig. 18. The theoretical values were computed using ANGCOR Krane and Steffan (1970). The horizontal lines mark the experimental range of values for the 1876-keV transition, while the vertical lines indicate the range of mixing ratios for this transition as obtained from Fig. 19. As is evident from the graph, the mixing ratio range obtained from the analysis of the linear polarization measurements is also consistent with the angular correlation measurements. Thus, both these measurements are indicative of -1.03 -0.27.
Asai et al. Asai et al. have reported the lifetime of the level at = 2.305 MeV as 0.3 ns 2.5 ns. Combining this lifetime measurement with the mixing ratio range, that we have obtained for 1876-keV, we have calculated the experimental reduced transition probabilities assuming both M2/E3 and E2/M3 mixing. The calculations are presented in TABLE III. As is evident from the table, the lifetime measurements lead to unacceptable M3 strengths Skorka et al. (1966). This supports an M2/E3 assignment for the 1876-keV transition and = 4(-) to the 2305 keV level. This needs to be confirmed with precise lifetime measurements, however.
The qualitative linear polarization measurements for the 1607-, 1646-, 679- and 2325-keV transitions indicate an electric nature for them. The spin-parity assignments for the levels de-exciting via these transitions are based on the assumption of = 4(-) for the 2305-keV level.
III.2.2 33P
This work reports the first polarization measurement for 33P populated in a heavy-ion fusion reaction. The earlier light-ion induced reaction investigations had established the level structure up to a spin of Jπ= 11/2- and Ex 5.6 MeV Nixon et al. (1975). We have been able to extend the yrast sequence up to Jπ= 17/2(+) and Ex 8 MeV due to the observation of two new transitions of energy 1298 keV (E2) and 1028 keV (M1). The multipolarities of these two transitions were assigned as quadrupole and dipole, respectively, on the basis of the observed values. The parity measurements have been shown as tentative since only qualitative measurements were possible. The 1028-keV transition was identified as a magnetic transition due to its preferential scattering in the parallel direction as observed in 1298-keV gated perpendicular and parallel spectra. On the other hand, the 1298-keV transition was assigned an electric nature due to its preferential scattering in perpendicular direction. A full Doppler shift has been observed in the 1298-keV transition and hence, the lifetime of the 6938 keV level is expected to be much less as compared to the stopping time (pico-second). Apart from these, several other new transitions, with energies (in ascending order) of 237, 247, 980, 994, 1008, 1312, 1825 (D), 2142 (Q) and 3605 keV were observed and placed in the decay scheme. The present statistics did not permit us to observe the weak transition to the Ex 5221-keV from the level at 5454 keV. We have also observed 1170- and 880-keV transitions which could not be placed in the decay scheme. It is worth mentioning that the single- (1868 keV) and double-escape (1358 keV) peaks corresponding to the 2379-keV transition were observed and the intensity of this -ray reported in TABLE II was obtained from the sum of the counts under the full photopeak and the two escape peaks. This was done as our efficiency measurements (performed with a 152Eu source) did not have data points in this energy region where escape contribution becomes significant.
III.2.3 33S
Prior to this experiment 33S has been studied via light ion reactions Sterrenburg et al. (1997). In this experiment, the level scheme of 33S was extended with the addition of 6 new transitions of energy 597, 597, 603, 845 (E1), 1015 (E1) and 1931 keV respectively. The presence of a 597-keV transition in the 597-keV gated spectrum is indicative of a doublet. As a result it was not possible to determine their individual intensities and the spin parity of the excited states that de-excite via these two transitions. The qualitative polarization and angular correlation measurements for the 845-keV and the 1015-keV transitions indicate that these are dipoles and electric in nature. Such sequences of electric transitions have been reported in neighbouring nuclei like 32P NND . The 1931-keV transition exhibits the fully Doppler shifted peak indicating a short lifetime ( pico-second, the stopping time) for the level at 4867 keV. The present polarization and angular correlation measurements confirmed the previously assigned spin-parity of the 1968- and 2936-keV levels. The reported mixing ratios are consistent with the results of the present measurement (TABLE I).
IV THEORETICAL RESULTS
Shell model calculations using the code NuShell@MSU Brown and Rae (2007) were performed to interpret the observed level structures of 33,34P and 33S. The valence space consisted of the , , , , , and orbitals outside a 16O core. The “sdpfmw” interaction, taken from the Warburton, Becker, Millener, and Brown (WBMB) sd-pf shell Hamiltonian Warburton et al. (1990), was used.
In 34P the positive-parity states 1+ and 2+, which are expected to be dominated by the pure sd configurations, are well reproduced within the full sd-space shell model calculations (0) (using the sdpfmw interaction) and are consistent with the sd calculation of Brown Brown . The predicted binding energy of the ground state is -191.971 MeV, which matches very well with the experimental value -192.04 MeV Brown . The mixing ratio of the 429-keV transition predicted by shell model is -0.0024, which is also within the range determined from our polarization measurements.
Excitations of nucleons from sd shell into fp shell are essential to explain the negative-parity states (minimum 1 particle in the fp shell) as well as the high-spin, positive-parity states (minimum 2 particles in the fp shell). Due to computational limitations, unrestricted calculations were not possible and only one particle could be excited to the pf shell (1).
It has been reported by several authors that there is an overestimation of the sd-pf gap in the corresponding interaction which required the lowering of the single-particle energies of the f and p orbitals Ionescu-Bujor et al. (2006); Mason et al. (2005). No such attempt was made in the present calculation.
Fig. 21 shows a the comparison between the calculated and the experimental levels in 34P. The 7+ state predicted by the shell model is at a very high excitation energy (11366 keV) and hence has not been included in the figure. As seen from Fig. 21, the high-spin positive-parity states are much higher in excitation energy than the corresponding experimental levels. This is likely due to our inability to excite more than one particle into the fp shell. There is a reasonable agreement in excitation energy between the = 4-, 5-, 6- levels predicted by shell model and the observed 2305-, 3353- and 4630- keV levels, respectively. Thus, the theory corroborates our spin-parity assignments at least for the negative-parity states. However, the above shell model calculations failed to predict the mixed nature of the 1876-keV transition established from our polarization measurements. The shell model predicts an almost pure M2 nature for this transition [ = -0.034]. The B(M2) and B(E3) values obtained from shell model are 0.1816 W.u. and 0.2167 W.u., respectively, and, as seen from Table II, the B(E3) values are heavily under predicted, clearly reflecting this mismatch. We have also performed similar shell model calculations for the neighbouring N = 19 isotones viz., 37Ar and 35S where similar M2/E3 mixed transitions are reported (1611 keV ( = 7/2- 3/2- in 37Ar) and 1911 keV ( = 7/2- 3/2- in 35S) NND . The results are summarized in TABLE IV. In all cases, the calculations predict very little mixing, unlike the experimental observations. The E3 transition strengths are several orders of magnitude higher than the corresponding shell model predictions. Clearly, there is a need to perform these calculations with a better Hamiltonian encompassing a realistic cross-shell interaction, and/or with a more complete wave function incorporating configurations arising from multi-particle excitations into the fp orbitals.
The 0 calculations for 33P and 33S reproduces the low-spin positive-parity states. However, the 1 calculations fail to generate the first experimentally-observed negative- parity state, 7/2-, in both nuclei. The predicted energies of the high-spin, negative-parity states are higher than the experimental values by several MeV.
V CONCLUSIONS
The level structure of the generally difficult to access nuclei 33,34P and 33S has been investigated using heavy-ion fusion reaction which has resulted in a substantial enhancement in their production cross-sections. The level schemes of these nuclei have been considerably extended. Spin-parity assignments have been made following a consistent analysis of both the coincidence angular correlation and linear polarization data. The results indicate that the 1876-keV transition de-exciting the 2305-keV level in 34P is a mixed transition and plausibly has a M2/E3 admixture; however precise lifetime measurements would be required to confirm this assignment unambiguously. The shell model calculations emphasize the need for detailed microscopic calculations to understand the observed level sequences and mixing ratios. The deformed shell model could provide an insight into the observed level structures due to the occupation of deformation-driving orbitals such as .
VI ACKNOWLEDGEMENTS
The authors would like to thank all the participants who have helped set up the Clover array at TIFR. The help and co-operation received from Mr Kaushik Basu of UGC-DAE CSR during the experiment is gratefully acknowledged. We would like to thank the BARC-TIFR Pelletron staff for their excellent support during the experiment. We are thankful to Mr. J. P. Greene, ANL, U.S.A, for the 18O target. Thanks are also due to Dr. W. P. Tan and Dr. Larry Lamm, Univ. of Notre Dame, U.S.A, for providing us the enriched 18O cathode. Special thanks to Prof. Alex Brown for the indepth discussions and his views and comments on Shell model calculations.
References
- Fornal et al. (1994) B. Fornal et al., Phys. Rev. C 49, 2413 (1994).
- (2) M. Asai, T. Ishii, A. Makishima, M. Ogawa, and M. Matsuda, eprint Proceedings of the Third International Conference on Fission and Properties of Neutron-Rich Nuclei, edited by J. H. Hamilton, A. V. Ramayya, H. K. Carter (World Scientific, Singapore, 2002) pp. 295-297.
- Ollier et al. (2005) J. Ollier et al., Phys. Rev. C 71, 034316 (2005).
- Broda (2006) R. Broda, J. Phys. G: Nucl. Part. Phys. 32, R151 (2006).
- Krishichayan et al. (2006) Krishichayan et al., Eur. Phys. J. A 29, 151 (2006).
- Nathan and Alburger (1977) A. M. Nathan and D. E. Alburger, Phys. Rev. C 15, 1448 (1977).
- Iwasa et al. (2003) I. Iwasa et al., Phys. Rev. C 67, 064315 (2003).
- Eyal and Dastrovosky (1972) Y. Eyal and I. Dastrovosky, Nucl. Phys. A 179, 594 (1972).
- (9) LAMPS, http://www.tifr.res.in/~pell/lamps.html#.
- Pattabiraman et al. (2004a) N. S. Pattabiraman, S. N. Chintalapudi, and S. S. Ghugre, Nucl. Instrum. Methods Phys. Res. A, 526, 432 (2004a).
- Pattabiraman et al. (2004b) N. S. Pattabiraman, S. N. Chintalapudi, and S. S. Ghugre, Nucl. Instrum. Methods Phys. Res. A, 526, 439 (2004b).
- Pattabiraman et al. (2006) N. S. Pattabiraman, S. S. Ghugre, S. K. Basu, U. Garg, S. Ray, A. K. Sinha, and S. Zhu, Nucl. Instrum. Methods Phys. Res. A, 562, 222 (2006).
- C. Radford (1995) D. C. Radford, Nucl. Instrum. Methods Phys. Res. A, 361, 297 (1995).
- Krane and Steffen (1970) K. S. Krane and R. M. Steffen, Phys. Rev. C 2, 724 (1970).
- R. M. Steffan and K. Alder (1975) R. M. Steffan and K. Alder, The Electromagnetic Interaction in Nuclear Spectroscopy (North-Holland, Amsterdam, 1975).
- Fagg and Hanna (1959) L. W. Fagg and S. S. Hanna, Rev. Mod. Phys. 31, 711 (1959).
- Deng et al. (1992) J. K. Deng, W. C. Ma, J. H. Hamilton, A. V. Ramayya, J. Rikovska, N. J. Stone, W. L. Croft, R. B. Piercey, J. C. Morgan, and P. F. Mantica, Jr., Nucl. Instrum. Methods Phys. Res. A, 317, 242 (1992).
- Jones et al. (1995) P. M. Jones, L. Wei, F. A. Beck, P. A. Butler, T. Byrski, G. Duchêne, G. de France, F. Hannachi, G. D. Jones, and B. Kharraja, Nucl. Instrum. Methods Phys. Res. A, 362, 556 (1995).
- Starosta et al. (1999) K. Starosta et al., Nucl. Instrum. Methods Phys. Res. A, 423, 16 (1999).
- Aoki et al. (1979) T. Aoki, K. Furuno, Y. Tagishi, S. Ohya, and J. Ruan, At. Data. Nucl. Data. Tables 23, 349 (1979).
- Der Mateosian and Sunyar (1974) E. Der Mateosian and A. W. Sunyar, At. Data. Nucl. Data. Tables 13, 391 (1974).
- Palit et al. (2000) R. Palit, H. C. Jain, P. K. Joshi, S. Nagaraj, B. V. T. Rao, S. N. Chintalapudi, and S. S. Ghugre, Pramana 54, 347 (2000).
- Yamazaki (1967) T. Yamazaki, Nucl. Data. A 3, 1 (1967).
- Mason et al. (2005) P. Mason et al., Phys. Rev. C 71, 014316 (2005).
- Krane and Steffan (1970) K. S. Krane and R. M. Steffan, Phys. Rev. C 2, 724 (1970).
- (26) NNDC Online Data Service, http://www.nndc.bnl.gov.
- Ajzenberg-Selove et al. (1977) F. Ajzenberg-Selove, E. R. Flynn, S. Orbesen, and J. W. Sunier, Phys. Rev. C 15, 1 (1977).
- Pritychenko et al. (2000) B. V. Pritychenko, T. Glasmacher, B. A. Brown, P. D. Cottle, R. W. Ibbotson, K. W. Kemper, and H. Scheit, Phys. Rev. C 66, 051601(R) (2000).
- Skorka et al. (1966) S. J. Skorka, J. Hertel, and T. W. Retz-Schmidt, Nucl. Data. A 2, 347 (1966).
- Nixon et al. (1975) M. R. Nixon, G. D. Jones, P. R. G. Lornie, A. Nagel, P. J. Nolan, H. G. Price, and P. J. Twin, J. Phys. G: Nucl. Phys. 1, 430 (1975).
- Sterrenburg et al. (1997) W. A. Sterrenburg, G. Van Middlekoop, and F. E. H. Van Eijkern, Nucl. Phys. A 275, 48 (1997).
- Brown and Rae (2007) B. A. Brown and W. D. M. Rae, MSU-NSCL Report (2007).
- Warburton et al. (1990) E. K. Warburton, J. A. Becker, and B. A. Brown, Phys. Rev. C 41, 1147 (1990).
- (34) B. A. Brown, http://www.nscl.msu.edu/~brown/resources/SDE.HTM#a34t2.
- Ionescu-Bujor et al. (2006) M. Ionescu-Bujor et al., Phys. Rev. C 73, 024310 (2006).
- Wagner et al. (1973) P. Wagner, J. P. Coffin, M. A. Ali, D. E. Alburger, and A. Gallmann, Phys. Rev. C 7, 2418 (1973).
- Ragan et al. (1969) C. E. Ragan, C. E. Moss, R. V. Poore, N. R. Roberson, G. E. Mitchell, and D. R. Tilley, Phys. Rev. 188, 1806 (1969).
| Mixing ratio | |||||
| keV | ()from NNDC | Experimental | Theoretical | Experimental | Theoretical |
| 34S | |||||
| 2127 | 0.0 | 0.053(24) | 0.043 | 1.00 | |
| 2561 | 0.0 | 0.032(22) | 0.019 | 0.99(6) | 1.00 |
| 1001 | -0.05 | 0.032(19) | 0.051 | 0.57(3) | 0.49 |
| 1066 | 0.0 | 0.068(25) | 0.067 | 1.20(7) | 1.20 |
| 33P | |||||
| 1848 | -0.03 | 0.050(20) | 0.045 | 1.76(34) | |
| 1432 | -0.60 | -0.022(20) | -0.002 | 0.89(6) | |
| 416 | 0.09 | -0.188(29) | -0.135 | 0.87(6) | |
| 2379 | 0.01 | 0.017(15) | -0.014 | 0.48(10) | 0.49 |
| 1413 | 0.0 | 0.048(10) | 0.046 | 0.94(6) | 1.01 |
| 33S | |||||
| 968 | -0.02 | 0.032(11) | 0.047 | 0.84(6) | |
| 1968 | -0.56 | 0.005(9) | 0.004 | 1.51(18) | 1.67 |
| 111 The quoted energies are within 1 keV. | Multipolarity | Branching ratios | |||||
| Present work | Previous work | ||||||
| 33P | |||||||
| 186.2 | 5640 | 33.2(12) | (M1) | 41.0(18) | 462b | ||
| 237.0 | 4227 | ||||||
| 247.0 | 5454 | weak | |||||
| 416.4 | 1848 | 6.95(22) | M1+E2 | 6.50(28) | 74a | ||
| 736.2 | 4227 | 8.25(27) | (E1) | 7.76(34) | 112b | ||
| 979.5 | 5207 | ||||||
| 993.7 | 5221 | (D) | |||||
| 1008.0 | 5235 | ||||||
| 1028.3 | 7966 | 2.18(8) | (E1) | ||||
| 1226.8 | 5454 | 50.2(16) | (M1) | 91.5(40) | 100b | ||
| 1298.1 | 6938 | 5.45(19) | (E2) | ||||
| 1311.5 | 6952 | (D) | |||||
| 1412.6 | 5640 | 47.8(16) | E2+M3 | 59.0(24) | 542b | ||
| 1432.1 | 1432 | 18.95 | M1+E2 | 100 | 100a | ||
| 1642.7 | 3491 | 6.93(25) | Q | 54.1(24) | 622a | ||
| 1780.5 | 3629 | 3.86(15) | (M1) | 36.9(17) | 283a | ||
| 1825.1 | 5454 | 4.68(15) | D | 8.5(37) | |||
| 1848.1 | 1848 | 100(3) | E2+M3 | 93.5(39) | 934a | ||
| 2058.8 | 3491 | 5.25(19) | (M1) | 41.0(18) | 384a | ||
| 2141.6 | 3990 | 1.45(7) | (Q) | ||||
| 2196.5 | 3629 | 6.60(21) | (E2) | 63.1(25) | 723a | ||
| 2378.8 | 4227 | 98.0(30) | E1+M2 | 92.2(39) | 892a | ||
| 3606.0 | 5454 | (M2) | |||||
| 3491.1 | 3491 | 0.62(3) | (E2) | 4.84(26) | 4a | ||
| 34P | |||||||
| 429.4 | 429 | 100(3) | M1+E2 | 100 | |||
| 679.4 | 4630 | 3.17(16) | (M1) | 42.9(31) | |||
| 1047.8 | 3353 | 17.10(91) | (M1) | ||||
| 1179.8 | 1609 | 0.74(10) | (M1) | ||||
| 1443.7 | 3749 | ||||||
| 1607.1 | 6237 | 4.50(45) | (E1) | 40.5(41) | |||
| 1646.2 | 3951 | 3.60(43) | (M1) | ||||
| 1637.7 | 3943 | ||||||
| 1876.1 | 2305 | 88.6(11) | (M2+E3) | 100 | |||
| 1891.6 | 2321 | 11.28(88) | (E1+M2) | ||||
| 2325.1 | 4630 | 4.22(30) | (E2) | 57.1(48) | |||
| 2884.3 | 6237 | 6.61(40) | (M2) | 59.5(48) | |||
| 3931.7 | 6237 | ||||||
| 33S | |||||||
| 597.0 | 5990 | ||||||
| 597.0 | 5393 | ||||||
| 602.5 | 3539 | 0.11(1) | |||||
| 841.1 | 841 | 0.63 | (M1+E2) | ||||
| 845.1 | 3781 | 0.67(3) | (E1) | ||||
| 968.4 | 2936 | 48.5(17) | E1+M2 | 51.0(23) | 50c | ||
| 1015.3 | 4796 | 0.37(2) | (E1) | ||||
| 1126.5 | 1968 | 0.63(2) | (E2) | 0.63(3) | 1.5c | ||
| 1931.2 | 4867 | 0.62(3) | |||||
| 1967.6 | 1968 | 100(3) | M1+E2 | 99.4(42) | 100c | ||
| 2935.6 | 2936 | 46.7(16) | (M2+E3) | 49.0(27) | 50c | ||
| Half-life | Mixing ratio | Reduced transition probabilities | |||||||||||
| ns | () | M2/E3 | E2/M3 | ||||||||||
| -1.03 | 0.207 | 372.681 | 0.006 | 12520.654 | |||||||||
| 0.3 | -0.27 | 0.397 | 49.191 | 0.012 | 1652.638 | ||||||||
| -1.03 | 0.025 | 44.722 | 0.001 | 1502.478 | |||||||||
| 2.5 | -0.27 | 0.048 | 5.903 | 0.001 | 198.317 | ||||||||
| [keV] | [ns] | B(M2) [W.u.] | B(E3) [W.u.] | ||
|---|---|---|---|---|---|
| Expt. Theo. | Expt. Theo. | from NNDC | Expt. Theo. | Expt. Theo. | Expt. Theo. |
| 35S | |||||
| 1911 2738 | 1911 2738 | 1.02(5) | -0.19(8) -0.05 | 0.088(5) 0.196 | 4.62 0.38 |
| 37Ar | |||||
| 1611 2680 | 1611 2680 | 4.37(9) | -0.12(1) -0.08 | 0.058(13) 0.112 | 1.7(3) 0.50 |