Observation of beam loading in a laser-plasma accelerator
Abstract
Beam loading is the phenomenon which limits the charge and the beam quality in plasma based accelerators. An experimental study conducted with a laser-plasma accelerator is presented. Beam loading manifests itself through the decrease of the beam energy, the reduction of dark current and the increase of the energy spread for large beam charge. 3D PIC simulations are compared to the experimental results and confirm the effects of beam loading. It is found that, in our experimental conditions, the trapped electron beams generate decelerating fields on the order of 1 GV/m/pC and that beam loading effects are optimized for trapped charges of about 20 pC.
The concept of laser wakefield accelerator, as first developed by Tajima and Dawson [1] relies on the excitation of a longitudinal plasma wave by the ponderomotive force of a laser pulse. The driven electric field, exceeding hundreds of GV/m, can be used to accelerate electrons to relativistic energies in a millimeter scale. Over the past few years, this compact acceleration technique has made remarkable progress, producing quasi mono-energetic electron bunches at the 100 MeV level [2, 3, 4] and then up to the GeV [5], as well as increasing stability and tunability [6].
A fundamental limit of these accelerators is due to the field perturbation driven by the accelerated electron bunch itself. Indeed, when a bunch of electrons is accelerated, it drives a plasma oscillation which can cancel out the laser wakefield. This phenomenon, known as “beam loading”, ultimately limits the charge that can be accelerated since for a given charge, the longitudinal field will no longer be accelerating over the whole bunch length. Before reaching this limit, beam loading also impacts the beam quality since the trailing electrons of the bunch witness the superposition of the laser wakefield and the plasma wave driven by the leading electrons of the bunch. Therefore, when the bunch is carefully shaped, the total electric field can be made constant over the bunch length, which minimizes the energy spread [7, 8, 9]. However, when uncontrolled, this fast varying beam loading field might lead to an undesirable growth of the energy spread. This effect is therefore of major importance for designing the next generation of laser plasma accelerators delivering a high quality electron source.
In this letter we give, to our knowledge, the first experimental observation of beam loading in a laser-plasma accelerator. To obtain those conclusive evidences, we have used an optical scheme to control the injection of electrons [10]. In this scheme, electrons gain momentum in the ponderomotive beatwave created by the collision of the main laser pulse (pump pulse) with a second laser pulse (injection pulse) [6, 11], and therefore have enough energy to be trapped in the wakefield. This injection mechanism has proven to inject electrons in a stable and reproducible manner [6, 12]. Moreover, by decoupling the injection and acceleration processes, it is possible to gain control over electron beam parameters by only changing the injection pulse parameters [13]. It therefore enables us to load various charges in the plasma wakefield without changing the laser driving the plasma wave, nor the plasma parameters.
The experiment was conducted with the LOA “Salle jaune” Ti:Sa laser system, that delivers two linearly polarized pulses of 30 fs. The pump pulse is focused to an intensity of , giving a normalized amplitude of . The injection pulse is focused to a maximal intensity of , giving a normalized amplitude of . A half-wave plate followed by a polarizer enables us to continuously reduce the injection pulse intensity. We used a 3 mm supersonic Helium gas nozzle with a 2.1 mm well defined density plateau at electron density ; the gas was fully ionized early in the interaction. Electrons are injected at the collision of the two laser pulses colliding at an angle of , either or before the center of the nozzle, and are accelerated over the remaining length of plasma i.e. 1.45 mm and 1.3 mm respectively. They are then deflected by a dipole magnet of 1.1 T over 10 cm before hitting a LANEX screen, which gives access to the spectral information of the electron bunch above 45 MeV [14].
As stated before, beam loading can manifest itself through a correlation between the bunch energy spread and charge. In our experiments, we have changed the loaded charge by changing , which also affects the initial volume of electrons in phase space (injection volume) and thus directly leads to a change of energy spread [13]. Disentanglement of the two processes would require extensive use of simulations for which the energy spread is unfortunately the observable less robust to initial parameters fluctuations. Thus, in this paper, we have concentrated on other means to experimentally observe beam loading.
Beam loading reduces the energy of the trailing electrons of the bunch since they experience the field perturbation of the leading electrons. Therefore, through beam loading, the mean energy and peak energy of the electron bunch should be correlated with the load.
The inset of Fig.1 represents the electron spectra obtained with three different injection amplitudes. It clearly shows a decrease of energy with increasing injection amplitude and beam charge. Here, the peak energy of the quasi mono-energetic component goes from 197 MeV, for an injected charge of 8 pC (), to 151 MeV, for a charge of 38 pC ().
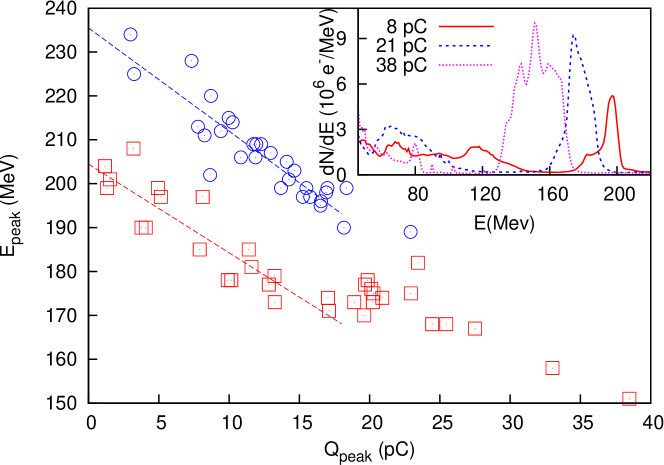
To represent more data and give statistically clearer results, we represent in Fig.1 the peak-energy versus the charge of the quasi mono-energetic peak for two complete data sets. One set of data (circles) is obtained by looking at the fluctuations of charge and spectra over 30 shots, for which the only variations are the laser intensity and pointing fluctuations at the collision position of before the center of the nozzle (). The other set of data (squares) is obtained for injection at by varying , and thus forcing a change of trapped charge in the first bucket over a wider range. Those curves clearly confirm the strong correlation between trapped charge and energy. These data points also exhibit, for small charges, a linear slope (dashed lines). When normalized by the acceleration length, those slopes are similar: 1.6 GV/m/pC for injection at (circles),1.55 GV/m/pC for injection at (squares).
The inset of Fig.1 also gives a typical evolution of the energy spread. For small loads, the energy spread stays small and in this case, close to the spectrometer resolution (5 %). For higher loads, here above 25 pC, the energy spread grows fast and substructures appear in the quasi mono-energetic component of the spectrum.
Another possible way to diagnose beam loading is to monitor the charge trapped in the trailing plasma buckets. Those electrons, also heated in the beat-wave, are not trapped in the first bucket mainly because of wakefield inhibition [15], but they can be trapped in the following periods of the plasma wave and they are accelerated to lower energies. However, as the load of the first bucket also damps the field in the trailing plasma buckets, beam loading should prevent the trapping of large charge after the first bucket and therefore reduce the dark current of the accelerator.
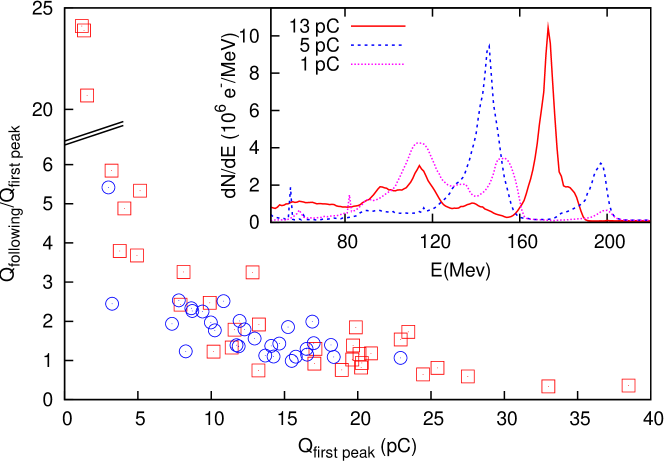
The inset in Fig.2 represents spectra with low injected charges. Whereas for a peak charge of most electrons are contained in the high energy peak, the dark current increases when the peak charge is smaller. Fig.2 represents the ratio versus , where is the charge in the high energy peak and is the charge in the rest of the distribution (above 45 MeV). This ratio represents a measurement of relative the dark current, and it clearly decreases with the charge trapped in the first peak, as expected from the beam loading effects.
These experimental observations reveal the effects of beam loading but simulations are needed to fully test this interpretation and exactly understand the role of the variation of the injection volume which might also change the energy of the electron bunch. To model the experiment, 3D particle in cell (PIC) simulations have been performed with the code CALDER [16] for similar parameters: a normalized amplitude of and an electron density for a collision position which gives a trapped charge similar to the experimental results [17]. Simulations are performed for different values of the injection pulse intensity but, to limit the computational time, the simulations are stopped only after injection, resulting in limited acceleration, typically to 70 MeV.
To first give a global overview of the beam loading effects, we represent in Fig.3.a the phase space of the electrons after a acceleration for two different simulations: both are performed with but in the second (pale gray), electrons with longitudinal momentum above are treated as test particles, i.e. they do not contribute to the plasma fields, so that the loading of the wake is artificially removed after injection. The longitudinal on-axis electric field is also represented, the solid line corresponding to the loaded case and the dotted line to the test particle case. Whereas in the simulation without beam loading, we have the most energetic electrons at the back of the bunch, beam loading tends to flatten, and in this case even invert the electric field, so that trailing electrons are heavily slowed down. As expected, the second period of the wakefield is also damped by the loading of the first wake.
To have a closer look on the effect of beam loading over the resulting spectra, we represent in Fig.3.b the spectra of the electrons in the first plasma period after for five different values of . The figure confirms that increasing permits to increase the injection volume and therefore the charge.
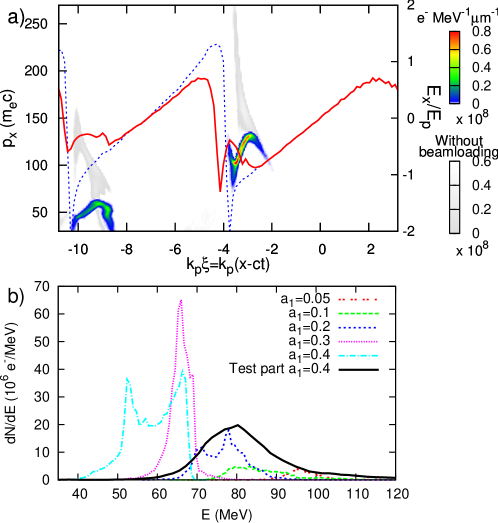
It also shows that the energy of the bunch decreases with the injection pulse amplitude, as in the experiment. We first concentrate on the small loads, with , for which the electric field stays monotonous over the bunch length. Two effects are combined to explain the decrease of the bunch energy: (i) when and thus the injection volume is increased, electrons can be trapped closer to the laser pulse, in lower energy gain orbits, (ii) beam loading due to the leading electrons of the bunch can slow down the trailing electrons.
To remove the ambiguity between these two effects, we also represent the spectrum computed in the test particle simulation () in Fig. 3.b. Comparing it to the simulation with , for which beam loading is also negligible, allows us to witness the influence of a change of injection volume only. We see that the most energetic orbits, that need the lowest initial momentum to be populated, are loaded similarly in both cases. The only difference, linked with the electrons gaining the highest momentum in the collision of the lasers, lies in the low energy cut-off. The fact that, in the simulations and in the experiments (see inset of Fig.1), the high energy cut-off of the spectra is shifted to lower energy as the injected charge increases, is therefore a clear signature of beam loading.
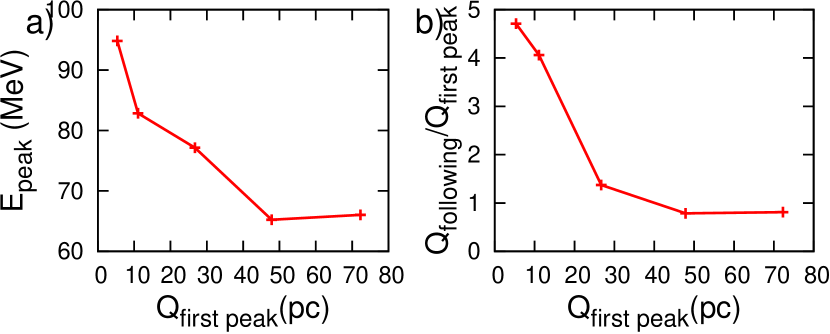
From the simulations, one can also deduce that the peak energy decrease with trapped charge can be accounted approximately for one half to the injection volume, and for the other half to beam loading. The decrease of peak energy as a function of charge trapped in the first bucket is represented in Fig.4.a. Considering that only half of it is due to beam loading, it gives a beam loading field per charge of approximately 1 GV/m/pC. Using the same rough estimate, the beam loading field per charge in the experiment is close to 0.8 GV/m/pC, in good agreement with the simulations.
The simulations with and enlighten the physics of beam loading for high loads: the injected charge is indeed so large that it leads to a flattening () and even to an inversion of the electric field () as shown in Fig.3.a. When the electric field is inverted, the trailing electrons are less accelerated than the leading electrons and the spectrum, showing peaks at the electric field extrema, evolves in a different manner. The most energetic electrons are now the leading ones and they are not undergoing beam loading effects. Thus, the high energy cut-off and the peak energy are now mainly determined by the injection volume, whereas the low energy cut-off is now affected by beam loading. This behavior explains the change of slope in Fig. 4.a around 40 pC which is highly reminiscent of the change of slope in the experimental data shown in Fig.1 at approximately 20 pC. This change of slope occurs for the optimal (field flattening) beam loading case, and the simulation case indeed results in the smallest energy spread. This indicates that in our experiment, the optimal load for our accelerator is around 20 pC. This is also consistent with the experimental fact that, for higher injected charges, structures appear in the first peak and energy spread is rapidly increasing, see inset in Fig.1.
The simulations also show electrons trapped in the trailing buckets (up to five buckets are considered due to the finite-size of the simulation window). Figure 4.b represents again the relative dark current of our accelerator versus the charge trapped in the first bucket. The anti-correlation between the charge in the peak and the charge in the following buckets is again a clear manifestation of beam loading in the simulations, in agreement with the experiment.
The experimental measurements presented in Fig.1 and Fig.2 have now been reproduced by simulations and they can be interpreted as solid observations of beam loading.
In this paper, the evolution of the electron bunch energy and dark current of the accelerator with the beam load of a well defined wakefield are used to diagnose beam loading effects. 3D PIC simulations show that the evolution of energy is due for one half to the variation of the injection volume and for the other half to beam loading. This enables us to infer an experimental beam loading field of 0.8 GV/m/pC. The evolution of the bunch energy versus charge also tells us that the optimal load for our accelerator of about 20 pC. If we assume a bunch duration of some fs (the simulations give a typical rms bunch duration of 1.5 fs), this value is in good agreement with the optimal longitudinal density of the bunch derived by Tzoufras et. al in [9]. Finally, at this charge level, the dark current linked with the electrons trapped in the following buckets is also reduced.
The implications of these observations of beam loading are crucial for future laser-plasma accelerator designs. The evolution of energy spread can indeed be understood as an interplay between injection volume and beam loading. For charges below the optimal load (electric field not yet flattened), increasing the injection volume will result in a larger energy spread after acceleration and rotation in phase space, but it will also increase the charge, resulting in field flattening and improvement of the energy spread. The balance of the two effects will produce a reasonably good beam quality. On the contrary, for charges above the optimal load (inversion of the electric field), both effects will result in an increase of energy spread, explaining the fast deterioration of beam spectral quality. Therefore, beam loading sets a limit on the bunch charge (tenths of pC for our 30 TW laser system), above which the energy spread will irremediably grow.
To further increase the charge while maintaining a good beam quality, it is possible to use a higher laser amplitude: following [9], in the blow out regime, the optimal longitudinal density of the bunch scales as . But it is also mandatory to control the injection volume thoroughly to avoid any irreducible energy spread. Current directions for downsizing the injection volume in optical injection schemes are to use a cold injection scheme [18] to limit the initial energy spread. One can also reduce the plasma density: in a longer plasma period, the injection volume, determined by the sizes the two colliding laser pulses, would be indeed comparatively smaller.
We acknowledge the support of the European Community-New and Emerging Science and Technology Activity under the FP6 “Structuring the European Research Area” program (project EuroLEAP, contract number 028514), the support of the French National Agency ANR-05-NT05-2-41699 “ACCEL1” and the support of RTRA through the project APPEAL.
References
- [1] T. Tajima and J. M. Dawson. Phys. Rev. Lett. 43, 267 (1979).
- [2] S. P. D. Mangles et al. Nature 431, 535 (2004).
- [3] C. G. R. Geddes et al. Nature 431, 538 (2004).
- [4] J. Faure et al. Nature 431, 541 (2004).
- [5] W. P. Leemans et al. Nature Phys. 2, 696 (2006).
- [6] J. Faure et al. Nature 444, 737 (2006).
- [7] T. Katsouleas et al. Part. Acc., 22, 81 (1987)
- [8] A. Reitsma, R. Trines and V. Goloviznin. IEEE Trans. Plasma Sci. 28, 1165 (2000).
- [9] M. Tzoufras et al. Phys. Rev. Lett. 101, 145002 (2008).
- [10] E. Esarey et al. Phys. Rev. Lett. 79, 2682 (1997).
- [11] G. Fubiani, E. Esarey, C. B. Schroeder and W. P. Leemans. Phys. Rev. E70, 016402 (2004).
- [12] J. Faure et al. Plasma Phys. Control. Fusion 49, 395 (2007).
- [13] C. Rechatin et al. Submitted to Phys. Rev. Lett. (2009).
- [14] Y. Glinec et al. Rev. Sci. Instrum. 77, 103301 (2006).
- [15] C. Rechatin et al. Phys. Plasmas 14, 060702 (2007).
- [16] E. Lefebvre et al. Nucl. Fusion 43, 629 (2003).
- [17] X. Davoine et al. Phys. Plasmas 15, 113102 (2008).
- [18] X. Davoine et al. Phys. Rev. Lett. 102, 065001 (2009).