11email: pgrosbol@eso.org 22institutetext: Instituto de Física, Univ. Federal do Rio Grande do Sul, Av. Bento Gonçalves 9500, 91501-970 Porto Alegre, RS, Brazil
22email: dottori@ufrgs.br
Pattern speed of main spiral arms in NGC 2997††thanks: Based on observations made with ESO telescopes at the La Silla Paranal Observatory under programme ID 278.B-5042
Abstract
Context. Bright knots along arms are observed in K-band images of many grand-design spiral galaxies. They are identified as young starforming complexes using K-band spectra which show strong Brγ emission. Their alignment with spiral arms and ages 10 Myr suggest that they are associated with a starforming front linked to a density wave in the galaxies.
Aims. Ages may be estimated for the youngest starforming complexes using NIR broad band colors and Brγ. A different angular speed of the density wave and material would lead to an azimuthal age gradient of newly formed objects. We aim to detect this gradient.
Methods. Deep JHK-Brγ photometry of the southern arm of the grand-design spiral galaxy NGC 2997 was obtained by ISAAC/VLT. All sources in the field brighter than K=19 mag were located. Color-color diagrams were used to identify young stellar complexes among the extended sources. Ages can be estimated for the youngest complexes and correlated with azimuthal distances from the spiral arms defined by the K-band intensity variation.
Results. The extended sources with MK mag display a diffuse appearance and are more concentrated inside the arm region than fainter ones, which are compact and uniformly distributed in the disk. The NIR colors of the bright diffuse objects are consistent with them being young starforming complexes with ages 10 Myr and reddened by up to 8 mag of visual extinction. They show a color gradient as a function of their azimuthal distance from the spiral arms. Interpreting this gradient as an age variation, the pattern speed = 16 km sec-1 kpc-1 of the main spiral was derived assuming circular motion.
Conclusions. The alignment and color gradient of the bright, diffuse complexes strongly support a density wave scenario for NGC 2997. Only the brightest complexes with MK mag show a well aligned structure along the arm, suggesting that a strong compression in the gas due to the spiral potential is required to form these most massive aggregates, while smaller starforming regions are formed more randomly in the disk. The sharp transition between the two groups at MK mag may be associated with expulsion of gas when the first supernovae explode in the complex.
Key Words.:
galaxies: individual: NGC 2997 – galaxies: spiral – galaxies: star clusters – galaxies: structure – infrared: galaxies – techniques: photometry1 Introduction
Strömgren (1963) suggested the use of stellar ages and velocities to estimate properties of the spiral potential in our Galaxy, assuming that stars are formed preferentially in spiral arms. Based on this assumption, birthplaces of B-stars in the solar neighborhood with ages in the range of 100–300 Myr were calculated (Strömgren 1967; Yuan 1969; Grosbøl 1976) to determine pattern speed and amplitude of a possible density wave (Lin & Shu 1964).
For other galaxies, one may consider integrated quantities since neither accurate ages nor space velocities can be observed for individual stars. The standard density wave picture suggests that stars are more likely to be formed in spiral arms (Roberts 1969) that rotate with a constant angular speed . This would lead to an age gradient in young objects as the density wave moves relative to the material (Yuan & Grosbøl 1981). Broad band color gradients across spiral arms have been reported (Grosbøl & Patsis 1998; Puerari & Dottori 1997; González & Graham 1996) although the interpretation may be complex due to significant attenuation by dust in the arm regions. Phase shifts between spiral arms defined by H and CO emission were found by Egusa et al. (2004) who attributed this to differential motion between the density wave and interstellar material.
Deep images of spiral galaxies in the near-infrared (NIR) K-band (Grosbøl & Patsis 1998) revealed bright knots along the arms of several grand-design spirals. Their compactness and alignment suggested that they are young objects. Low resolution K-band spectra of such knots in NGC 2997 (Grosbøl et al. 2006) showed Brγ emission and clearly identified them as very young stellar complexes with ages 10 Myr. A correlation between Brγ emission (i.e. age) and azimuthal distance from the spiral arm of the 6 individual complexes investigated suggested that their formation was triggered by a front associated with a density wave.
Synthetic spectra of very young clusters from starburst99 (Leitherer et al. 1999, hereafter SB99) suggest that one can estimate their ages from NIR broad-band colors even with significant reddening. In this paper, we present deep JHK-Brγ photometry to determine if an age gradient can be detected for the brightest knots in NGC 2997 and, based on that, derive an estimate of the pattern speed of the underlying density wave.
2 Data and reductions
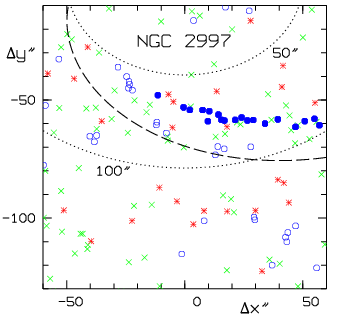
The spiral galaxy NGC 2997, with Hubble type Sc(s)I.3, is one of the nearest grand-design spirals that displays a strong, symmetrical two-armed pattern with a large number of bright complexes aligned along the arms (Grosbøl & Dottori 2008). A field including its southern arm (see Fig. 1) was observed with ISAAC, which has a Rockwell Hawaii 10241024 Hg:Cd:Te detector and a pixel scale of 0.148″. The service mode observations were done at VLT in the period Feb. 9-11, 2007, with exposure times of 4m, 4m, 10m, and 25m on-target in the J, H, Ks, and Brγ filters, respectively. The same observing template was used for all filters and specified a jitter pattern around the target position with offsets around 10″ interleaved with sky exposures significantly outside the galaxy, avoiding bright stars. The reductions were done by an ESO-MIDAS based pipeline which used the standard calibration data provided by the ISAAC calibration plan. The seeing of the final, stacked frames was 0.7″, corresponding to 40 pc adopting a distance modulus of 30.38 mag.

All discrete sources on the K frame were identified using SExtractor v2.5.1 (Bertin & Arnouts 1996) with a detection threshold of 2.5. The mesh size was reduced to 16 and local background estimates were specified in order to follow the intensity variation across the spiral arm. With these positions, aperture photometry was performed on the 4 stacked frames using a 2″ diameter and the background computed in a ring with 3″ radius. Individual errors were estimated considering scatter in the backgound. Magnitudes J=20.3, H=19.6, K=19.3, and Brγ=19.0 were reached with errors 0.1 mag.
Sources were grouped into 3 classes using the class_star index (cs) of SExtractor, which ranges from 1.0 for point-like sources to 0.0 for extended ones. Targets with cs0.8 were assumed to be foreground stars whereas extended objects were separated into compact and diffuse sources depending on their index being above or below 0.3. The distribution of the different classes relative to the spiral pattern is shown in Fig. 2. The diffuse sources show a strong concentration in the spiral arm with a long, well aligned string of complexes (filled circles) 15-25″ inside the K-band arm defined by its m=2 Fourier component. Both foreground stars and compact objects have a more uniform spatial distribution.
3 Colors and ages of extended sources
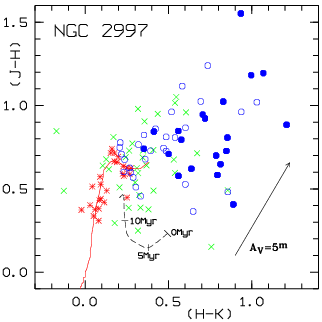
An indication of the age of the individual sources can be obtained from the (H-K) – (J-H) color-color diagram given in Fig. 3, where all objects with errors 0.1 mag in their color indices are shown. The point-like sources cluster around the stellar main sequence, suggesting that the zero-point error in the color indices is 0.01 mag. The analysis of NIR spectra of complexes in NGC 2997 (Grosbøl et al. 2006) and galactic starforming regions (Lee & Chen 2007) indicate that the age of the starforming regions is better described by a continuous star formation scenario. The evolutionary track of a stellar cluster with continuous star formation is display in Fig. 3 using an SB99 model with a Kroupa IMF, upper mass limit of 120 M☉, solar metallicity, and Padova isochrones with AGB stars. The track starts at (H-K, J-H) = (0.50, 0.23) and reaches (0.24, 0.31) for an age of 10 Myr, after which color changes are slow, with old stellar clusters around (0.2, 0.6). Almost all extended sources scatter above the track in the direction indicated by the galactic reddening vector in Fig. 3. Thus, the majority of the diffuse knots are likely to be stellar complexes or clusters with up to 8 mag of visual extinction. This is consistent with estimates based on Brγ and Paβ lines (Grosbøl et al. 2006) but is significantly more than measures based on visual lines (Walsh & Roy 1989). A detailed comparison with Hα maps, available from VLT/FORS1, reveals that Hα emission is detected from many of the K-band knots but has different morphology and therefore does not originate from the exact same regions.
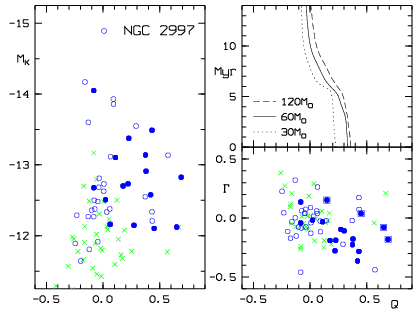
One may construct a first order ’reddening corrected’ index Q = (H-K) - 0.59(J-H) using a screen model with standard galactic extinction (Winkler 1997). SB99 models with continuous star formation show that age correlates well with both Q and Brγ emission for clusters younger than 8 Myr (i.e. 0.1Q). To verify this, a Brγ index = (Brγ-K) was computed with a zero point defined by the average of the foreground stars. Although a general correlation is seen in Fig. 4, the Q index was preferred as an age indicator due to the higher error in . An additional issue for the ISAAC Brγ filter is its steep red transmission edge around 2.174m which is close to the Brγ line for the heliocentric velocity of 1088 km sec-1 for NGC 2997.
The distribution of absolute magnitude MK as a function of Q shows a clear separation of young sources with 0.1Q where all diffuse ones are brighter than -12 mag, while compact ones are fainter (see Fig. 4). Most extended sources lie in the predicted range of -0.2Q0.4 for clusters with ages 300 Myr. The few outliers may be caused by the actual reddening law differing from the galactic one or the more complex geometry of stars and gas in the complexes (Witt et al. 1992; Pierini et al. 2004), as found by Grosbøl & Dottori (2008) for NGC 5247 by comparing (H-K)–MK and Q–MK diagrams.
4 Pattern speed of spirals
The alignment of the diffuse sources along the spiral arm makes it interesting to estimate the azimuthal phase distance between the individual knots and the spiral pattern defined by the intensity variation in the K-band image as given by Grosbøl et al. (2004). The phase of the m=2 Fourier component in the plane of the galaxy fits a logarithmic spiral well with a pitch angle i = 22.6∘ in the radial range of 45″r125″ while i = 21.8∘ is estimated for 65″r105″. The string of bright, diffuse complexes inside the main arm fits a slightly more open spiral with i = 29∘.
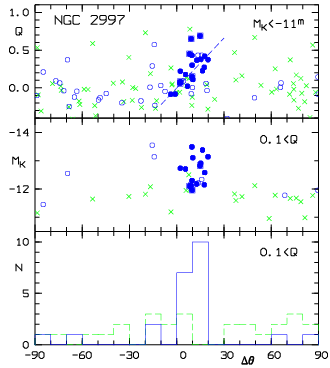
The azimuthal phase difference between the individual complexes and the average logarithmic K-band spiral is shown in Fig. 5, where positive values indicate locations inside the spiral arm. The histogram for young complexes (i.e. 0.1Q) shows a strong peak of diffuse objects just inside the spiral (see also Fig. 2), while compact sources are more evenly distributed. This is consistent with a density wave scenario in which a starforming front may form by compression of gas infront of a spiral potential minimum in the arm (Gittins & Clarke 2004) for regions inside the co-rotation radius. Looking at the absolute magnitudes (see Fig. 5), only the most massive and brightest complexes with MK mag are concentrated just inside the arm while less massive sources are formed also more uniformly in the inter-arm regions. This suggests that a compression in the gas associated with a density wave is necessary to form these very massive complexes. The abrupt change between diffuse and compact sources may well be associated with the expulsion of gas and dust when the first supernovae explode (Bastian & Goodwin 2006; Goodwin & Bastian 2006).
The top diagram in Fig. 5 displays the Q index, which for 0.1Q can be considered as an age indicator. The diffuse sources show a clear asymmetry where the youngest, around Q=0.4, are furthest away from the spiral while older ones graduately are closer. For older complexes with Q-0.1, there are more on the outer side of the spiral (i.e. ) than inside. This is in agreement with a picture where the density wave rotates slower than the material (i.e. inside co-rotation) and young starforming complexes move out through the arm from positive to negative values of . The general asymmetry may be caused by the short lifetime of young clusters (Lada & Lada 2003) but both statistics and age estimates for older complexes are not sufficient to yield a reliable estimate.
The -Q gradient for young, diffuse complexes can be used to estimate the pattern speed of an underlying density wave assuming that all complexes are formed in a narrow lane, parallel to the spiral arm. Using a linear approximation, one obtains:
| (1) |
where is the pitch angle of the starforming front (negative for a trailing pattern) while and are the circular and radial velocities, respectively. This approximation is valid for age Myr for NGC 2997 where is the epicyclic frequency. The term age was derived from the -Q gradient (see top diagram in Fig. 5) using only the diffuse clusters in the string along the arm (filled circles) but excluding the 4 clusters (filled boxes) which lie off the Q- relation. This yields an estimate of 0.22 (dashed line). Continuous SB99 models with upper mass limits above 60 M☉ suggest a age/Q of -20 Myr per mag for Q values around 0.2 mag (see Fig. 4). Reasonable changes of IMF slope and metallicity for the models do not change this slope significantly. The complexes move by 190 pc or 3.9″ per Myr using their average radial distance of = 3.4 kpc and a circular velocity of = 185 km sec-1 (Peterson 1978). This yields an estimate of = (54-38) km sec-1 kpc-1 = 16 km sec-1 kpc-1 assuming circular motion. A systematic inward radial velocity of newly born clusters could be generated by a large-scale shock in the gas and would lower this estimate. The circular estimate would place co-rotation at = 11.6 kpc = 240″, significantly outside the strong, symmetric part of the spiral pattern, and an Inner Lindblad Resonance (ILR) around = 2.9 kpc = 60″, close to the start of the main spiral pattern. These values of are slightly lower than previous estimates (Grosbøl et al. 1999; Vera-Villamizar et al. 2001). The standard SB99 models do not account for Q values above 0.4 mag as observed and may not predict the NIR colors of the youngest, most massive clusters well (possibly due to circumstellar emission). A shallower, upper slope of the IMF would give a slightly better agreement and increase the values estimated. NIR spectra of the complexes would be required to improve the parameters used for the models.
5 Conclusion
Extended sources in a field centered on the southern arm of NGC 2997 show a bi-modal distribution with bright, diffuse complexes with MK mag being strongly concentrated along the spiral arm while fainter, more compact sources are uniformly distributed. NIR colors suggest that the diffuse objects in the arm region are starforming complexes with ages 8 Myr. They display a color gradient as a function of their azimuthal distance from the spiral arm in the sense that redder, younger complexes are further away from the arm than bluer, older objects. It is possible to estimate the pattern speed of an underlying density wave if one interprets this gradient as an age variation due the differential motion of material and wave. Assuming circular motion, we derive = 16 km sec-1 kpc-1 for the main spiral pattern. This locates ILR close to the inner limit of the spiral arms, as seen in K-band images, and co-rotation outside the end of the symmetric, two-armed pattern.
The strong alignment of young, starforming complexes and their age/color gradient support a density wave scenario where a large-scale compression of gas in the arms triggers star formation of the most massive aggregates with MK mag. Young sources fainter than this limit are formed more uniformly across the disk.
Acknowledgements.
ESO-MIDAS and SExtreator were used for the analysis of the data. HD thanks ESO and the Brazilian Council of Research CNPq, Brazil, for support. We thank the referee, Dr. I. Perez, for useful comments.References
- Bastian & Goodwin (2006) Bastian, N. & Goodwin, S. P. 2006, MNRAS, 369, L9
- Bertin & Arnouts (1996) Bertin, E. & Arnouts, S. 1996, A&AS, 117, 393
- Egusa et al. (2004) Egusa, F., Sofue, Y., & Nakanishi, H. 2004, PASJ, 56, L45
- Gittins & Clarke (2004) Gittins, D. M. & Clarke, C. J. 2004, MNRAS, 349, 909
- González & Graham (1996) González, R. A. & Graham, J. R. 1996, ApJ, 460, 651
- Goodwin & Bastian (2006) Goodwin, S. P. & Bastian, N. 2006, MNRAS, 373, 752
- Grosbøl (1976) Grosbøl, P. 1976, PhD thesis, Copenhagen University Observatory
- Grosbøl & Dottori (2008) Grosbøl, P. & Dottori, H. 2008, A&A, 490, 87
- Grosbøl et al. (2006) Grosbøl, P., Dottori, H., & Gredel, R. 2006, A&A, 453, L25
- Grosbøl & Patsis (1998) Grosbøl, P. & Patsis, P. A. 1998, A&A, 336, 840
- Grosbøl et al. (2004) Grosbøl, P., Patsis, P. A., & Pompei, E. 2004, A&A, 423, 849
- Grosbøl et al. (1999) Grosbøl, P. J., Block, D. L., & Patsis, P. A. 1999, Ap&SS, 269, 423
- Lada & Lada (2003) Lada, C. J. & Lada, E. A. 2003, ARA&A, 47, 57
- Lee & Chen (2007) Lee, H.-T. & Chen, W. P. 2007, ApJ, 657, 884
- Leitherer et al. (1999) Leitherer, C., Schaerer, D., Goldader, J. D., et al. 1999, ApJS, 123, 3
- Lin & Shu (1964) Lin, C. C. & Shu, F. H. 1964, ApJ, 140, 646
- Peterson (1978) Peterson, C. J. 1978, ApJ, 226, 75
- Pierini et al. (2004) Pierini, D., Gordon, K. D., Witt, A. N., & Madsen, G. J. 2004, ApJ, 617, 1022
- Puerari & Dottori (1997) Puerari, I. & Dottori, H. 1997, ApJ, 476, L73
- Roberts (1969) Roberts, W. W. 1969, ApJ, 158, 123
- Strömgren (1963) Strömgren, B. 1963, QJRAS, 4, 8
- Strömgren (1967) —. 1967, IAUS, 31, 323
- Vera-Villamizar et al. (2001) Vera-Villamizar, N., Dottori, H., Puerari, I., & de Carvalho, R. 2001, ApJ, 547, 187
- Walsh & Roy (1989) Walsh, J. R. & Roy, J.-R. 1989, ApJ, 341, 722
- Winkler (1997) Winkler, H. 1997, MNRAS, 287, 481
- Witt et al. (1992) Witt, A. N., Thronson, H. A., & Capuano, Jr., J. M. 1992, ApJ, 393, 611
- Yuan (1969) Yuan, C. 1969, ApJ, 158, 871
- Yuan & Grosbøl (1981) Yuan, C. & Grosbøl, P. 1981, ApJ, 243, 432