Imaging the Cool Hypergiant NML Cygni’s Dusty
Circumstellar Envelope with Adaptive Optics
Abstract
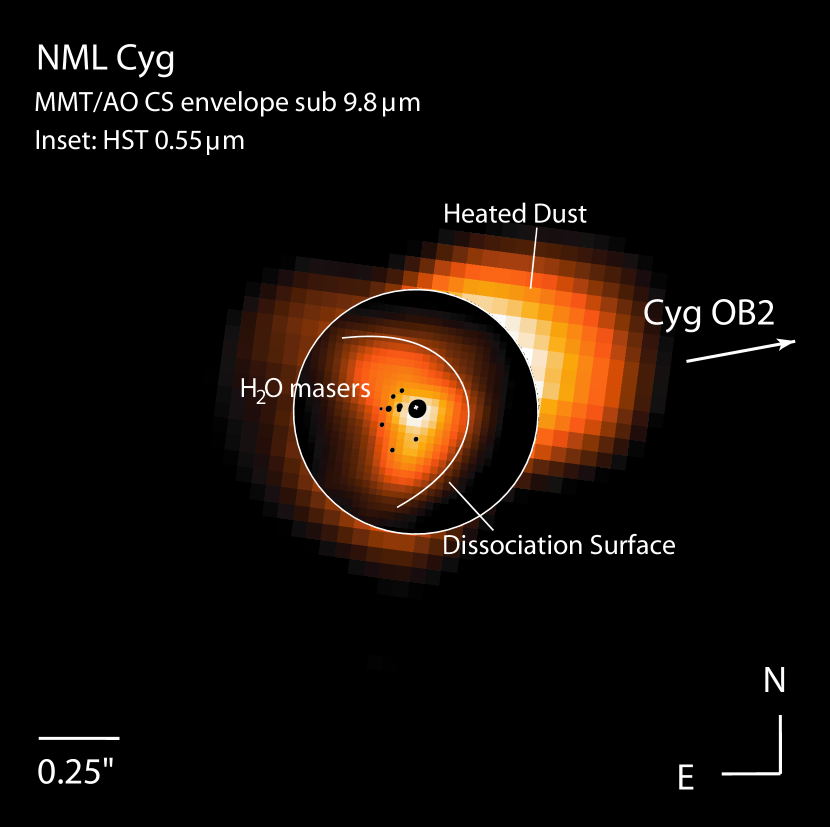
We present sub-arcsec angular resolution, high-Strehl ratio mid-IR adaptive optics images of the powerful OH/IR source and cool hypergiant NML Cyg at 8.8, 9.8 and 11.7 m. These images reveal once more the complexity in the dusty envelope surrounding this star. We spatially resolve the physical structures (radius 0.″14, AU adopting a distance of 1.74 kpc) responsible for NML Cyg’s deep 10 m silicate dust absorption feature. We also detect an asymmetric excess, at separations of 0.″3 to 0.″5 (520 to 870 AU), NW from the star. The colors of this excess are consistent with thermal emission of hot, optically thin dust. This excess is oriented in the direction of the Cyg OB2 stellar association, and is likely due to the disruption of NML Cyg’s dusty wind with the near-UV radiation flux from the massive hot stars within Cyg OB2. This interaction was predicted in our previous paper Schuster et al. (2006a), to explain the geometry of an inverted photo-dissociation region observed at optical wavelengths.
1 Introduction
The powerful OH/IR source and cool hypergiant NML Cyg is one of the most massive and luminous M stars in the Galaxy (40 M⊙, , Hyland et al., 1972; Humphreys & Davidson, 1979; Morris & Jura, 1983; Humphreys & Davidson, 1994; Schuster et al., 2006a; Schuster, 2007). Originally discovered by Neugebauer, Martz & Leighton (1965), NML Cyg was easily identified as an extremely bright infrared source (, mag). The star’s relatively close proximity to the Cyg OB2 stellar association confirms its high luminosity (Morris & Jura, 1983; Schuster et al., 2006a). Even though NML Cyg is luminous, it is also heavily obscured at visual wavelengths due to high interstellar (IS) and circumstellar (CS) extinction, with fainter than 16.6 mag. Its visual/near–IR spectrum indicates a M6 spectral type (Wing et al., 1967), and its spectrum peaks in the 2–20 m range (Gillett et al., 1968; Stein et al., 1969). Thus, the spectrum indicates a substantial, optically thick dusty CS envelope obscuring the central star. NML Cyg’s thick envelope is a result of its strong post-Main Sequence (post-MS) wind (with a velocity of 23 km s-1) and high continuous mass-loss rate of M⊙ yr-1 (Hyland et al., 1972; Bowers et al., 1981; Morris & Jura, 1983). Habing et al. (1982) mapped an unusual oblong shaped HII region111See references therein for the history of the discovery. at 21 cm nearly 1′ in size around NML Cyg, revealing another unique feature of this enigmatic M supergiant. In addition, more recent high-angular resolution, high-contrast images from the Hubble Space Telescope (HST) WFPC2 camera reveal an asymmetric CS nebula of dust scattered stellar light (Schuster et al., 2006a). The CS nebula has a shape similar to the HII region, but is about 300 times smaller in radius. It is necessary to consider NML Cyg’s local environment and its effects on the star in order to understand this object’s true nature.
Although NML Cyg is a very luminous post-MS star which is losing mass at a prodigious rate, it does not currently dominate its local interstellar environment because of its unique location within the Milky Way. It lies in relatively close proximity to Cyg OB2, which is possibly the largest OB stellar association – in size, mass and number of OB stars – in the Galaxy (see Knödlseder, 2003, and references therein for a multi-wavelength review). The Cyg OB2 association spans nearly 2∘ on the sky, or 30 pc in radius at the distance of kpc (Massey & Thompson, 1991), making it one of the closest massive associations to the Sun. Cyg OB2 has 120 O star members, including 5 of the 10 most luminous O stars in the Galaxy (Humphreys, 1978), and approximately 2500 B stars. The stellar mass within the association is possibly as high as 105 M⊙. The O stars provide the UV radiation responsible for a Strömgren sphere that extends to a radius of at least 2.∘74 on the sky, or 80 pc (the projected separation between Cyg OB2 and NML Cyg). The Lyman continuum photon flux of the whole association is estimated to be 1051 ph s-1, or 109 ph cm-2s-1 at the location of NML Cyg. Mid–IR images from the Midcourse Space eXperiment (MSX) satellite show NML Cyg is located in a relative void of gas/dust inside the Cygnus X super bubble (Schuster, 2007). This configuration allows the Lyman continuum photons and near–UV radiation from the hot stars within Cyg OB2 to travel the large distance to NML Cyg relatively unimpeded.
Morris & Jura (1983) demonstrated that the Lyman continuum radiation from Cyg OB2 is responsible for the asymmetric HII region observed around NML Cyg. The HII region is the result of a photo-ionization interaction between the spherically symmetric, expanding hydrogen wind from NML Cyg balanced against an incident plane parallel Lyman continuum photon flux from Cyg OB2 (see Figures 1 and 2 in Morris & Jura 1983). The photo-ionization is inverted in the sense that usually the nearest massive star is the ionization source, and the ionization occurs outward from the central source. Morris & Jura also demonstrated that the strength of the Lyman continuum flux from Cyg OB2 and the density of atomic hydrogen around NML Cyg are sufficient to produce the observed 21 cm emission, thus confirming NML Cyg’s high continuous mass-loss rate. In a similar way, Schuster et al. (2006a) described how near–UV photons with energies between a few and 13.6 eV photo-dissociate the molecular gas in NML Cyg’s wind. Schuster et al.’s model explains why the asymmetric shape of the CS nebula resolved in Hubble Space Telescope WFPC2 images is a consequence of this physical interaction with Cyg OB2. Recent observations of excited-state OH maser emission in NML Cyg’s wind by Sjouwerman et al. (2007) are consistent with an increased OH column density, presumably arising from dissociated H2O molecules at the water photo-dissociation region. Since the atomic and molecular gas around NML Cyg is disrupted, the dust facing Cyg OB2 is unprotected from the near-UV photons. It is thus likely that the CS dust grains are heated and destroyed by the radiation from Cyg OB2 and should emit a detectable infrared signature.
In Section 2, we present sub-arcsec angular resolution, high Strehl Ratio MIRAC3/BLINC mid-IR images of NML Cyg obtained at the 6.5 meter MMT observatory with the Adaptive Optics (AO) system. These observations are among the highest resolution images of this star at mid-IR wavelengths, and reveal the complexity in the asymmetric dust envelope surrounding NML Cyg. New photometry from the Spitzer Space Telescope’s Infrared Array Camera, the Hubble Space Telescope’s WFPC2 camera, and ground-based infrared observations are presented in Section 2. The Spectral Energy Distribution (SED) for NML Cyg’s CS envelope presented in Section 3 shows an optically thick silicate dust absorption feature. In Section 4, we characterize the resolved structures in the dusty CS envelope. In Section 5, we show that the CS dust component facing Cyg OB2 exhibits a silicate feature in emission. We suggest that UV radiation from the hot, massive stars within Cyg OB2 likely causes the inversion in the silicate feature through external heating and dust destruction. We conclude by discussing these results in relation to previous works on NML Cyg, and comparing NML Cyg to the extremely luminous M–type hypergiant VY CMa.
2 Observations
2.1 MMT/AO Observations
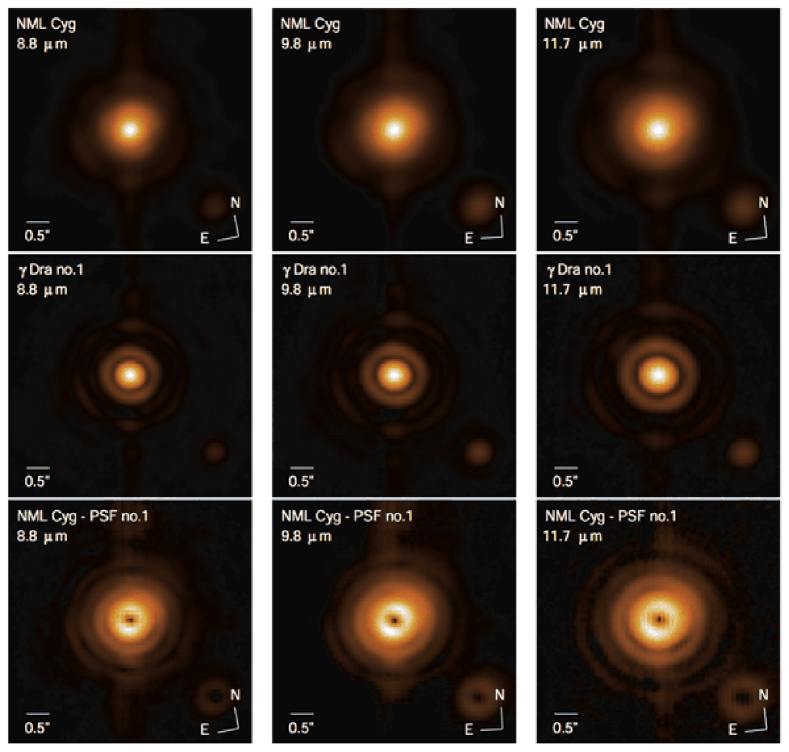
The inverse Photo-Dissociation Region (PDR) model for NML Cyg’s CS envelope described in Schuster et al. (2006a) implies the presence of warm dust near the photo-dissociation front(s). According to this model, Cyg OB2’s UV radiation is heating/destroying the CS dust on the side facing Cyg OB2. In order to corroborate this model through direct observation, we obtained high-angular resolution, high-contrast mid–IR images of NML Cyg’s dusty CS nebula. The observations were made using the University of Arizona’s adaptive optics system (Wildi et al., 2003) and the MIRAC3/BLINC camera (Hoffmann et al., 1998; Hinz et al., 2000) on the 6.5 meter MMT telescope. Table 1 summarizes the observations made in July 2006 and Figure 1 shows the NML Cyg images at 8.8, 9.8 and 11.7 m. The BLINC module was used in ‘chop’ mode with a frequency of 1 Hz, which is useful for background (sky) subtraction when combined with ‘nod’ dithers. Using natural guide star mode, the MMT/AO system produced stable, high-Strehl ratio (%), high signal-to-noise, nearly diffraction limited Point-Spread Functions (PSF) at 10 m. We have used the source itself as guide star for the AO system (while extended in the infrared, NML Cyg is a point source at optical wavelengths where the AO system operates). With a magnitude , NML Cyg is at the sensitivity limit for the MMT/AO wavefront sensor, but was successfully used thanks to the excellent sky conditions.
Figure 1 also shows images of the IR standard Dra, which was observed at two separate epochs and sky orientations for calibration and PSF characterization (see Table 1, only one epoch is shown in Figure 1). The PSF stability was excellent throughout the night and the sky conditions were especially good, with seeing 0.″25. In these PSF images the minima/maxima in the diffraction pattern are closely matched to the Airy pattern for a 6.35m aperture222The MMT adaptive secondary is undersized to improve IR performance, resulting in a 6.35m equivalent resolution limit., with a FWHM of 0.″33 at 8.8 m, 0.″36 at 9.8 m, and 0.″44 at 11.7 m.
The nearly diffraction limited images have similar benefits in resolution and stability to images from space-based observatories, and at mid–IR wavelengths we can detect and separate the externally heated dust from the rest of NML Cyg’s CS nebula. Relatively long exposure times and a 5 point dither pattern, repeated multiple times with sub-pixel shifts, provided very high dynamic range images of NML Cyg and the calibration/PSF standards, in the range (PSF peak relative to background noise). The images were processed with the Drizzle algorithm to maximize the quality of the data and recover sampling resolution (Hook & Fruchter, 1997; Koekemoer et al., 2000; Fruchter & Hook, 2002). The processed MIRAC3 images were resampled by 22 from 0.″0954 pix-1 to a scale of 0.″0477 pix-1.
The 8.8, 9.8 and 11.7 m filters were chosen to provide good spectral coverage of the 10 m silicate dust feature observed for this luminous cool star (Monnier et al., 1997; Blöcker et al., 2001). The photometry of the source in the three MIRAC3 bands is listed in Table 2. The flux in each band was measured in an aperture of 2″ radius, with the sky residual background flux (after sky subtraction for each chop/nod sequence) determined outside this aperture. Photometric calibration was obtained using the PSF reference star Dra as photometric standard. The photometry has been corrected to a common airmass. The uncertainty in the photometry quoted in Table 2 do not include 5 – 10% systematic uncertainties typical for ground based mid-IR observations.
2.2 Spitzer/IRAC Observations
Table 1 summarizes our observations of NML Cyg obtained in July 2004 with the Infrared Array Camera (IRAC, Fazio et al., 2004) on-board the Spitzer Space Telescope (Werner et al., 2004; Gehrz et al., 2007). The IRAC images (GTO Program 124, AOR 6588416, pipeline version S14.0.0) were processed with IRACproc, a software package that facilitates co-addition and analysis of IRAC data (Schuster et al., 2006b). IRACproc also improves the identification and removal of cosmic rays and other transient signals from the processed images, while simultaneously improving image quality, photometric accuracy and sensitivity (signal-to-noise). Due to the extreme brightness of the source, the core of the IRAC images was saturated, preventing the adoption of standard aperture photometry techniques to measure the flux in the IRAC bands. By fitting a High Dynamic Range (HDR) PSF to the diffraction spikes and extended “wings” of the IRAC images, we have however derived the source photometry in the IRAC bands at 3.6, 4.5 and 8.0 m (artifacts in the 5.8 m image prevented using this technique at that wavelength). The PSFs we used were obtained from the observation of bright stars (Vega, Eridani, Fomalhaut and Indi) as part of the Spitzer Space Telescope GTO program 90, and are available at the Spitzer Science Center web site333http://ssc.spitzer.caltech.edu/irac/psf.html. The detailed description of this fitting procedure is available in Marengo et al. (2006) and Schuster et al. (2006b). The photometry is listed in Table 2.
2.3 Ground-Based IR Photometry
We obtained ground-based broadband 1 to 12 m photometry in August 2000 at the University of Minnesota’s (UMN) O’Brien Observatory (OBO) with a single element Bolometer using a standard chop-nod technique for background sky subtraction (beam diameter 27″, Gehrz et al., 1974, 1992; Gehrz, 1997). The observations and photometry are summarized in Tables 1 and 2. The absolute calibration of the instrument was determined using Lyr (Vega) and Peg as primary calibrator, using the procedure described in Gehrz (1997).
2.4 HST/WFPC2 PC Photometry
Multi-wavelength images of NML Cyg were obtained in September 1999 with the WFPC2 Planetary Camera on-board the Hubble Space Telescope (Biretta et al., 2000). These observations aimed to investigate the star’s CS nebulosity are summarized in Table 1 (images previously published by Schuster et al., 2006a). NML Cyg was observed with broadband Johnson-Cousins and filters as well as narrow band Hα filter. Prior to co-addition, the images were processed with the Space Telescope Science Institute’s standard calibration reference files. The images were combined with the IRAF/STSDAS software package DITHER, which uses the Drizzle algorithm to recover image resolution from the pixel response of the camera while preserving photometric accuracy (Koekemoer et al., 2000; Fruchter & Hook, 2002). Multiple, dithered exposures allowed removal of cosmic rays, bad pixels, and other effects during co-addition. The HST Photometry is reported in Table 2.
3 NML Cyg’s Bolometric Luminosity and
10 m Silicate Dust Absorption Feature
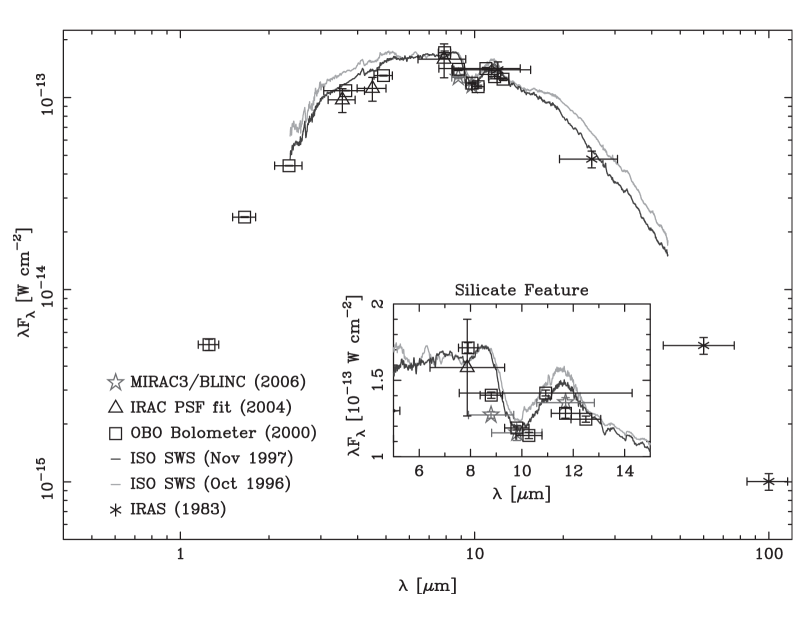
Table 2 summarizes our photometric observations of NML Cyg along with archival IRAS Point Source fluxes. These observations are plotted on the vs. SED in Figure 2, along with reprocessed archival ISO SWS spectra (Justtanont et al., 1996; Kraemer et al., 2002).
NML Cyg’s spectrum rises rapidly from optical wavelengths through the IR to peak in the 2 to 20 m range, with a broad far–IR tail. Visible light images presented by Schuster et al. (2006a) show that NML Cyg is almost completely obscured by the CS envelope enshrouding the star, thus confirming significant circumstellar extinction. This is evident from the broad 10 m silicate dust absorption feature. Due to the optically thick envelope, this feature is a striking characteristic of the NML Cyg spectrum, setting this star apart from other cool hypergiants such as Cep (Gehrz et al., 1970), S Per (Humphreys, 1974, and unpublished data), VY CMa (Smith et al., 2001), VX Sgr (Humphreys, 1974), HR 5171 A (Humphreys et al., 1971), IRC +10420 (Jones et al., 1993) and M33 Var A (Humphreys et al., 2006), where the 10 m silicate feature is seen in emission from optically thin CS nebula shells.
NML Cyg is also a semi-regular variable with period days (Monnier et al., 1997, and references therein). The vertical spread between data sets in Figure 2 is well within the % amplitude variation reported by Monnier et al. (1997) from 8 to 13 m. Even with this large variability, Monnier et al.’s results show the 10 m silicate feature’s shape is roughly constant over a span of nearly 19 years. In addition, the vertical offsets between observations at other wavelengths in Figure 2 are at least in part due to variability. However, the degree to which NML Cyg’s spectrum varies, in either amplitude or shape, at other wavelengths has not been well established. Interstellar (IS) extinction to NML Cyg is also high, with an estimated range of magnitudes (Lee, 1970; Gregory & Seaquist, 1976).
We calculate NML Cyg’s minimum bolometric luminosity by integrating444Using a Rayleigh-Jeans fit extension at long wavelengths. the SED in Figure 2, obtaining Lbol = L⊙, or 105 L⊙ at kpc (Massey & Thompson, 1991, Cyg OB2 distance modulus 11.2). This luminosity does not include a correction for IS extinction, which would add at most a few percent to the total since most of the light is in the mid–IR where extinction is low. The uncertainty in this estimate does not consider the changes in the source brightness due to its variability. This luminosity value is in good agreement with the estimate of Lbol = (/kpc)2 L⊙ by Blöcker et al. (2001). Thus, NML Cyg’s intrinsic luminosity, a few 105 L⊙ ( -9.0) is similar to that of other extremely luminous M–type hypergiants.
Previously, Morris & Jura (1983) reported a luminosity of L⊙ for NML Cyg at a distance of 2.0 kpc. This luminosity was equal to the most luminous known M supergiants in the Milky Way and LMC, , L⊙ (Humphreys, 1978; Humphreys & Davidson, 1979). Our value is 37% lower, with 24% due to the downwardly revised distance and 13% from our integration of the SED from 0.5 to 100 m (including new photometry). With this revision, NML Cyg appears to be less luminous than the hypergiant VY CMa (M4-5e Ia, L⊙ at 1.5 kpc, also without correcting for IS extinction), which has a comparable SED (Smith et al., 2001; Humphreys et al., 2007). The uncertainty in our estimate, and the variability of the source makes it difficult to determine unambiguously which of these stars is more luminous. Even with this reduction in luminosity, however, NML Cyg remains the most luminous star with spectral type M6 or later known in the Milky Way.
4 Mid–IR Image Analysis
Figure 1 shows that NML Cyg’s CS envelope is clearly extended at mid–IR wavelengths, compared to the point-source (PSF) images of Dra, as the diffraction pattern appears ‘filled-in’. As further evidence for the extension and degree of asymmetry, Figure 1 also shows the NML Cyg images after over-subtracting the PSF (epoch 1, scaled to give zero intensity flux at the center pixel in the subtracted images). The asymmetric CS envelope residuals are apparent, having a NW/SE elongation axis, and position angle in the range . Also visible in the PSF-subtracted images is a lopsided tail extending to the NW (across the first diffraction ring). The MMT is an Elevation/Azimuth mount telescope, so the background sky predictably rotates in the image plane while tracking an object. Thus, it was possible to directly confirm the asymmetric extension by observing NML Cyg twice in the same night, at two sky rotation angles separated by 122∘ (at 9.8 m only). The extended components rotated by the same number of degrees (not shown here), eliminating the possibility that the PSF or other instrumental effects are the cause of the observed extension.
NML Cyg’s mid–IR envelope orientation is similar to the position angles observed in the OH (Masheder et al., 1974; Benson & Mutel, 1979; Diamond et al., 1984), H2O (Richards et al., 1996), and SiO (Boboltz & Claussen, 2004, and private communication) masers. Richards et al. (1996) have suggested that the NW/SE spatial distribution of the H2O vapor masers may indicate a bipolar outflow, supported by recent SiO ground state observations by Boboltz & Claussen. It is also possible that the maser emission is tracing an asymmetric, episodic outflow that may be reminiscent of the arcs and other structures seen in the circumstellar nebula surrounding VY CMa (Smith et al., 2001; Smith, 2004; Humphreys et al., 2005, 2007; Jones et al., 2007).
Earlier observations by Hinz (2001) also show NML Cyg’s extended envelope using MIRAC3 with the BLINC module in nulling interferometer mode on the MMT. These observations were made prior to the installation of the adaptive optics system. Hinz’s observations indicated a CS envelope extended beyond 0.″28 at 10.3 m, with nearly equal flux in the extended envelope relative to the unresolved structure (see his Eq. 7.5 and Table 7.2, p. 89-95). The better resolution, and Fourier coverage, of the AO images in Figure 1 reveal at least two structures in the CS nebula, the main envelope aligned with maser observations and an asymmetric component aligned more closely with the direction towards Cyg OB2.
4.1 Parameterizing the CS Envelope Image Intensity
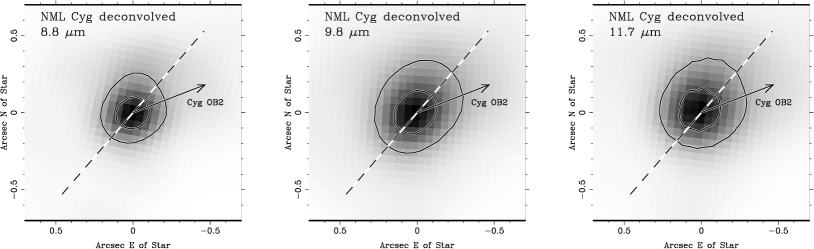
To take full advantage of the exceptional stability and contrast in the MMT/AO MIRAC3 high-angular resolution images, we used deconvolution to more clearly reveal details seen in the Figure 1 images of NML Cyg’s CS envelope. Figure 3 shows our NML Cyg images after deconvolution with the PSF calibrator (using IRAF task LUCY, Richardson, 1972; Lucy, 1974; Snyder, 1990). The deconvolution reveals the complex CS envelope structure, highlighting the elongated envelope extended towards the NW direction. The two contours in the Figure are set at the source 1/2 and 1/10 maximum flux level. The inner contour shows that the core of the emission is elongated along a SE – NW axis, while the external part of the circumstellar emission is lopsided towards the NW quadrant. The main axis of the core emission has a PA of (counter-clockwise from north) in the 9.8 and 11.7 m deconvolved images. This angle is similar to the alignment of the NML Cyg OH, H2O and SiO masers, also at – 150∘. The PA is slightly smaller () in the 8.8 m image, possibly due to an image artifact in direction of the MIRAC3/BLINC chop.
To better characterize the shape and spatial scales of the NML Cyg circumstellar envelope, we fit the images in Figure 3 with two 2-D Gaussians, one fitting the core emission (which we call the “core envelope” Gaussian) and one fitting the NW extended low level structures (the “outer envelope” Gaussian). Note that this fitting process is aimed only to find a practical way of describing the changing colors of the circumstellar envelope at different distances from the center. The fitting process or results do not imply that the individual Gaussians represent individual physical structures in the circumstellar envelope. The core Gaussian has a width and orientation analogous to the width and position angle of the 1/2 height contour, and is centered on the star. The second Gaussian fits the outer envelope emission, and is offset in the NW direction as shown by the 1/10 contour level asymmetry. The best fit parameters were determined by minimizing the residuals after subtraction of the two Gaussians from the deconvolved images. We start by fitting the first Gaussian to the image core, then the second Gaussian is fit to the core-subtracted image. The process was then iterated to minimize the residuals after subtraction of both Gaussians. Table 3 lists the best fit parameters for each wavelength, including the size parameter and relative flux (in % of the total flux) of each component, the aspect ratio between the major and minor semi-axis and the position angle PA of the core component and the offset of the outer envelope with respect to the core. Figure 4 shows the radial profiles of the deconvolved image and best fit Gaussians along the cut at PA = 140∘. Note how the profiles show the large asymmetry between the SE and NW directions. While the SE profile is fit well by the two Gaussians, some residual flux above the fit is still present in the NW direction.
The agreement in position angle and size between the core envelope emission and the NML Cyg maser observations suggest that this emission arises from the NML Cyg’s wind at, or just interior to, the photo-dissociation front(s) described in Schuster et al. (2006a). The relative flux contribution from the outer envelope component increases from 8.8 to 9.8 to 11.7 m as we are resolving the optically thin warm dust ( – 500 K) farther out in the envelope.
4.2 The Asymmetric NW Excess
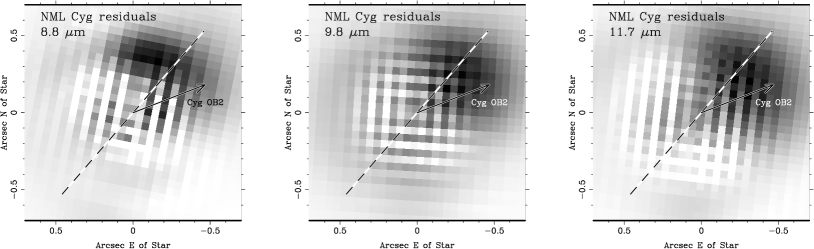
To test the accuracy of the deconvolution parametrization in image space, we have subtracted the Gaussian fit, convolved with the PSF reference ( Dra), from the NML Cyg mid-IR images at each wavelengths. The residuals are shown in Figure 5. The grid-like pattern is due to the spatial sampling and linear interpolation of the image on the detector grid, and is the limiting factor in the accuracy of the fit. This pattern may be reduced by increasing the number of unique offsets in the dithered observations and by applying higher order interpolation in the reconstruction of the image on a finer pixel grid. The uniform distribution of this residual pattern and the relatively low flux level in the center is indicative of the good quality of the deconvolutions and fits, and also the stability of the MMT/AO PSF.
The figure also shows a clear excess residual in the NW quadrant. The excess peak brightness occurs around .″3 to 0.″5 ( AU) from the central star, with a broad tail extending toward Cyg OB2. This excess cannot be reduced by adjusting the position and shape of the outer envelope Gaussian, constrained by the fit in the other 3 quadrants. The shape and orientation of this excess are reminiscent to the lopsided emission seen in the HST images from Schuster et al. (2006a, their Figures 2 and 6). The asymmetric excess is separated from the star in Figure 5 at the spatial resolution limit, i.e. it is resolved according to the Rayleigh criterion. It lies just outside the asymmetric dusty reflection nebula seen in the HST images (Schuster et al., 2006a). We suggest that the excess emission is likely from warm dust that is externally heated/destroyed by UV radiation from Cyg OB2. In the next section, this hypothesis will be tested by directly measuring the flux from this excess.
5 Discussion: CS Dust Heating and Destruction
In Table 4 we list the total flux of the source, the fraction of the total flux in the core and outer envelope, the total flux of all the fit residuals shown in Figure 5, and the excess residual flux in the NW quadrant (residual flux in the NW quadrant, minus the residual flux in the opposite SE quadrant). In Figure 6 we plot the [8.8]-[9.8] and [9.8]-[11.7] colors for each CS nebula component. Both the core envelope colors are bluer than the total for the source. This core component likely represents the collective flux from where the silicate absorption is deepest, and thus characterizes the geometry of the dust responsible for the optically thick feature seen in the star’s spectrum. NML Cyg’s stellar radius is probably of the order of 10 AU, typical for the largest red supergiants, and therefore the material comprising the inner CS envelope (, 200 AU) has a size scale of approximately 20 stellar radii. The outer CS envelope colors are redder than those of the core envelope and the total source. This indicates dust with decreasing temperature and density.
In contrast, the colors for the asymmetric excess are significantly different, being blue in [9.8]-[11.7] and red in [8.8]-[9.8]. These colors can be explained by the presence of optically thin hot dust with the 9.8 m silicate feature in emission. The fact that the asymmetric dust emission excess appears only on the side facing Cyg OB2 is consistent with an increase in temperature resulting from the external UV radiation. The density is also likely reduced due to dust destruction. Since the asymmetric excess is shielded from the central star by the optically thick inner CS envelope, Cyg OB2’s external energy is required to account for changes in the grain temperature, size and/or spatial distribution ultimately responsible for the silicate feature’s inversion.
In Schuster et al. (2006a) we showed that the UV flux from the Cyg OB2 association is strong enough to significantly heat the dust grains in the NML Cyg envelope, possibly destroying the smallest grains. The excess mid-IR flux we observe in the NW quadrant may be the direct effect of this heating and destruction. Its presence strongly suggests that the circumstellar envelope of NML Cyg is indeed shaped by the interaction of its wind with the radiation field coming from the Cyg OB2 association. The direct detection of this physical interaction between NML Cyg and the Cyg OB2 association is further confirmation that the source is indeed in the neighborhood of Cyg OB2. This supports the distance determination of kpc by Massey & Thompson (1991) for this star as one of the most reliable distances for an evolved massive star near the upper luminosity boundary.
6 NML Cyg’s Complex Circumstellar Environment
Figure 7 shows the NW excess in our 9.8 m deconvolved image compared to the scattered light HST/WFPC2 F555W image from Schuster et al. (2006a). As discussed in Section 5, our interpretation for this mid-IR excess is another strong indicator that the UV radiation from the hundreds of massive young OB stars within Cyg OB2 is disrupting NML Cyg’s post-MS wind through photo-ionization, photo-dissociation and grain destruction. The models for these processes explain the inverted HII region’s existence and shape, the asymmetric nebula seen with HST, as well as the externally heated dust visible in our mid-IR images. The inverse photo-ionization (Morris & Jura, 1983) and photo-dissociation (Schuster et al., 2006a) models for this interaction have assumed a radially symmetric, constant velocity hydrogen gas wind, i.e. density . The agreement between theory and observation suggests that this steady-state, uniform outflow is a overall a good approximation of NML Cyg’s stellar wind.
However, the asymmetric mid-IR image reveals that NML Cyg’s dusty CS envelope does has a more complex underlying structure. One may speculate that the identified structures may represent the integrated signal from many arcs, loops, bipolar outflows and other 3-dimensional structures below our angular resolution that may be the result of episodic and asymmetric mass-loss, much like VY CMa (see Figure 3, Smith et al. 2001 as well as Humphreys et al. 2007; Jones et al. 2007). Asymmetric structures arising from episodic mass-loss may also modulate the maser and IR emission as they pass through the photo-dissociation and grain destruction regions. With even better angular resolution and sensitivity (perhaps with JWST and/or the next generation of ground-based nulling interferometers like LBTI and KNI) it should be possible to observe these fainter, compact structures within the larger nebulosity, if they exist.
Previous 11 m results from Monnier et al. (1997), Danchi et al. (2001) and Blöcker et al. (2001) have suggested the presence of multiple, concentric density enhancements (shells) surrounding the central star superposed on a wind, characterized by an azimuthally symmetric, but non-steady-state dust outflow, i.e . This, in turn, implied a time dependent mass-loss, possibly in episodic/periodic events such as a ‘superwind’ phase. The images presented in Section 4 show evidence for a complex distribution in the CS dust, but also reveal an asymmetric excess aligned to the NW (towards Cyg OB2). The differences with these earlier results are not surprising given the better resolution and Fourier coverage in the MMT/AO images. However, it should be noted that Monnier et al. acknowledge in their conclusions that deviations from spherical symmetry, particularly emission from dense or clumped material 350 mas from the central star, would necessarily change the meaning of their fits (and likewise for Danchi et al., 2001). In fact, Figure 3 and 4 show, through direct imaging, the presence of warm dust emitting throughout mid-IR wavelengths precisely at this distance from NML Cyg. Moreover, this emission is concentrated at position angles ranging from (CS envelope) to (dust facing Cyg OB2), or equivalently at alignments of – . Monnier et al.’s and Danchi et al.’s journals of observations show that they made eight observations with resolution substantially (at least 20%) better than 0.″35, and these observations were made with the interferometer aligned along position angles between 102∘ and 140∘ (see each author’s Table 1). Thus, their observations just happened to be oriented with the NW excess emission resolved in our images. It is possible that the most external circumstellar shell inferred from these interferometric observations may in fact be better explained by the asymmetric excess in our 9.8 m image.
Using a combination of Keck aperture masking and IOTA interferometry, Monnier et al. (2004) found at 2.2 m an elongated structure with a diameter of mas. The orientation of this structure is orthogonal to the PA of the inner component of our images, represented by our “core” Gaussian fits. Monnier et al. (2004) interpret this structure as an equatorial enhancement in the dust envelope, orthogonal to NML Cyg’s maser outflow.
Our mid-IR images, when analyzed in combination with the previous observations discussed above, clearly demonstrate the complexity of NML Cyg circumstellar environment. Any model of NML Cyg that attempts to explain the observations must thus take into account the observed asymmetries as well as the physical interaction between NML Cyg’s wind and the UV radiation from Cyg OB2. In particular for NML Cyg, high-angular resolution (.″3) combined with more complete coverage of the Fourier plane are crucial to further investigate asymmetries in its complex CS environment.
NML Cyg is part of our larger program to study the circumstellar environments of cool stars near the empirical upper luminosity boundary in the HR diagram with evidence for high-mass loss and observed instabilities. As such, NML Cyg was perhaps the best candidate to have an extensive CS nebula, possibly like VY CMa. However, NML Cyg’s CS nebulosity is more concentrated around the star and appears quite different compared to VY CMa, as imaged by Smith et al. (2001). Even though NML Cyg is heavily obscured, the extent of the CS nebula is much less than the almost 10″ nebula surrounding VY CMa ( AU at VY CMa’s distance of 1.5 kpc). It is possible that the more distant material in NML Cyg’s circumstellar nebula has been largely dissipated by the winds and radiation pressure inside the Cygnus-X super bubble and is below our detection limits. If NML Cyg were not located in such close proximity to Cyg OB2, it might show a much more extended nebula comparable to VY CMa. However, VY CMa’s mass-loss rate, M⊙yr-1 (Danchi et al., 1994), is 3 to 6 times higher than for NML Cyg and this difference may also have significant bearing on the more extensive circumstellar nebulosity.
7 Conclusions
Our sub-arcsec angular resolution AO mid-IR images of NML Cyg provide a new understanding of the complex geometry and physics of the circumstellar environment of this high luminosity cool hypergiant. By spatially resolving the optically thick dusty envelope, we directly image the structures responsible for the creation of a deep 10 m silicate absorption feature. This structure, which follows the same orientation of NML Cyg’s maser outflow, is orthogonal to a near-IR equatorial enhancement found by Monnier et al. (2004).
By analyzing the mid-IR colors of structures located at increasing distance from the star, we observe a trend in which the optical depth of the dust decreases in the outer parts of the circumstellar envelope. For the first time we isolate an asymmetric excess, at a distance of to 870 AU, NW from the star, with colors consistent with the emission of hot, optically thin dust. We interpret this emission as the signature of the interaction of the NML Cyg circumstellar envelope with the strong UV flux generated in the nearby Cyg OB2 association. This interaction was predicted in our previous paper (Schuster et al., 2006a) to explain the shape of a the inverted photo-dissociation region we imaged with the HST at optical wavelength. Our new mid-IR observations strongly support the validity of our previous results and the model we proposed for their explanation.
References
- Benson & Mutel (1979) Benson, J.M. & Mutel, R.L. 1979, ApJ, 233, 119
- Biretta et al. (2000) Biretta, J.A. et al. 2000, WFPC2 Instrument Handbook, Version 5.0 (Baltimore:STScI)
- Blöcker et al. (2001) Blöcker, T., Balega, Y., Hofmann, K.-H., & Weigelt, G. 2001, A&A, 369, 142
- Boboltz & Claussen (2004) Boboltz, D.A. & Claussen, M.J. 2004, BAAS, 36, 1226
- Bowers et al. (1981) Bowers, P.F., Johnston, K.J. & Spencer, J.H. 1981, Nature, 291, 382
- Danchi et al. (1994) Danchi, W.C., Bester, M., Degiacomi, C.G. et al. 1994, AJ, 107, 1469
- Danchi et al. (2001) Danchi, W.C., Green, W.H., Hale, D.D.S. et al. 2001, ApJ, 555, 405
- Diamond et al. (1984) Diamond, P.J., Norris, R.P. & Booth, R.S. 1984, MNRAS, 207, 611
- Draine & Anderson (1985) Draine, B.T. & Anderson, N. 1985, ApJ, 292, 494
- Fazio et al. (2004) Fazio, G.G., Hora, J.L., Allen, L.E. et al. 2004, ApJS, 154, 10
- Fruchter & Hook (2002) Fruchter, A.S. & Hook, R.N. 2002, PASP, 114, 144
- Gehrz et al. (1970) Gehrz, R.D., Ney, E.P. & Strecker, D.W. 1970, ApJ, 161, L219
- Gehrz et al. (1974) Gehrz, R.D., Hackwell, J.A. & Jones, T.W. 1974, ApJ, 191, 675
- Gehrz et al. (1992) Gehrz, R.D., Grasdalen, G.L. & Hackwell, J.A. 1992, Encyclopedia of Physical Science and Technology, Vol. 2, (New York:Academic), 125
- Gehrz (1997) Gehrz, R.D. 1997, International Comet Quarterly, Vol. 19, No. 2, p. 55
- Gehrz et al. (2007) Gehrz, R.D., Roellig, T.L., Werner, M.W. et al. 2007, Review of Scientific Instruments, 78, 011302
- Gillett et al. (1968) Gillett, F.C., Stein, W.A. & Low, F.J. 1968, ApJ, 153, L185
- Gregory & Seaquist (1976) Gregory, P.C. & Seaquist, E.R. 1976, ApJ, 204, 626
- Habing et al. (1982) Habing, H.J., Goss, W.M. & Winnberg, A. 1982, A&A, 108, 412
- Hinz et al. (2000) Hinz, P.M., Angel, J.R.P., Woolf, N.J. et al. 2000, Proc. SPIE, Interferometry in Optical Astronomy, eds. P.J. Lena & A. Quirrenbach, 4006, 349
- Hinz (2001) Hinz, P.M., 2001, Ph.D. Thesis, (The University of Arizona)
- Hoffmann et al. (1998) Hoffmann, W.F., Hora, J.L., Fazio, G.G. et al. 1998, Proc. SPIE, Infrared Astronomical Instrumentation, ed. A.M. Fowler, 3354, 647
- Hook & Fruchter (1997) Hook, R.N. & Fruchter, A.S. 1997, ASP Conf., Astronomical Data Analysis Software and Systems VI, eds. G. Hunt & H.E. Payne, 125, 147
- Humphreys et al. (1971) Humphreys, R.M., Strecker, D.W. & Ney, E.P. 1971, ApJ, 167, L35
- Humphreys (1974) Humphreys, R.M. 1974, ApJ, 188, 75
- Humphreys (1978) Humphreys, R.M. 1978, ApJS, 38, 309
- Humphreys & Davidson (1979) Humphreys, R.M. & Davidson, K. 1979, ApJ, 232, 409
- Humphreys & Davidson (1994) Humphreys, R.M. & Davidson, K. 1994, PASP, 106, 1025
- Humphreys et al. (2005) Humphreys, R.M., Davidson, K., Ruch, G., & Wallerstein, G. 2005, AJ, 129, 492
- Humphreys et al. (2006) Humphreys, R.M., Jones, T.J., Polomski, E. et al. 2006, AJ, 131, 2105
- Humphreys et al. (2007) Humphreys, R.M., Helton, L.A. & Jones, T.J. 2007, AJ, 133, 2716
- Hyland et al. (1972) Hyland, A.R., Becklin, E.E., Frogel, J.A., & Neugebauer, G. 1972, A&A, 16, 204
- Jones et al. (1993) Jones, T.J., Humphreys, R.M., Gehrz, R.D. et al. 1993, ApJ, 411, 323
- Jones et al. (2007) Jones, T.J., Humphreys, R.M., Helton, L.A. et al. 2007, AJ, 133, 2730
- Justtanont et al. (1996) Justtanont, K., de Jong, T., Helmich, F.P. et al. 1996, A&A, 315, L217
- Knödlseder (2003) Knödlseder, J. 2003, IAU Symp. 212, A Massive Star Odyssey, from Main Sequence to Supernova, eds. K.A. van der Hucht, A. Herrero & C. Esteban, 505
- Koekemoer et al. (2000) Koekemoer, A.M. et al. 2000, HST Dither Handbook, Version 1.0 (Baltimore:STScI)
- Kraemer et al. (2002) Kraemer, K.E., Sloan, G.C., Price, S.D., & Walker, H.J. 2002, ApJS, 140, 389
- Lee (1970) Lee, T.A. 1970, ApJ, 162, 217
- Lucy (1974) Lucy 1974, AJ, 79, 745
- Marengo et al. (2006) Marengo, M., Megeath, S.T., Fazio, G.G. et al. 2006a, ApJ, 647, 1437
- Masheder et al. (1974) Masheder, M.R.W., Booth, R.S. & Davies, R.D. 1974, MNRAS, 166, 561
- Massey & Thompson (1991) Massey, P. & Thompson, A.B. 1991, AJ, 101, 1048
- Monnier et al. (2004) Monnier, J.D. et al. 2004, ApJ, 605, 436
- Monnier et al. (1997) Monnier, J.D., Bester, W.C., Danchi, W.C. et al. 1997, ApJ, 481, 420
- Morris & Jura (1983) Morris, M. & Jura, M. 1983, ApJ, 267, 179
- Neugebauer, Martz & Leighton (1965) Neugebauer G., Martz D.E. & Leighton R.B. 1965, ApJ, 142, 399
- Richards et al. (1996) Richards, A.M.S., Yates, J.A. & Cohen, R.J. 1996, MNRAS, 282, 665
- Richardson (1972) Richardson 1972, J. Opt. Soc. Am., 62, 55
- Schuster et al. (2006a) Schuster, M.T., Humphreys, R.M. & Marengo, M. 2006a, AJ, 131, 603
- Schuster et al. (2006b) Schuster, M.T., Marengo, M. & Patten, B.M. 2006b, Proc. SPIE, Observatory Operations: Strategies, Processes, and Systems, eds. D.R. Silva & R.E. Doxsey, 6270
- Schuster (2007) Schuster, M.T., 2007, Ph.D. Thesis, (The University of Minnesota)
- Sjouwerman et al. (2007) Sjouwerman, L.O., Fish, V.L., Claussen, M.J. et al. 2007, ApJ, 666, L101
- Smith et al. (2001) Smith, N., Humphreys, R.M., Davidson, K. et al. 2001, AJ, 121, 1111
- Smith (2004) Smith, N. 2004, MNRAS, 349, L31
- Snyder (1990) Snyder 1990, in Restoration of HST Images and Spectra, STScI Workshop Proceedings
- Stein et al. (1969) Stein, W.A., Gaustad, J.E., Gillett, F.C., & Knacke, R.F. 1969, ApJ, 155, L177
- Werner et al. (2004) Werner, M., Roellig, T.L., Low, F.J. et al. 2004, ApJS, 154, 1
- Wildi et al. (2003) Wildi, F.P., Brusa, G., Lloyd-Hart, M. et al. 2003, Proc. SPIE, Astronomical Adaptive Optics Systems and Applications, eds. R.K. Tyson & M. Lloyd-Hart, 5169, 17
- Wing et al. (1967) Wing, R.F., Spinrad, H. & Kuhi, L.V. 1967, ApJ, 147, 117
| MMT AO MIRAC3 | Airmass | Exposures | ||
|---|---|---|---|---|
| July 23, 2006 UT | (m) | (m) | no.sec | |
| NML Cyg | 8.80 | 0.88 | 1.10 | 1320 |
| . | 9.80 | 0.98 | 1.18 | 1120 |
| . | 9.80 | 0.98 | 1.02 | 220 |
| . | 11.70 | 1.12 | 1.14 | 1120 |
| Dra (calibrator) | 8.80 | 0.88 | 1.08 | 1530 |
| . | 8.80 | 0.88 | 1.18 | 1530 |
| . | 9.80 | 0.98 | 1.07 | 2030 |
| . | 9.80 | 0.98 | 1.23 | 3630 |
| . | 11.70 | 1.12 | 1.09 | 2030 |
| . | 11.70 | 1.12 | 1.28 | 2030 |
| Spitzer/IRAC | AOR | Exposures | ||
| July 27, 2004 UT | (m) | (m) | no.sec | |
| NML Cyg | 3.550 | 0.750 | 6588416 | 310.4aa Saturated. |
| . | 4.493 | 1.015 | . | 310.4aa Saturated. |
| . | 5.731 | 1.425 | . | 310.4aa Saturated. |
| . | 7.872 | 2.905 | . | 310.4aa Saturated. |
| OBO MN Bolometer | Filter | Exposure | ||
| Aug 10, 2000 UT | (m) | (m) | ||
| NML Cyg | 1.250 | 0.200 | J | n/a |
| . | 1.653 | 0.297 | H | . |
| . | 2.340 | 0.500 | K | . |
| . | 3.647 | 1.152 | L | . |
| . | 4.900 | 0.700 | M | . |
| . | 10.925 | 6.730 | N | . |
| . | 7.908 | 0.755 | . | |
| . | 8.808 | 0.871 | . | |
| . | 9.803 | 0.953 | . | |
| . | 10.273 | 1.013 | . | |
| . | 11.696 | 1.110 | . | |
| . | 12.492 | 1.157 | . | |
| HST/WFPC2 | Filter | Exposures | ||
| Sept 16, 1999 UT | (m) | (m) | no.sec | |
| NML Cyg | 0.4293 | 0.0473 | F439W (B) | 6500bb No detection. |
| . | 0.5337 | 0.1228 | F555W (V) | 20, 100, 4400 |
| . | 0.6564 | 0.0022 | F656N (Hα) | 20, 2260 |
| . | 0.6677 | 0.0867 | F675W (R) | 0.5, 10 |
Note. — Exposure time not applicable to UMN Bolometer since the instrument measures changes in Voltage to obtain instrumental magnitudes and signal-to-noise.
| Instrument | Filter | (m) | Flux (Jy) | (Jy) | |
|---|---|---|---|---|---|
| HST/WFPC2 | |||||
| Sept 16, 1999 UT | |||||
| V | 0.5337 | 2.377e-04 | 0.003e-04 | ||
| Hα | 0.6564 | 2.395e-03 | 0.014e-03 | ||
| R | 0.6677 | 6.124e-03 | 0.029e-03 | ||
| OBO MN Bolometeraa Observational errors exclude typical % systematic uncertainties. | |||||
| Aug 10, 2000 UT | |||||
| J | 1.250 | 21.5 | 1.4 | ||
| H | 1.653 | 131 | 0.7 | ||
| K | 2.340 | 333 | 1.0 | ||
| L | 3.647 | 1287 | 4.2 | ||
| M | 4.900 | 2121 | 10 | ||
| N | 10.925 | 4325 | 58 | ||
| 7.908 | 4522 | 90 | |||
| 8.808 | 4124 | 60 | |||
| 9.803 | 3881 | 43 | |||
| 10.273 | 3905 | 71 | |||
| 11.696 | 5020 | 120 | |||
| 12.492 | 5366 | 84 | |||
| Spitzer/IRAC PSF fittingbb NML Cyg’s mag is near the limit for IRAC PSF fitting (see Schuster et al., 2006b). 5.8 m PSF fitting was not reliable. | |||||
| July 27, 2004 UT | |||||
| 3.6 | 3.550 | 1150 | 160 | ||
| 4.5 | 4.493 | 1670 | 240 | ||
| 8.0 | 7.872 | 4160 | 830 | ||
| MMT AO MIRAC3/BLINCaa Observational errors exclude typical % systematic uncertainties. | |||||
| July 23, 2006 UT | |||||
| 8.80 | 3735 | 63 | |||
| 9.80 | 3780 | 160 | |||
| 11.70 | 5280 | 130 | |||
| IRAS PSCcc Fluxes from the IRAS Point Source Catalog rejects – from the InfraRed Science Archive: http://irsa.ipac.caltach.edu, data tag: ADS/IRSA.Gator#2007/1009/122926_27251. 10% flux uncertainty assumed. | |||||
| 1983 | |||||
| 12 | 5580 | 560 | |||
| 25 | 3990 | 400 | |||
| 60 | 1030 | 100 | |||
| 100 | 335 | 34 | |||
Note. — Photometry not color corrected.
| (m) | Comp. | RA (mas) aa Position offsets are relative to core component, +RA is to the Westbb The errors, including fit uncertainty and field rotation during the observation, is mas. | Dec (mas)aa Position offsets are relative to core component, +RA is to the Westbb The errors, including fit uncertainty and field rotation during the observation, is mas. | Flux (%)cc Percentages are relative to total flux. Uncertainties better than 2%. | (mas)dd FWHM = 2 ee Uncertainty of 10 mas or better | P.A. (∘)ff Major axis () position angle is measured in degrees counter-clockwise from North | |
|---|---|---|---|---|---|---|---|
| 8.8 m | |||||||
| core envelope | 0 | 0 | 74.1 | 91.0 | 1.09 | 120 | |
| outer envelope | 14 | 87 | 25.9 | 171.7 | 1.00 | — | |
| 9.8 m | |||||||
| core envelope | 0 | 0 | 70.4 | 124.0 | 1.20 | 138 | |
| outer envelope | 44 | 105 | 29.6 | 176.5 | 1.00 | — | |
| 11.7 m | |||||||
| core envelope | 0 | 0 | 65.6 | 113.1 | 1.02 | 139 | |
| outer envelope | 45 | 98 | 34.4 | 171.7 | 1.00 | — |
| (m) | Comp. | Flux (Jy)aa Observational errors exclude typical % systematic uncertainties. | ||
|---|---|---|---|---|
| 8.8 m | ||||
| Total Flux | 3735 | 63 | ||
| Core Envelope | 2540 | 67 | ||
| Outer Envelope | 888 | 23 | ||
| Total Residual | 307 | |||
| NWSE Excess bb Negative error includes uncertainties in subtracting the vertical chop bleeding. | 95 | |||
| Vega | 49.5 | |||
| 9.8 m | ||||
| Total Flux | 3780 | 160 | ||
| Core Envelope | 2422 | 114 | ||
| Outer Envelope | 1018 | 48 | ||
| Total Residual | 343 | |||
| NWSE Excess | 121 | 4 | ||
| Vega | 40.2 | |||
| 11.7 m | ||||
| Total Flux | 5280 | 130 | ||
| Core Envelope | 3167 | 101 | ||
| Outer Envelope | 1660 | 53 | ||
| Total Residual | 453 | |||
| NWSE Excess | 170 | 11 | ||
| Vega | 28.4 | |||
Note. — Photometry not color corrected.