NGC 6340: an old S0 galaxy with a young polar disc
Abstract
Context. Lenticular galaxies are believed to form by a combination of environmental effects and secular evolution.
Aims. We study the nearby disc-dominated S0 galaxy NGC 6340 photometrically and spectroscopically to understand the mechanisms of S0 formation and evolution in groups.
Methods. We use SDSS images to build colour maps and light profile of NGC 6340 which we decompose using a three-component model including Sérsic and two exponential profiles. We also use Spitzer Space Telescope archival near-infrared images to study the morphology of regions containing warm interstellar medium and dust. Then, we re-process and re-analyse deep long-slit spectroscopic data for NGC 6340 applying novel sky subtraction technique and recover its stellar and gas kinematics, distribution of age and metallicity with the NBursts full spectral fitting.
Results. We obtain the profiles of internal kinematics, age, and metallicity out to half-light radii. The three structural components of NGC 6340 are found to have distinct kinematical and stellar population properties. We see a kinematical misalignment between inner and outer regions of the galaxy. We confirm the old metal-rich centre and a wrapped inner gaseous polar disc ( kpc) having weak ongoing star formation, counter-rotating in projection with respect to the stars. The central compact pseudo-bulge of NGC 6340 looks very similar to compact elliptical galaxies.
Conclusions. In accordance with the results of numerical simulations, we conclude that properties of NGC 6340 can be explained as the result of a major merger of early-type and spiral galaxies which occurred about 12 Gyr ago. The intermediate exponential structure might be a triaxial pseudo-bulge formed by a past bar structure. The inner compact bulge could be the result of a nuclear starburst triggered by the merger. The inner polar disc appeared recently, 1/3–1/2 Gyr ago as a result of another minor merger or cold gas accretion.
Key Words.:
evolution of galaxies – galaxies: kinematics – galaxies: stellar populations – galaxies: individual (NGC 6340)1 Introduction
According to the morphological classification of galaxies (Hubble, 1936), lenticular, or S0 galaxies represent a transitional galaxy type between ellipticals and spirals. The presence of massive stellar discs makes them resemble spiral galaxies, although lenticulars have, in average, higher bulge luminosities, lower contrast of spiral arms (if any) and lower Hi surface density, as well as very weak star formation. Global colour properties put lenticular galaxies on the “red sequence” in the colour–luminosity relation (e.g. Strateva et al., 2001).
Galaxy morphology is often connected to their environment: Hubble & Humason (1931) were the first to point out the differences between field and cluster galaxy populations. Spitzer & Baade (1951) and Gunn & Gott (1972) have suggested that dynamical effects govern the life of galaxies in clusters and groups: collisions of late-type galaxies should produce early-type ones, and the ram pressure stripping by the intracluster medium would effectively expel the ISM from gas-rich systems (see also Quilis et al., 2000). Moore et al. (1996) proposed another mechanism of the late-to-early type morphological transformation, namely “gravitational harassment” or numerous interactions of a galaxy with other cluster members, although not as catastrophic as major mergers.
Larson et al. (1980) described a different scenario: star formation should strongly deplete the gas in most spirals in a couple of Gyr resulting in the S0-like appearance of galaxies, whereas present-day spirals must have been experiencing external supply of gas, i.e. by accreting tidal debris, minor mergers with gas-rich satellites, or cold gas from cosmic filaments.
Most proposed mechanisms of spiral-to-lenticular morphological transformation result in a gas concentration in the central region of a galaxy triggering a strong circumnuclear starburst, raising the average stellar metallicity. This gas concentration should also decrease the age of the stellar population, if the event occurred quite recently. Given that the peak of S0 formation must have happened at , in a considerable fraction of lenticulars the nuclear starburst should have occurred no more than 5 Gyr ago, which is confirmed by recent observations revealing chemically- and evolutionary-decoupled nuclei in many nearby lenticular galaxies Sil’chenko (2006).
Early-type disc galaxies have been intensively studied during last two decades. One half of the initial sample of 48 early-type galaxies observed in the course of the SAURON project (see Table 3 in Emsellem et al., 2004) are classified as S0s or barred lenticulars. All of them but two were later classified as fast rotators (Emsellem et al., 2007). Stellar populations of early-type disc galaxies (Sil’chenko, 2006; Kuntschner et al., 2006; Sánchez-Blázquez et al., 2006b; Peletier et al., 2007) exhibit great diversity of properties, possibly suggesting the importance of environmental effects on their evolution. However, in most cases, observations did not go beyond one half-light radius (), i.e. providing information only about bulge-dominated regions.
Here we present the studies of internal kinematics and stellar population properties of the lenticular galaxy NGC 6340 out to , where the observed stellar light is dominated by the outer regions of its disc.
NGC 6340 is an early-type disc galaxy, classified as S0-a in the HyperLeda database111http://leda.univ-lyon1.fr (Paturel et al., 2003). Being a group member it does not have any close companions of comparable luminosity. The imagery reveals a bright central concentration and low-contrast spiral structure in the outer parts (Zasov et al., 2008). The bulge is quite bright containing about a quarter of a total galaxy luminosity. Sil’chenko (2000) discovered an old metal-rich nucleus and circumnuclear polar ring inside kpc (or 6 arcsec). She studied the morphology with the HST image, showing an inner dust lane (Carollo et al., 1997; Carollo & Stiavelli, 1998), and derived the velocity field with an integral-field spectroscopy, of field of view arcsec. In this paper, we derive kinematics in the long-slit mode out to 80 arcsec from the centre.
Throughout the rest of this paper we assume the following general properties of NGC 6340: distance of 17 Mpc (assuming km s-1 Mpc-1, km s-1) corresponding to the spatial scale of 82 pc arcsec-1 and distance modulus mag. The galaxy position on the sky corresponds to 0.25, 0.18, 0.13, 0.10, and 0.07 mag of Galactic extinction (Schlegel et al., 1998) in the , , , , and bands respectively.
The paper is organized as follows: in the next Section we present the surface photometry and analysis of light profiles of NGC 6340; Section 3 contains details about spectroscopic observations, data reduction and analysis as well as the kinematical and stellar population properties of the galaxy; in Section 4 we discuss the results obtained.
2 Morphology and internal structure
NGC 6340 is contained in the imaging footprint of the Sloan Digital Sky Survey Data Release 6 (SDSS DR6, Adelman-McCarthy et al., 2008). The data were collected on 20/Sep/2001 using the 2.5 m SDSS telescope at the Apache Point Observatory in the , , , , and photometric bands with the corresponding atmosphere FWHM seeing quality of 1.3, 1.2, 1.0, 0.9, and 1.0 arcsec.
The data have been corrected for the atmosphere extinction and converted into absolute fluxes and corresponding calibrated AB-magnitudes using prescriptions available on the web-site of the SDSS project222http://www.sdss.org/. After having completed several tests we concluded that the sky background subtraction could be done by a simple subtraction of a constant level specified in the FITS-headers of the corresponding data files: attempts of modelling the sky background with the 2-dimensional polynomial did not reveal any statistically significant deviations from the flat level at a region of the frame containing the galaxy.
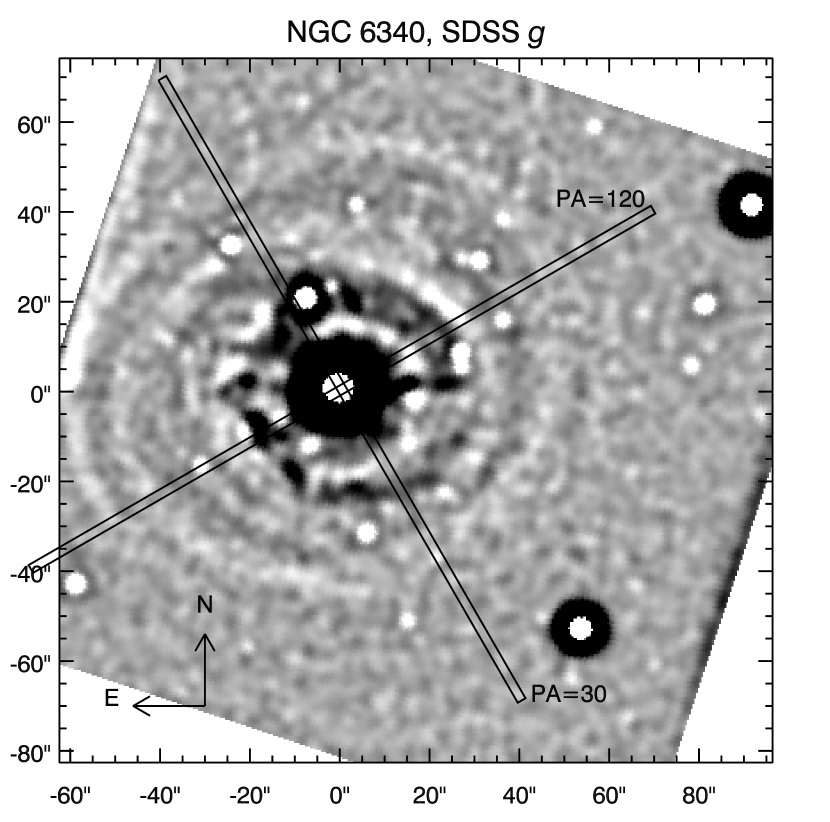
The unsharp-masked band image of NGC 6340 showing its low-contrast shells or spiral arm fragments and dust lanes is displayed in the top panel of Fig. 1. It was obtained by subtracting a Gaussian-convolved image (FWHM arcsec) from the original data and, again, convolving the result with the two-dimensional Gaussian having FWHM arcsec. There is no obvious winding sense for these potential spiral arms, and in the original image, they look more like plateaus of emission, with a sharp drop outside, characterising shells formed in mergers (Hernquist & Quinn, 1988; Dupraz & Combes, 1986). The presence of shells all around the center, with random orientation are typical of small companions accreted by an oblate potential (Dupraz & Combes, 1986).
We built the colour maps of NGC 6340 in order to study the distribution of dust in it. To proceed with this we firstly convolved the images in all photometric bands with the 2-dimensional circular Gaussians corresponding to the squared difference between the corresponding atmosphere seeing and 1.8 arcsec. Then, we have applied the Voronoi adaptive 2D-binning using the algorithm and software package described in Cappellari & Copin (2003) to reach the target signal-to-noise ratio of 80 per bin in the sky subtracted -band image. After that, the binning configurations were used for image tessellation in all 5 bands.
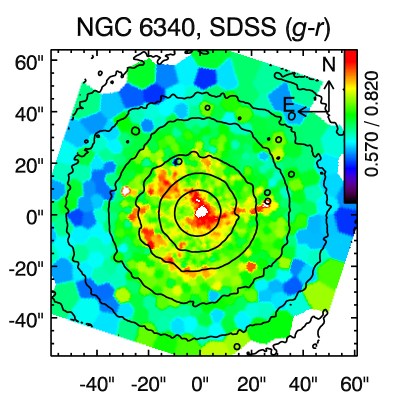
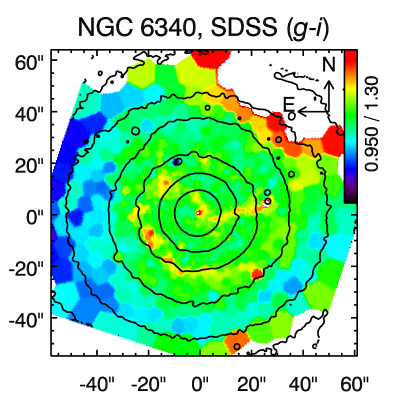
Two colour maps constructed in this fashion are presented in Fig. 1. The dust lanes are clearly visible in the map. Areas with weak ongoing star formation having bluer colours are apparent in the map, for example, one 20–25 arcsec North-East of the galaxy centre tracing a fragment of a spiral arm or shell. Other spiral arm fragments are also noticeable in the outer parts of the presented colour maps. The red colour gradient inwards is evident.
We have fit the elliptical isophotes into the images of NGC 6340 using the algorithm described in Jedrzejewski (1987) and implemented as the stsdas.analysis.isophote.ellipse task in the iraf data processing environment. Prior to the isophote fitting, we created the masks to minimize the influence of foreground stars and NGC 6340 globular clusters on the obtained photometric information. We did this by using the iterative procedure including the ellipse task calls alternating with the threshold-based detection of regions to be included in the mask in the Gaussian-convolved residual images.
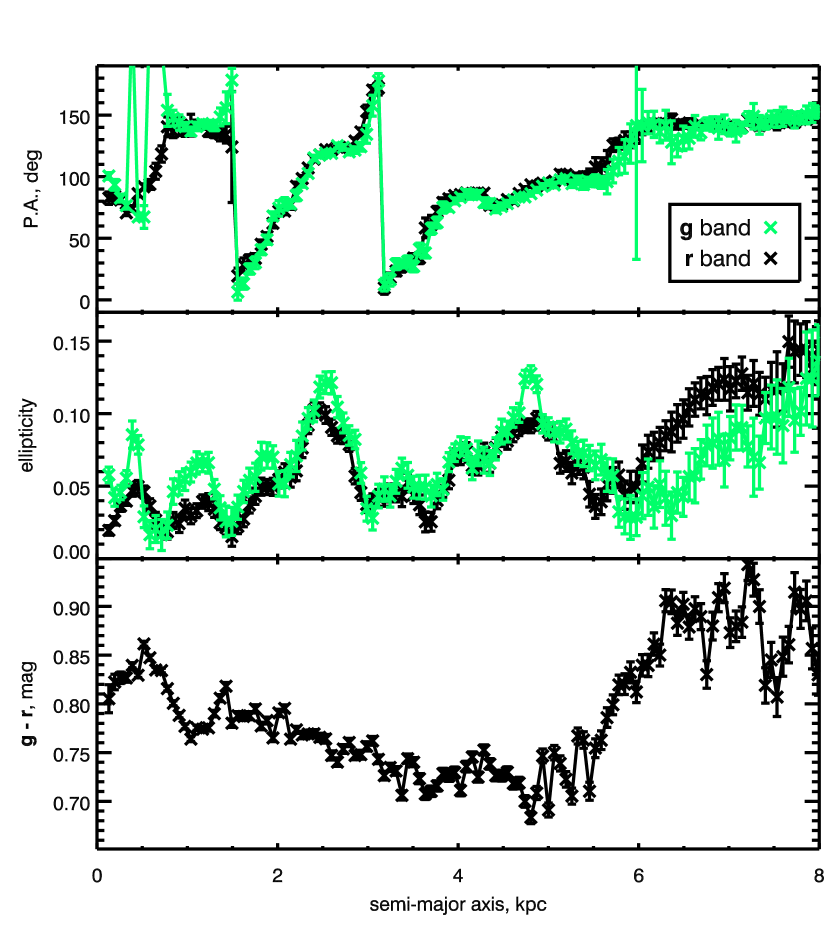
In Fig. 2 we present the radial behaviour of and positional angle (two top panels) in and band and the colour profile. The galaxy exhibits very round isophotes with the ellipticity below 0.06 in the inner part ( kpc). The region between kpc is affected by the presence of spiral arms or shells traced by strong variations of positional angle. Then, the P.A. stays nearly constant at 90 deg out to kpc. In the outermost measured regions of the galaxy the P.A. changes to 145 deg and remains constant from kpc while the ellipticity increases to 0.15. The outer isophotes are slightly rounder in than in .
The colour profile (bottom panel in Fig. 2) comprises several features: red central part, modest negative gradient at kpc, and redder flat outer part. Since the band profile is the deepest among five, less affected by the effects of dust and spiral arms than the band and by the two bright red stars North-West of the galaxy than the band, we used it to perform further analysis.
We have performed the structural decomposition of the -band light profile. Using two-component decomposition including an inner Sersic (1968) and an outer exponential components did not result in a fitting having satisfactory quality: the procedure converged only if we excluded the innermost region, at the same time systematic differences between the model and the data were evident at radii beyond 40 arcsec. The residuals were significant between 12 and 25 arcsec, where an excess of light over an outer exponential disc is evident.
Therefore we decided to model the light distribution of NGC 6340 using three-component model comprising the inner Sérsic and two exponential profiles. This modelling resulted in a good quality of fitting everywhere from the galaxy centre out to 140 arcsec.
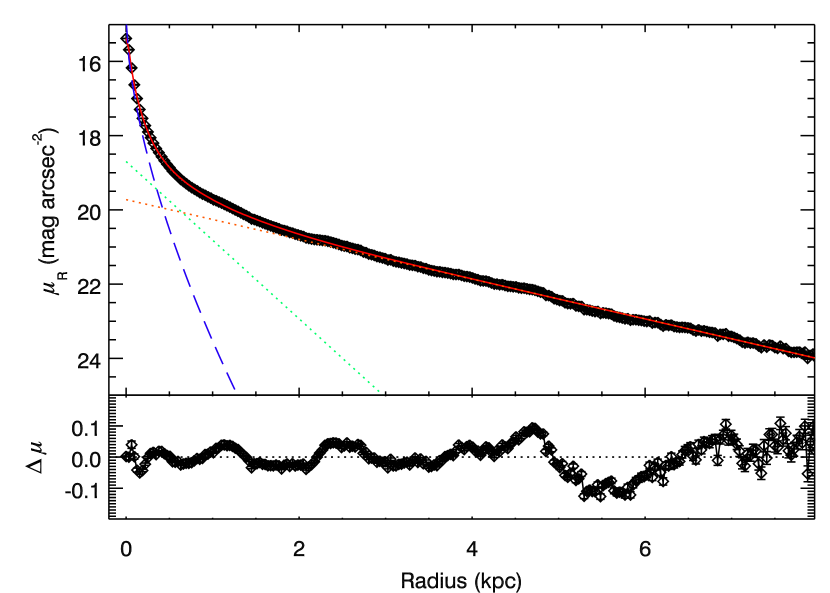
We used the nonlinear optimization using the Levenberg-Marquardt technique of the 7 parameters of all three components simultaneously (Sérsic profile presented by its effective radius, effective surface brightness and index, two exponential profiles presented by their central surface brightness values and exponential lengths). We fitted the data points at radii arcsec. In order to fit the central surface brightness value, the model was convolved with the radially-averaged point spread function determined empirically by measuring several individual stars on a CCD frame in the regions close to the galaxy. Note that a procedure similar to ours was applied to perform the light profile decomposition of 2 barred lenticulars by Erwin et al. (2003) and the first evidences of nested exponential structures were given.
The procedure is very sensitive to the initial guess, therefore we had to proceed as follows to find it:
-
•
Fitting only the outer part of the profile ( arcsec) with the single-component exponential model to get the parameters of the outer disc.
-
•
Fitting the two-component model of the profile ( arcsec) fixing the outer disc parameters in order to get the initial guess for the parameters of the inner disc.
-
•
The four parameters were fixed and the inner Sérsic profile was fit.
-
•
The resulting set of 7 parameters was used as an initial guess to fit the three-component model varying all 7 parameters.
The parameters of the best-fitting 3-component model of the -band light profile are presented in Table 1.
| Sérsic | 1st Disc | 2nd Disc | |
|---|---|---|---|
| kpc | 0.195 0.003 | ||
| 1.66 0.04 | |||
| mag arcsec-2 | 17.99 0.16 | ||
| mag arcsec-2 | 18.46 0.55 | 19.60 0.15 | |
| kpc | 0.49 0.02 | 2.02 0.02 | |
| mag arcsec-2 | 17.04 0.16 | 19.59 0.55 | 20.72 0.15 |
| mag |
The outer large scale disc contains 80 per cent of the total galaxy luminosity, with an exponential length of about 2 kpc and a central surface brightness 20.8 mag arcsec-2 converted into the -band. The inner disc contains 13 per cent of the luminosity, having a four times smaller exponential length, however a higher -band surface brightness of 19.6 mag arcsec-2. The remaining 7 per cent of the galaxy light are coming from a very compact high-surface brightness ( mag arcsec-2) nuclear bulge with a half-light radius of only about 0.2 kpc. The total luminosity of NGC 6340 recovered from our 3-component model corrected for the Galactic extinction and converted into the -band, mag, places the galaxy into the class of intermediate-luminosity lenticulars.
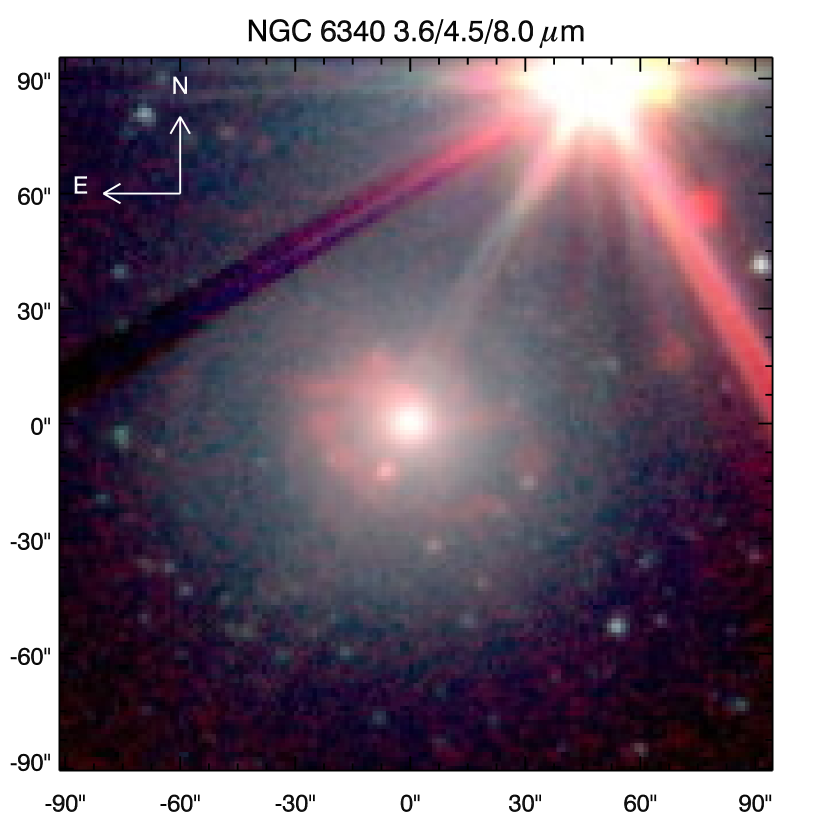
NGC 6340 was observed with the Spitzer Space Telescope in the frame of the nearby galaxy survey. We accessed the fully calibrated 4 band near-infrared data presented in Pahre et al. (2004) through the leopard tool available for download at the Spitzer Space Telescope Archive. The galaxy images are strongly affected by the bright star 100 arcsec North-West of NGC 6340. However, qualitative analysis is possible from colour maps constructed from images at 3.6 to 8 m. In Fig. 4 we present the false colour composite image constructed from NIR Spitzer data. The 8 m data shown in red, tracing the presence of poly-aromatic hydrocarbons in the regions with ongoing star-formation are of particular interest. The galaxy exhibits similar features to the optical colour maps, but they are more evident. We see a structure resembling a one-arm spiral, which seems to be connected to the peculiarities of emission-line kinematics presented and discussed below.
3 Insights from deep long-slit spectroscopy
3.1 Observations, data reduction and analysis
The spectroscopic observations of NGC 6340 were obtained in the course of the observing project “Discs of lenticular galaxies” (P.I.: AZ) using the SCORPIO universal spectrograph (Afanasiev & Moiseev, 2005) mounted at the prime focus of the 6-m Bol’shoy Teleskop Azimutal’nyy (BTA) at the Special Astrophysical Observatory of the Russian Academy of Sciences (SAO RAS). The long-slit spectroscopic mode of SCORPIO using the VPHG2300G grating provides an intermediate spectral resolution () in the wavelength range covering blue-green spectral region ( Å) with the 6 arcmin long 1.0 arcsec wide slit. The 20482048 pixels EEV CCD42-40 detector was used binning the data by a factor of 2 along the slit resulting in the spectral sampling of about 0.75 Å pix-1 and spatial scale of 0.357 arcsec pix-1.
The kinematical analysis of these data for have already been published (Zasov et al., 2008) together with three other lenticular galaxies. The observations we refer to were obtained during two observing runs in May 2005 (P.A.=120 deg, texp=7200 s, seeing=3.5 arcsec) and July 2006 (P.A.=30 deg, texp=9644 s, seeing=1.62.5 arcsec). Poor atmosphere transparency and cloudiness severely affected the first observing run reducing the effective exposure time to s.
The positional angles of the slits were chosen based on the major axis deg reported in the UGC catalogue (Nilson, 1973). The slit positions are shown in Fig. 1 (top panel) on top of the unsharp-masked image of the galaxy. The deg dataset has very high signal-to-noise ratio exceeding 150 per spectral element per slit pixel in the centre of the galaxy.
Due to the flexure of the telescope and spectrograph described in Moiseev (2008), arc-lines and internal flat field calibration frames were taken at night time during observations. Additional calibration included spectrophotometric standard stars and high-resolution twilight spectra which we used to measure and then take into account variations of the spectrograph’s line-spread-function (LSF).
We reduced the data in the itt idl package derived from the data reduction package developed at SAO RAS. The primary data reduction steps comprising bias subtraction, flat fielding, removing cosmic-ray hits using Laplacian filtering (van Dokkum, 2001) were applied to all science and calibration frames. Then, we built the wavelength solution by identifying arc lines and fitting their positions with the two-dimensional polynomial of the 3rd order in the both dimensions, along and across dispersion and linearized the spectra. The obtained wavelength solution had fitting residuals of about 0.08 Å RMS mostly due to the statistical errors of the determined arc line positions. We did not increase the power of the polynomial surface, because the fitting procedure becomes unstable and very sensitive to the positions of individual (faint) arc lines, and at the same time we have a technique to take into account the systemic errors during the data analysis. The error frames were computed using the photon statistics and processed through the same reduction steps as the data.
After that, we binned the linearized twilight spectra obtained during the corresponding observing runs using 64 equal 16-pixels wide intervals along the slit to increase the signal-to-noise ratio to several hundred per spectral element. We fitted the high-resolution () solar spectrum from the ELODIE.3.1 (Prugniel et al., 2007) stellar library against these twilight spectra in five wavelength segments overlapping by 20 per cent covering the spectral range of the SCORPIO setup using the penalized pixel fitting procedure by Cappellari & Emsellem (2004). The radial velocities deviating from zero obtained from the fitting indicated the systemic errors of the wavelength solution mapped over the field of view and wavelength range of the spectrograph, while velocity dispersion and higher-order moments of the Gauss-Hermite parametrization and (van der Marel & Franx, 1993) gave information about the spectral resolution and deviations of the SCORPIO’s LSF from Gaussian. The coefficients of the LSF parametrization along the slit are smoothed using splines.
All details regarding the spatial, spectral and time variations of the SCORPIO’s LSF will be given in Novikova & Chilingarian (in prep.), here we give a short summary. (1) The systemic errors of the wavelength solution change smoothly from -15 km s-1 to zero from blue to red end of the covered spectral domain with little variations along the slit of on order of 5 km s-1. The behaviour is very well reproduced between the observing runs (within 1–2 km s-1) and is probably connected to imprecise tabulated wavelengths of the blended arc lines in the blue part or/and insufficient power of the polynomial used to fit the 2D wavelength solution. (2) Spectral resolution (), , and demonstrate significant variations along the slit: in its central part the LSF is very close to Gaussian with km s-1 at all wavelengths, only remains modestly negative, whereas it degrades toward outer slit regions, by about 40 per cent at the lower part of the CCD-frame (slit positions between 0 and 1 arcmin) and half of this at the upper part. The deviations from Gaussian also become very important, reaching and . (3) Behaviour of , , and in the red part of the wavelength range (Å) depend of the focusing of the spectral camera, but remain stable during the observing run once the focus position has been set. This explains the importance of obtaining twilight spectra during every observing run.
The mapping of the SCORPIO’s LSF is essential for the precise sky subtraction. Since we did not have separate sky exposures we had to construct the model of the air-glow night sky emission based on the spectra from the peripheral regions of the slit which were not contaminated by the galaxy’s light. The LSF exhibits important variations and spectral resolution degrades toward outer parts of the slit, therefore we proposed the following procedure for creating the night sky model.
-
1.
We create a high signal-to-noise night sky spectrum by co-adding spectra over large regions in the outer parts of the slit
-
2.
The LSF properties and its variations along the wavelength for this co-added night sky spectrum are obtained by fitting the Solar spectrum as explained above using the twilight spectrum assembled from the same regions of the slit
-
3.
In several slightly overlapping wavelength intervals (usually, 5 or 6), where the wavelength-dependent LSF variations can be neglected, we perform the correction of the LSF in the co-added sky spectrum bringing its shape to one determined at a given position along the slit, hence constructing a model sky spectrum at a given position, using the mathematical properties of convolution in the Fourier space as follows:
(1) where denotes a sky spectrum at the position along the slit having its parametrized LSF ; is the co-added night sky spectrum with the LSF , and , are for the direct and inverse Fourier transforms respectively.
The night sky spectrum at every slit position created in this way has the LSF corresponding to one determined by fitting the twilight spectra. The usage of parametrized LSF instead of Fourier-transformed original twilight spectra at a given slit position is required to achieve a certain level of regularization and avoid noise amplifications at some frequencies which may be caused by the Fourier-based signal transformation technique described above.
The resulting model of the night sky emission was subtracted from the spectra. Then, we performed the flux calibration using the observations of the spectrophotometric standards.
The application of this technique to the NGC 6340 data produced excellent results: for the deg dataset we are able to reliably subtract the night sky emission even in the regions of the galaxy having a -band surface brightness as low as 25 mag arcsec-2.
The spectra of NGC 6340 were binned adaptively along the slit by starting from the photometric centre and co-adding consequent pixels outwards until a given target signal-to-noise ratio had been reached. This approach allowed us to analyse the data even in the periphery of the galaxy where the surface brightness was quite low by degrading the spatial resolution of the data. All further spectral data analysis was applied independently to every spatial bin.
We fitted high-resolution pegase.hr (Le Borgne et al., 2004) simple stellar population (SSP) models against the observational data using the NBursts full spectral fitting technique (Chilingarian et al., 2007c, b). The models were computed using the Salpeter (1955) stellar initial mass function and the high-resolution stellar library ELODIE.3.1 (Prugniel et al., 2007). The fitting algorithm works as follows: (1) a grid of SSP spectra with a fixed set of ages (nearly logarithmically spaced from 20 Myr to 18 Gyr) and metallicities (from 2.0 to 0.5 dex) is convolved with the wavelength-dependent instrumental response of SCORPIO as explained in Section 4.1 of Chilingarian et al. (2007c); (2) a non-linear least square fitting against an observed spectrum is done for a template picked up from the pre-convolved SSP grid using 2D-spline interpolation on and , broadened according to the line-of-sight velocity distribution (LOSVD) parametrized by , , , and and multiplied pixel-by-pixel by the order Legendre polynomial, resulting in parameters determined by the non-linear fitting. The penalization based on the values of high-order Gauss-Hermite moments is applied to the as explained in Cappellari & Emsellem (2004) in order to bias the LOSVD towards pure Gaussian in case of low signal-to-noise ratio and/or insufficient spectral sampling. In our case the reliable determinations of and are achievable only in the inner 10 arcsec from the galaxy centre.
For the data analysis presented hereafter we adopted the 13th order multiplicative continuum and no additive continuum. The needs for multiplicative continuum and possible side-effects have been presented and analysed in detail in Appendix A2.3 of Chilingarian et al. (2007c), Appendix B1 of Chilingarian et al. (2008b), and Koleva et al. (2008), where it was also shown that the NBursts full spectral fitting produces consistent stellar population parameters with those derived from the measurements of the Lick indices (Worthey, 1994), being several times more precise.
To avoid possible biases of the stellar population parameters caused by the contamination of the spectra by emission lines, we have excluded the 20 Å-wide regions around H ( Å), [Oiii] ( Å) and [Ni] ( Å) emission lines redshifted accordingly to the mean radial velocity of the galaxy as well as the Hgi ( Å) line originating from the light pollution. Chilingarian (2009) demonstrated that H contains 20 per cent of the age-sensitive information at maximum when using NBursts technique in the spectral range similar to ours, therefore excluding it from the fitting neither biases age estimates (see also Appendix A2 in Chilingarian et al., 2007c and Appendix B in Chilingarian et al., 2008b), nor degrades significantly the quality of the age determination. For our study it is also important that: (1) velocity dispersions can be precisely determined at down to 1/3–1/2 of the spectral resolution (i.e. 25–30 km s-1 for our data) and these measurements remain unbiased (see e.g. Koleva et al., 2007 and Section 2 in Chilingarian et al., 2008a); (2) luminosity-weighted values of ages and metallicities are insensitive to the /Fe ratios of the populations being fit (Chilingarian et al., 2008b; Koleva et al., 2008) even though pegase.hr models at solar and moderately subsolar metallicities are representative of [/Fe] = 0.0 dex. Here we fit the spectra using single-SSP models, therefore the returned age and metallicity estimates are SSP-equivalent.
Uncertainties of our estimates of stellar kinematics are at least twice lower than those published in (Zasov et al., 2008) mostly due to better matching of the NGC 6340 by SSP models compared to empirical stellar templates and to more precise sky subtraction in the outer regions of a galaxy. In addition, a precise modelling of the stellar continuum enabled us to extract the ionised gas kinematics from very faint emission lines left in the fitting residuals.
3.2 Stellar kinematics
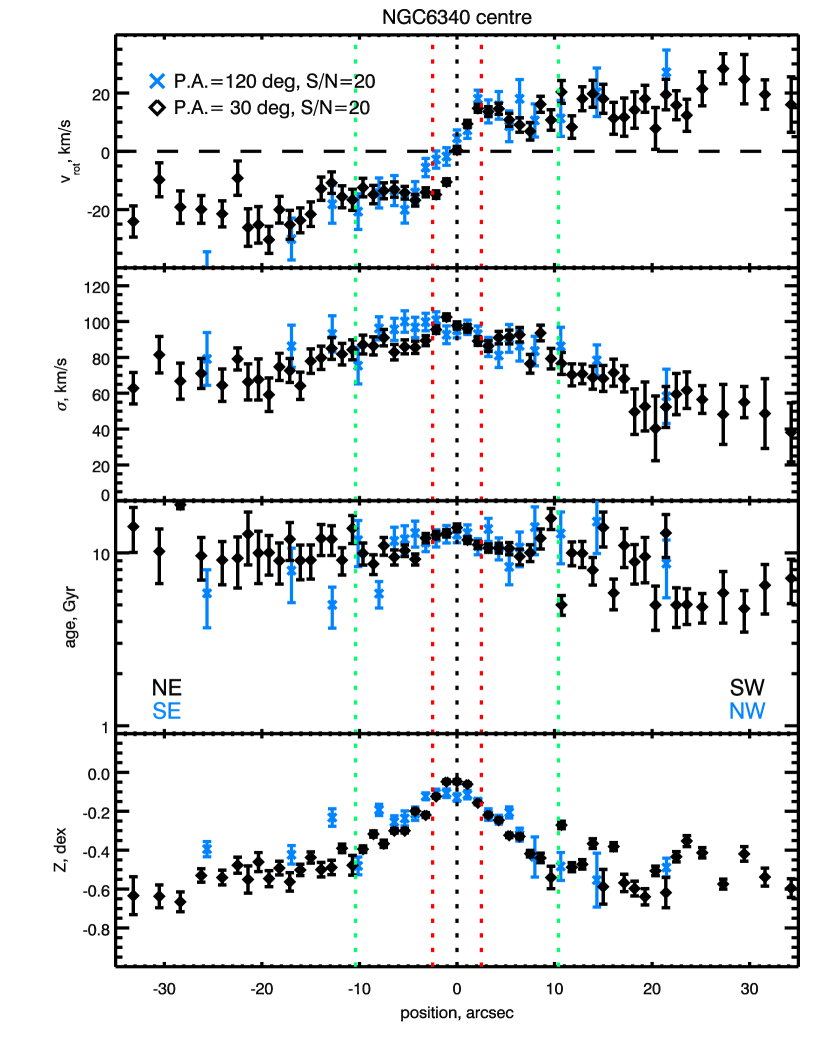
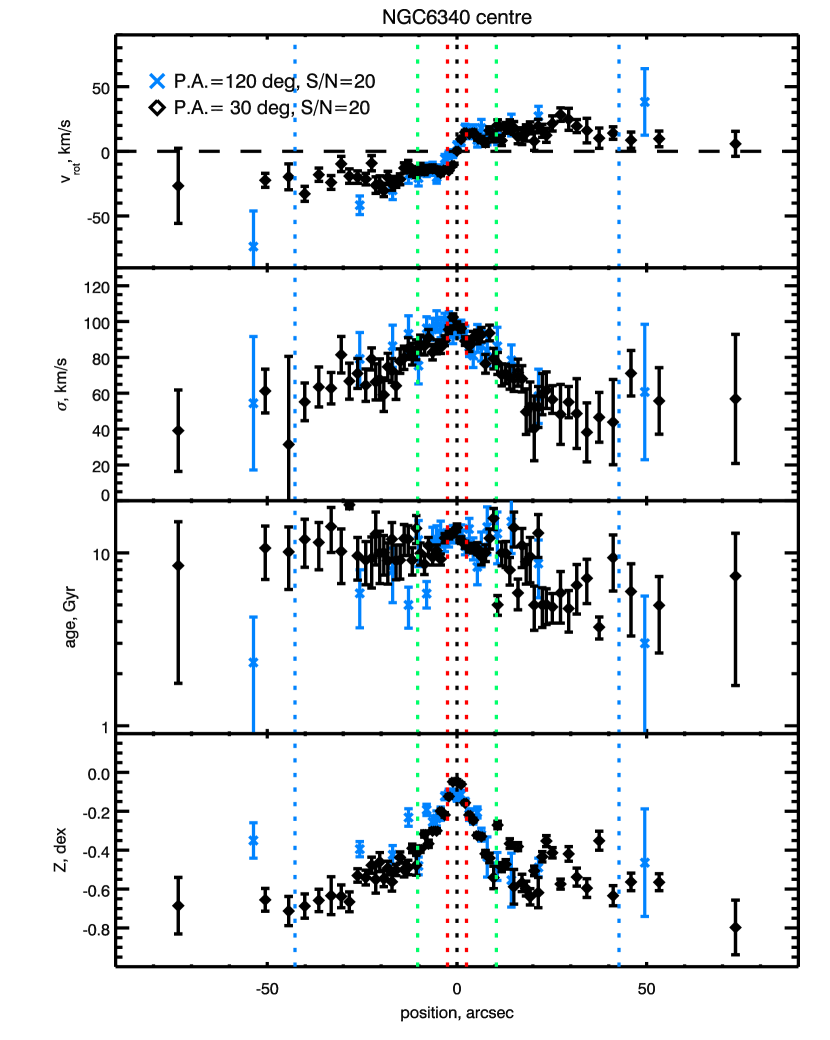
The obtained profiles of radial velocities and velocity dispersion are presented in Fig. 5 (top two panels of each group of four). The kinematical counterparts of the photometrically detected structural components described in the previous section are clearly seen.
The rotation is immediately evident in both kinematical profiles suggesting that initially selected slit positions did not correspond to the galaxy major and minor axes. We qualitatively estimated the parameters of orientation of the outer and intermediate structural components of NGC 6340 by deprojecting the kinematical profiles following the usual approach for a thin disc. Then, if the galaxy velocity field can be represented with a pure disc rotation, the deprojected kinematical profiles should coincide in case the systemic velocity (), major axis positional angle (), and inclination () values are set correctly. Or, the other way round, the galaxy orientation parameters and its systemic velocity can be determined assuming a model of pure disc rotation by reaching the best agreement between the deprojected profiles.
In case of NGC 6340 due to its almost face-on orientation, this technique does not provide good precision. Nevertheless, even the qualitative estimates of the orientation turn to be very different in the outer and inner regions of the galaxy. The inner region ( arcsec) dominated by the inner exponential structure in the light profile corresponds to deg, whereas in the outer parts ( arcsec) it changes to deg. The inclination in both cases is between deg. Although, the statistical errors of the estimates are as large as 5–7 deg, the kinematical misalignment between the two substructures is evident.
We reach the flat part of the rotation curve at about arcsec, corresponding to 3.2 kpc.
The absence of gaseous radial velocity profile and the low inclination of the disc makes the estimate of circular velocity not too reliable. Nevertheless, we estimated its approximate value from the available data. Indeed, the line-of-sight velocity difference at arcsec, where the velocity profile flattens, is km s-1 (see Fig. 5). It nearly coincides with about 140 km s-1 obtained by Bottema (1993) for P.A.130 deg and the same radial interval, but a little higher than km s-1 within arcsec obtained from the same data with a different data processing technique (Zasov et al., 2008). We accept the radial component of the velocity of rotation to be close to 70 km s-1, which corresponds to the full km s-1 after correction for deg. For the line-of-sight velocity dispersion close to 50 km s-1 at these radii () and the ratio the circular velocity corrected for the asymmetric drift is km s-1. The main contribution into uncertainties is given by the low, poorly-determined disc inclination. It is worth comparing this value with the total corrected observed line width of the Hi line km s-1 (Springob et al., 2005), which, after being divided by corresponds to km s-1. This value exceeds by 30–40 km s-1 the circular rotation obtained for the stellar disk, which may be explained if we accept that Hi is concentrated in the inner 10 arcsec. Indeed, the observed LOSVD within 10 arcsec for the emission lines is much higher than for the stellar velocity of rotation reaching about 100 km s-1 (see Fig. 6).
Having the maximal circular velocity of about 200 km s-1 and the luminosity mag, NGC 6340 nicely fits to the Tully–Fisher (1977) relation for the lenticular systems, although the latter is characterized by significant dispersion (Bedregal et al., 2006). Hence, this galaxy possesses a quite normal mass-to-light ratio for the lenticular galaxies of similar luminosities.
The velocity dispersion profiles have a little central bump km s-1 corresponding to the inner compact pseudo-bulge and a plateau having km s-1 at arcsec corresponding to the inner region of the inner exponential structure. Then the values smoothly decrease to km s-1 in the large-scale disc going down to km s-1 at of the outer disc (5.8 kpc).
The observed line-of-sight velocity dispersion of stellar components of the disc of NGC 6340 along two P.A.s was recently compared with those expected for the marginally stable disc using the method of numerical modelling of the live collisionless disc embedded into the rigid pseudo-isothermal halo (Zasov et al., 2008), where it was found that the disc of this galaxy, unlike the discs of many spiral galaxies, is significantly overheated, that is the observed velocity dispersion exceeds the minimal values needed for the disc to be marginally stable to gravitational and bending perturbations. It supports the idea that this galaxy has experienced a major merger or several minor mergers in the past.
The coefficient (not shown) demonstrates symmetric behaviour raising from 0.03 in the centre to the maximal value of 0.08 at arcsec and then smoothly decreasing to zero at arcsec. displays modestly positive values at the eastern part of the galaxy (in both datasets) starting from 0 at the centre, reaching the maximum of 0.06 about arcsec east of the centre then going down to zero at arcsec, at the same time staying at zero level west of the centre. This strange behaviour evidently reflects the presence of two overlapping structures with different kinematical properties and relative luminosities.
3.3 Stellar populations
The profiles of the SSP-equivalent age and metallicity measurements are presented in Fig. 5 (two lower panels in each group).
The metallicity profiles exhibit clear three-component structure: (1) central plateau with the constant level metallicity dex and a size corresponding to the inner compact pseudo-bulge; (2) inner sharp exponential gradient (i.e. linear in the plots since the metallicity is already presented in logarithmic units of dex) in the region corresponding to the inner exponential structure with a break at arcsec; (3) outer weak exponential gradient, corresponding to the large-scale disc.
We have measured the parameters of metallicity gradients in the 2nd and 3rd regions by fitting two-side linear functions in the regions and arcsec of the deg dataset and, hence, obtained the extrapolated central values and gradient slopes per kpc and per characteristic exponential length of a given structure. The central extrapolated metallicities measured in this manner were found to be dex and dex for the inner and outer discs respectively. The corresponding gradient slopes per kpc and per exponential length are dex/kpc dex/exp.l and dex/kpc dex/exp.l.
The age profile also traces the presence of three structural components, but at the same time it displays the asymmetric behaviour in the inner region evident in the measurements derived from the deg dataset. The North-East part () is Gyr older than South-West ( Gyr), although at arcsec at both sides the age becomes similar ( Gyr). The outer disc also exhibits similar asymmetry in the age distribution, being generally younger ( Gyr) than the inner region of NGC 6340. This is probably connected to the presence of an thin inclined disc containing dust and a small amount of young stellar population (see below).
We would like emphasize here that the excellent quality of spectroscopic data we analyse in this work results in the statistical errors of the stellar population parameters significantly beyond the quality of the evolutionary synthesis models. Therefore, the absolute values of ages and metallicities should not be trusted at the error levels provided. They may change if we, for instance, replace ELODIE.3.1 with another stellar library, or use different evolutionary tracks when running the pegase.hr code. Studies of all these effects are far beyond the scope of this paper. However, the differential behaviour of recovered stellar population properties (i.e. gradients, asymmetries, differences of age/metallicity between different structural components) is reliable.
Our results qualitatively agree with Sil’chenko (2000) arguing for the presence of a chemically decoupled nucleus in NGC 6340. The metallicity difference we obtain between the nucleus and at arcsec, dex coincides with the measurements by Sil’chenko (2000) based on the iron line-strength index. Nuclear and bulge age estimates obtained from more recent analysis of the same data (Sil’chenko, 2006) given their large uncertainties are also in agreement with our measurements.
3.4 Kinematics of ionized gas
We have analysed the emission line kinematics of NGC 6340 by fitting single-component Gaussians into the residuals of the stellar population fitting at the positions corresponding to H and [Oiii] ( Å). The resulting positions and line widths were corrected correspondingly to the spectrograph’s LSF at a given slit position and wavelength. The emission line fluxes obtained from the best-fitting as products of line intensities and widths were used to calculate the [Oiii]/H emission line ratio.
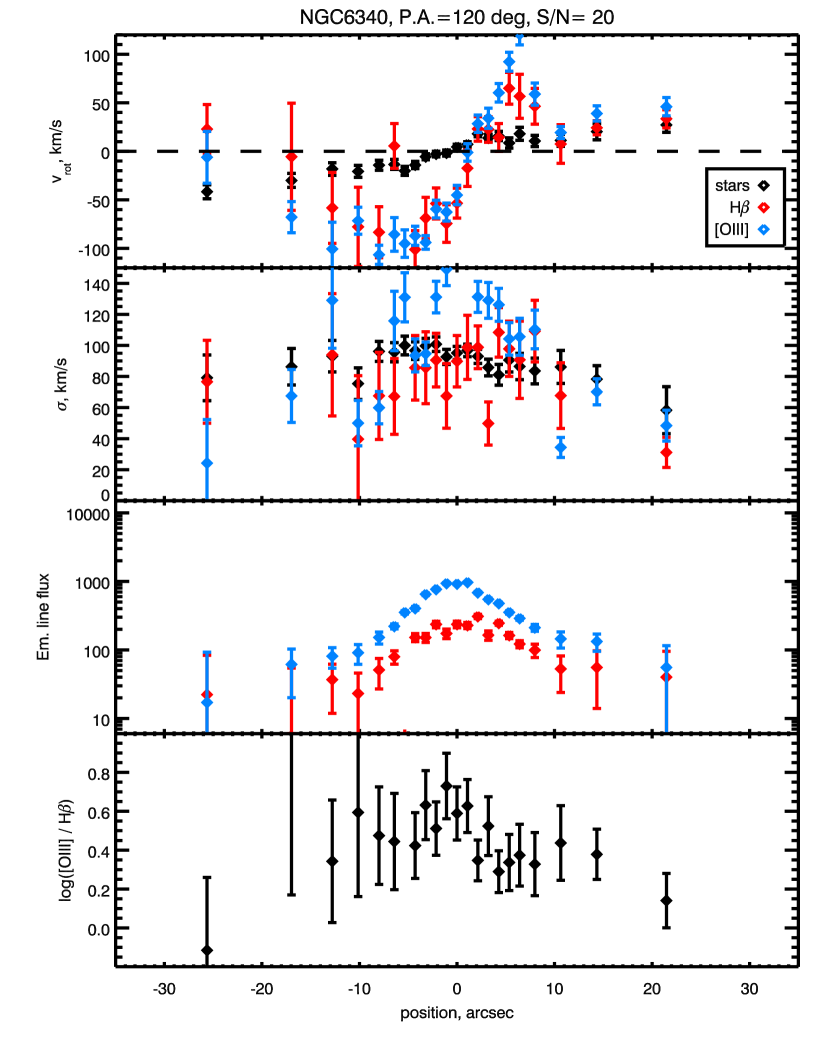
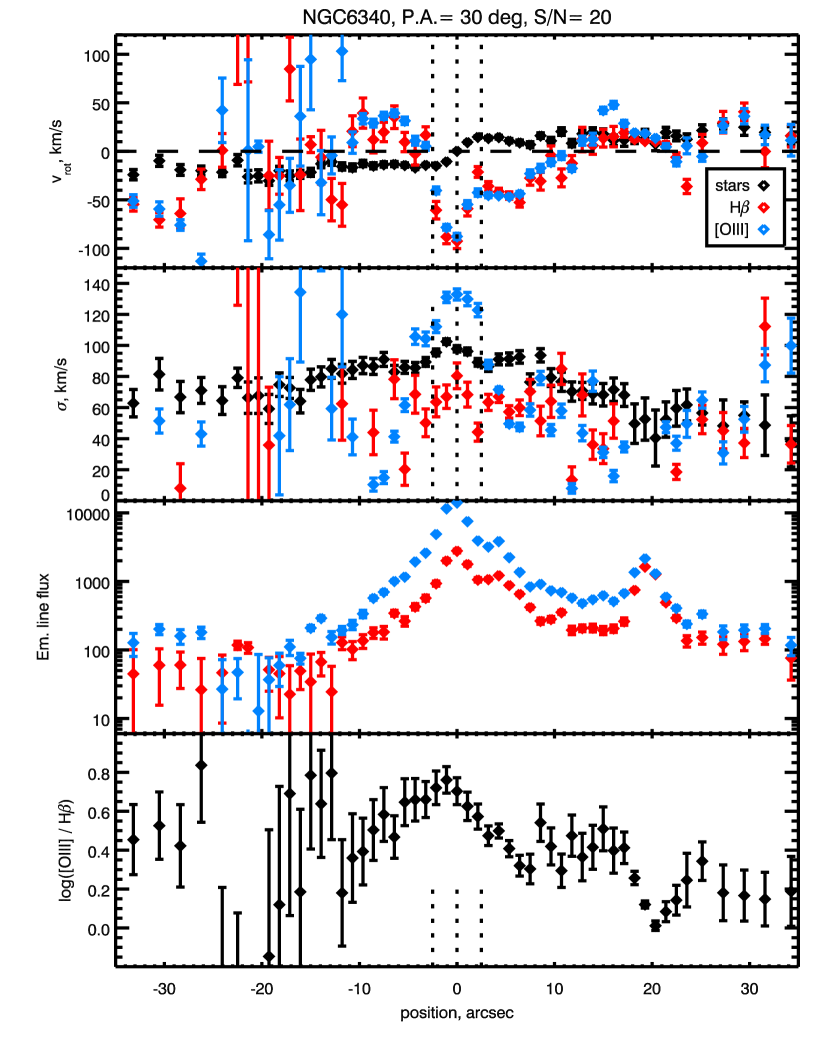
The ionized gas in the inner region of NGC 6340 exhibits fast rotation at arcsec, reaching km s-1 in projection in the deg dataset. At the same time it counter-rotates to the stars in the deg dataset arguing for a presence of the highly inclined disc-like structure. The central parts of both profiles are very irregular: central values in the deg slice differ from the stellar velocities by about km s-1 which was obvious yet from the Fig. 10 of Sil’chenko (2000). The deg profile explains this discrepancy: in the circumnuclear region we see a sharp “drop” of the radial velocity ( km s-1) slightly (1 arcsec) offset from the photometric centre of the galaxy to NE. Interestingly, the intensity of the forbidden nitrogen line [Nii] in this direction is higher than in the opposite which is clearly seen by the asymmetric elongated toward bottom-left contours in Fig. 7 of Sil’chenko (2000).
Applying the kinematical deprojection technique to determine the orientation of this disc is quite problematic because of the central region affected by the “drop”. Nevertheless, the approximate parameters of this structure are: deg, i.e. different by deg from the kinematical major axis of the inner exponential profile; inclination is between 40 and 60 deg depending on which radii from the centre are used to combine the profiles probably suggesting the strong warp of the observed structure.
In the region corresponding to the “drop” of the radial velocity, the [Oiii] emission lines exhibit very strong asymmetry and its width reaches km s-1. The emission lines are stronger in the western part of the galaxy than in the east, which is evident from the line flux plots (2nd bottom panels) in Fig. 6.
4 Discussion
4.1 Structural properties of NGC 6340
In the previous section we have shown that the main stellar body of NGC 6340 comprises three well-defined structural components having different properties of their stellar populations.
The fast-rotating outer disc with high is reminiscent of stellar discs in intermediate-luminosity spiral galaxies, being at the same time modestly older. Kregel et al. (2005) claimed that the high value of the circular velocity of NGC 6340 by Bottema (1993) was overestimated, however, we confirm that earlier result.
The age profile at arcsec exhibits statistically significant “jumps” to lower values than in the surrounding regions with their positions correlated to the loci of dust lanes in the colour maps. Given the asymmetric distribution of dust and absence of a regular spiral pattern in NGC 6340 with fragments of spiral arms or shells observed instead, the asymmetric loci of the “jumps” with respect to the galaxy centre are easy to understand.
The inner exponential structure exhibiting old metal-rich stellar populations is supported mostly by random motions, given the deprojected maximal circular velocity of km s-1 (assuming deg) reached at arcsec, hence resulting in .
In Fig. 7, we present the two projections of the Fundamental Plane (Djorgovski & Davis, 1987, FP) redefined in -space (Bender et al., 1992), where is related to the logarithm of the total mass, is proportional to the , hence measuring “compactness”, and is connected to the logarithm of the dynamical mass-to-light ratio. On the vs. plot (the plane’s “face-on view”), the boomerang-shaped area often interpreted as two distinct regions is occupied by dwarf (Geha et al., 2003; De Rijcke et al., 2005; Chilingarian et al., 2008b; Chilingarian, 2009) and intermediate luminosity and giant early-type galaxies (Bender et al., 1992). There is an extension of the sequence of giant galaxies towards the upper-left corner of the plot by very rare compact elliptical (cE) galaxies with M59cO (Chilingarian & Mamon, 2008) being the most extreme case. Filled red circles display the compact central pseudo-bulge and a superposition of intermediate and outer exponential structures. Since the FP is defined for random motion supported virialized stellar systems, as a first-order approximation we have included the rotational kinetic energy as into the total energetic balance for the inner exponential structure and large-scale disc of NGC 6340.
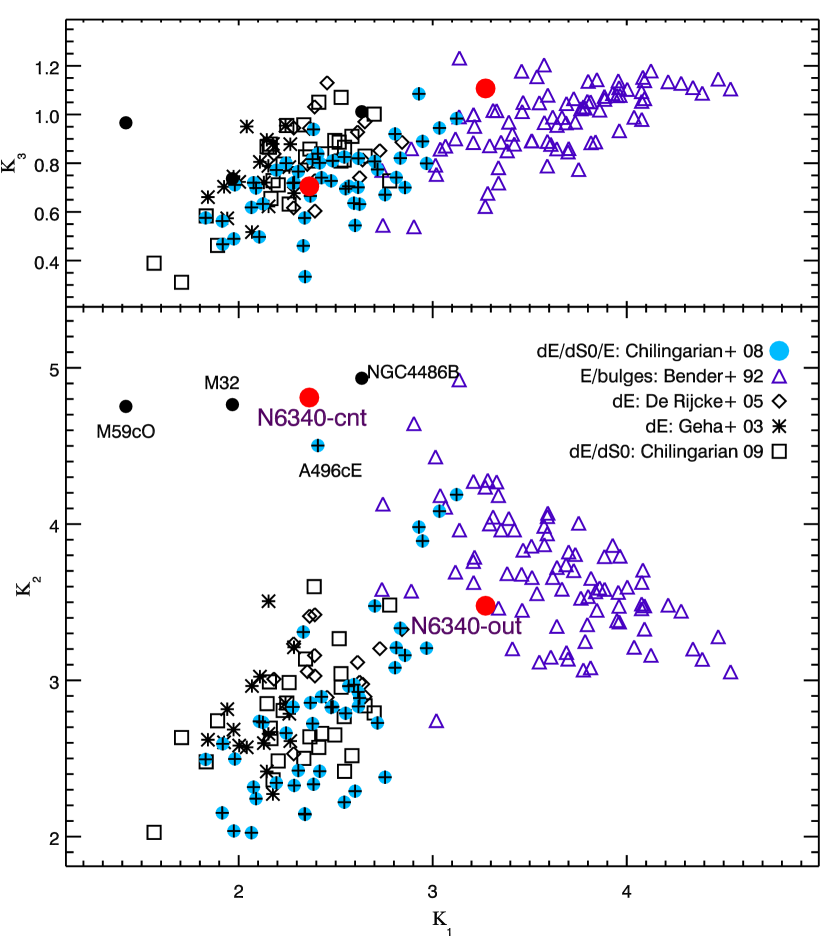
From Fig. 7 it is evident that the central compact pseudo-bulge of NGC 6340 falls into the locus of cE galaxies. These objects are believed to form through the tidal stripping of intermediate-mass disky progenitors (Bekki et al., 2001; Chilingarian et al., 2007a) and always found in the vicinities of massive galaxies claimed to be responsible for the tidal stripping (Chilingarian et al. in prep.) However, the numerical simulations still experience difficulties in reproducing the dramatic increase of the central stellar density required to form objects which can be observationally classified as cEs. An example of an object initially having the stellar surface density comparable to one in the cE galaxies is provided by the central pseudo-bulge of NGC 6340. Then, if NGC 6340 had fallen onto a massive galaxy (e.g. cluster cD) a compact elliptical galaxy could have been formed by the severe tidal stripping of its extended components. Stellar population in the centre of NGC 6340 is very similar to those observed in known cE galaxies (Sánchez-Blázquez et al., 2006a; Chilingarian et al., 2007a). In the inner region of NGC 6340, dominated by the compact pseudo-bulge ( kpc), we roughly estimate the mass contribution of the two outer exponential components by integrating their stellar mass profiles derived from the light profiles and stellar mass-to-light ratios. Since the velocity dispersion of the intermediate exponential structure is close to that in the galaxy centre, we expect its thickness (assuming oblate morphology) to be comparable to the half-light radius of the compact pseudo-bulge, thus, simple comparison of integrated light profiles should provide a good approximation of their contributions to the mid-plane gravitational potential. Our estimate of the stellar mass contribution by the intermediate exponential disc to the total galaxy mass within a half-light radius of the inner compact pseudo-bulge to be of 14–16 per cent at maximum. Therefore, its removal would affect the central stellar velocity dispersion only by 8–9 per cent and will not change significantly the position of the compact pseudo-bulge on the FP. The mass contribution from the outer large-scale disc will be below 2 per cent.
4.2 Inner polar disc in NGC 6340
We confirm the existence of an inclined gaseous disc mentioned as a “starforming polar ring” in Sil’chenko (2000). Given its orientation obtained from the kinematical data and asymmetry in the profiles of NGC 6340 stellar age and emission line fluxes, we conclude that it is rotating counter-clockwise with the SW part above the plane of the main stellar disc of NGC 6340. Its plane is inclined by 40–65 deg with the respect to the large scale stellar disc. If we consider that the polar disc contains dusty ISM observed in the colour maps, and a little amount of young stars, it will explain why the NE part of the galaxy looks older: the old population in the SW part is partially obscured by the dusty young disc in front of it. On the other hand, the main old stellar disc and pseudo-bulge are also expected to contain significant quantities of dust (Driver et al., 2007) even lacking the current star formation, which will explain why the emission line intensities in the part of the young star-forming polar disc behind the main stellar disc are lower.
At radii beyond 12 arcsec the ionised gas co-rotates with the stars proving that we observe an inner polar disc. Origin of inner polar discs still remains a matter of debate. These structures are thought to form by the gas settling onto one of the principal planes of a triaxial bulge (Corsini et al., 2003; Coccato et al., 2007) or a bar. In case of a large-scale gaseous disc counter-rotating to the stars, the inner polar ring may be formed secularly: gas will be captured onto highly inclined stable orbits on its way to the galactic centre. However, in case of co-rotating gaseous and stellar components, as we observe in NGC 6340, the externally supplied gas is needed (see e.g. Sil’chenko & Afanasiev (2004) for a discussion).
The formation of large-scale (outer) and inner polar discs by accretion from a companion has been simulated by Bournaud & Combes (2003), and from cosmic filaments by Macciò et al. (2006) and Brooks et al. (2009). When the accreted gas encounters already pre-existing gas in the main galaxy, it collides and dissipates, quickly getting aligned with the main gaseous disc through differential precession, particularly if the accretion was not exactly polar which seems the case for NGC 6340. However, when there is no pre-existing gas, the accreted gas may remain on quasi-stable orbits for a long time.
Quite recently, an order of a few hundreds Myr ago, NGC 6340 probably experienced a minor merger and accreted a low-mass gas-rich satellite. This event created a structure presently observed both, in kinematical profiles and direct images, as a counter-rotating inclined gaseous disc with a low ongoing star formation and somewhat irregular lopsided structure of dust lanes clearly revealed in the colour maps. This polar disc with a major axis aligned approximately along east-west direction, contains low-contrast spiral arms visible on the composite-colour image of the galaxy out to 50 arcsec from the centre. The non-axisymmetric potential of the large-scale exponential bulge of NGC 6340 drives the ISM of the star-forming disc to the circumnuclear region following a complex trajectory, which we probably see as a complex structure emitting at 8 m at the Spitzer Space Telescope images (Fig. 4). The regions where it crosses the slit at deg are observed as a slightly offset from the centre (1 arcsec to NE) deep negative peak of the ionized gas radial velocity and the secondary positive peak at 16 arcsec SW. We notice that the emission line ratio [Oiii]/H exhibits local maxima at the corresponding regions reaching 0.8 in the (quasi)central peak, uniquely arguing for the shockwave ionisation (Baldwin et al., 1981). Additional spectral data covering H and [Nii] are required for making further conclusions about the ionisation mechanism.
Interestingly, the mentioned secondary peak of the gas radial velocity has neither any visible counterparts in the intensity profiles of emission lines, nor in the colour maps. At the same time, there is a prominent secondary maximum of emission line intensities 19 arcsec SW of the galactic centre ( deg slit). It corresponds to the locus of one of the dust lanes in the colour maps and to the local minima of the [Oiii]/H line ratio and velocity dispersions of both, stars and gas. The luminosity-weighted age in this region is lower and the stellar population is more metal-rich (Fig. 5). We explain this by the superposition of old and young stellar populations from the pseudo-bulge and the star-forming disc: even a low mass fraction of the dynamically cold but young stellar population in the disc will have a large luminosity fraction, biasing the estimations of kinematical and stellar population parameters.
4.3 Origin and evolution of NGC 6340
As it was argued above, NGC 6340 is probably a result of a major merger of two galaxies having unequal masses and/or different morphologies, which happened over 12 Gyr ago and induced a major star formation event. This hypothesis is supported by the internal structure of the galaxy, distributions of its stellar content, and significant disc overheating.
The central region of NGC 6340 corresponding to the innermost Sérsic component of the brightness profile with , i.e. pseudo-bulge, and having metal-rich stellar population ( dex) with no radial gradients, was probably created by the strong star formation event triggered by a major merger. Two super-massive black holes would cause very fast dynamical relaxation resulting in complete mixing of the stars on a short timescale which will wash out any possible structures in the metallicity distribution. This process must have finished a very long time ago, because the presently observed stellar population exhibits old age.
Then, we should interpret the intermediate exponential brightness profile component as an exponential bulge, possibly having triaxial structure and potential responsible for “unusual” kinematical parameters derived from the deprojection of the kinematical profiles assuming disc rotation. The properties of the large-scale outer disc suggest that the masses and/or morphologies of the merged galaxies must have been different. The outer disc exhibits modest internal velocity dispersion and the stellar population younger than the inner region of the galaxy, which probably means that the star formation in it had been continuing much longer and, therefore, it was not so strongly affected by the process of interaction. Due to its almost face-on orientation we are not able to measure reliably the parameter in order to conclude whether or not the disc was strongly dynamically heated.
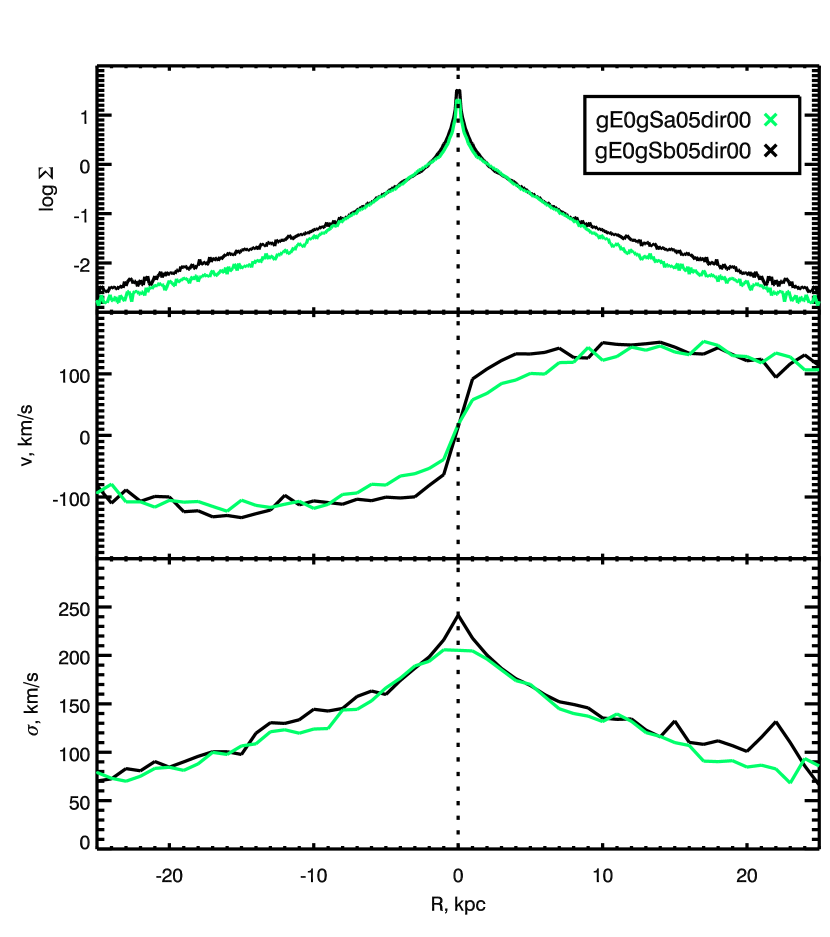
Structural properties of NGC 6340 can be reproduced by numerical simulations. Exploring the GalMer database333http://galmer.obspm.fr/ (Di Matteo et al., 2008) we have found merger remnants having a three-component brightness profiles qualitatively well resembling the one observed in NGC 6340 but having larger sizes of all substructures suggesting the lower masses of NGC 6340 progenitors than those of galaxies in the simulation. The major equal-mass mergers between a non-rotating giant elliptical galaxy (E0) and a spiral (Sa or Sb) on the co-planar prograde orbit of the configuration #5 (experiments gEgSa05dir00 and gEgSb05dir00, see Di Matteo et al., 2007), 3 Gyr after the beginning of the simulation result in a formation of giant lenticular galaxies with large-scale rotating discs, triaxial oblate nearly exponential bulges, and compact mass concentrations in the circumnuclear regions. The kinematical misalignment is observed between the outer disc and the exponential bulge of the remnants. The metallicities of the central compact structures are strongly increased during the strong circumnuclear starburst events induced by the interaction. The gravitational softening of 0.28 kpc did not allow us to study the internal structure of this central mass concentration. Several other equal-mass mergers of spirals and ellipticals also result in remnants having similar three-component density profiles. However, only the remnants of the gEgSa05dir00 and gEgSb05dir00 encounters exhibits high degree of rotation in the outer disc with (Fig. 8).
Somewhat low metallicity of the large-scale disc of NGC 6340 favours the major merger scenario: an equal mass merger as the simulated one would keep a metallicity of the stars in the outer disc from the intermediate-luminosity spiral galaxy having participated in the event, therefore suggesting that the value we observe now should be slightly below the one expected for an early-type galaxy with a mass of NGC 6340.
An interesting conclusion of our study is that the inner compact pseudo-bulge has been formed as a result of a merger, and not through secular evolution, one of the classical scenario to create pseudo-bulges (Kormendy & Kennicutt, 2004).
The interpretation of past events in NGC 6340 is not unique, apart from the likely past merger. Indeed, the more recent gas accretion could be due to tidal debris of the main merger, which take several Gyr to fall back. It could also come from a more recent accretion of a small companion, that could have created the shells, by distributing all its stars in the outer disk. Alternatively, the gas accretion can come from the cosmic filaments, which are not completely heated, since the galaxy is in a small group and not in a cluster.
The gas from filaments is expected to become first very metal-poor ISM. However, it might rapidly be enriched by subsequent star formation. We cannot measure the gas metallicity directly with our data, however, the presence of noticeable extinction and strong dust lanes does not favour the idea of a low-metallicity ISM in the disc.
Acknowledgements.
Authors are grateful to the time allocation committee of the 6-m telescope for providing observing time and to the SAO RAS staff members S. Kaysin and A. Burenkov for the support of the service mode observations. AN and AZ acknowledge the support of the Russian Foundation for Basic Research (projects 07-02-0079 and 08-02-01323). AN thanks EARA ETN, Florence Durret (IAP) and the LUTH laboratory of the Paris Observatory for funding her stay in Paris. IC acknowledges additional support from the RFBR grant 07-02-00229-a. Special thanks to Olga Sil’chenko for useful discussions and comments and to our anonymous referee for constructive advices which helped us to improve the scientific discussion. This research has made use of SAOImage DS9, developed by Smithsonian Astrophysical Observatory; Aladin developed by the Centre de Données Astronomiques de Strasbourg; “exploresdss” script by G. Mamon. Funding for the SDSS and SDSS-II has been provided by the Alfred P. Sloan Foundation, the Participating Institutions, the National Science Foundation, the U.S. Department of Energy, the National Aeronautics and Space Administration, the Japanese Monbukagakusho, the Max Planck Society, and the Higher Education Funding Council for England. The SDSS Web Site is http://www.sdss.org/. This work is based in part on archival data obtained with the Spitzer Space Telescope, which is operated by the Jet Propulsion Laboratory, California Institute of Technology under a contract with NASA.References
- Adelman-McCarthy et al. (2008) Adelman-McCarthy, J. K., Agüeros, M. A., Allam, S. S., et al. 2008, ApJS, 175, 297
- Afanasiev & Moiseev (2005) Afanasiev, V. L. & Moiseev, A. V. 2005, Astronomy Letters, 31, 194
- Baldwin et al. (1981) Baldwin, J. A., Phillips, M. M., & Terlevich, R. 1981, PASP, 93, 5
- Bedregal et al. (2006) Bedregal, A. G., Aragón-Salamanca, A., & Merrifield, M. R. 2006, MNRAS, 373, 1125
- Bekki et al. (2001) Bekki, K., Couch, W. J., Drinkwater, M. J., & Gregg, M. D. 2001, ApJ, 557, L39
- Bender et al. (1992) Bender, R., Burstein, D., & Faber, S. M. 1992, ApJ, 399, 462
- Bottema (1993) Bottema, R. 1993, A&A, 275, 16
- Bournaud & Combes (2003) Bournaud, F. & Combes, F. 2003, A&A, 401, 817
- Brooks et al. (2009) Brooks, A. M., Governato, F., Quinn, T., Brook, C. B., & Wadsley, J. 2009, ApJ, 694, 396
- Cappellari & Copin (2003) Cappellari, M. & Copin, Y. 2003, MNRAS, 342, 345
- Cappellari & Emsellem (2004) Cappellari, M. & Emsellem, E. 2004, PASP, 116, 138
- Carollo & Stiavelli (1998) Carollo, C. M. & Stiavelli, M. 1998, AJ, 115, 2306
- Carollo et al. (1997) Carollo, C. M., Stiavelli, M., de Zeeuw, P. T., & Mack, J. 1997, AJ, 114, 2366
- Chilingarian et al. (2007a) Chilingarian, I., Cayatte, V., Chemin, L., et al. 2007a, A&A, 466, L21
- Chilingarian et al. (2007b) Chilingarian, I., Prugniel, P., Sil’chenko, O., & Koleva, M. 2007b, in IAU Symposium, Vol. 241, Stellar Populations as Building Blocks of Galaxies, ed. A. Vazdekis & R. R. Peletier (Cambridge, UK: Cambridge University Press), 175–176
- Chilingarian (2009) Chilingarian, I. V. 2009, MNRAS, 394, 1229
- Chilingarian et al. (2008a) Chilingarian, I. V., Cayatte, V., & Bergond, G. 2008a, MNRAS, 390, 906
- Chilingarian et al. (2008b) Chilingarian, I. V., Cayatte, V., Durret, F., et al. 2008b, A&A, 486, 85
- Chilingarian & Mamon (2008) Chilingarian, I. V. & Mamon, G. A. 2008, MNRAS, 385, L83
- Chilingarian et al. (2007c) Chilingarian, I. V., Prugniel, P., Sil’chenko, O. K., & Afanasiev, V. L. 2007c, MNRAS, 376, 1033
- Coccato et al. (2007) Coccato, L., Corsini, E. M., Pizzella, A., & Bertola, F. 2007, A&A, 465, 777
- Corsini et al. (2003) Corsini, E. M., Pizzella, A., Coccato, L., & Bertola, F. 2003, A&A, 408, 873
- De Rijcke et al. (2005) De Rijcke, S., Michielsen, D., Dejonghe, H., Zeilinger, W. W., & Hau, G. K. T. 2005, A&A, 438, 491
- Di Matteo et al. (2008) Di Matteo, P., Combes, F., Chilingarian, I., Melchior, A.-L., & Semelin, B. 2008, Astronomische Nachrichten, 329, 952
- Di Matteo et al. (2007) Di Matteo, P., Combes, F., Melchior, A.-L., & Semelin, B. 2007, A&A, 468, 61
- Djorgovski & Davis (1987) Djorgovski, S. & Davis, M. 1987, ApJ, 313, 59
- Driver et al. (2007) Driver, S. P., Popescu, C. C., Tuffs, R. J., et al. 2007, MNRAS, 379, 1022
- Dupraz & Combes (1986) Dupraz, C. & Combes, F. 1986, A&A, 166, 53
- Emsellem et al. (2007) Emsellem, E., Cappellari, M., Krajnović, D., et al. 2007, MNRAS, 379, 401
- Emsellem et al. (2004) Emsellem, E., Cappellari, M., Peletier, R. F., et al. 2004, MNRAS, 352, 721
- Erwin et al. (2003) Erwin, P., Beltrán, J. C. V., Graham, A. W., & Beckman, J. E. 2003, ApJ, 597, 929
- Fukugita et al. (1995) Fukugita, M., Shimasaku, K., & Ichikawa, T. 1995, PASP, 107, 945
- Geha et al. (2003) Geha, M., Guhathakurta, P., & van der Marel, R. P. 2003, AJ, 126, 1794
- Gunn & Gott (1972) Gunn, J. E. & Gott, J. R. I. 1972, ApJ, 176, 1
- Hernquist & Quinn (1988) Hernquist, L. & Quinn, P. J. 1988, ApJ, 331, 682
- Hubble & Humason (1931) Hubble, E. & Humason, M. L. 1931, ApJ, 74, 43
- Hubble (1936) Hubble, E. P. 1936, Realm of the Nebulae (Realm of the Nebulae, by E.P. Hubble. New Haven: Yale University Press, 1936)
- Jedrzejewski (1987) Jedrzejewski, R. I. 1987, MNRAS, 226, 747
- Koleva et al. (2007) Koleva, M., Bavouzet, N., Chilingarian, I., & Prugniel, P. 2007, in Science Perspectives for 3D Spectroscopy, ed. M. Kissler-Patig, J. R. Walsh, & M. M. Roth, 153
- Koleva et al. (2008) Koleva, M., Prugniel, P., Ocvirk, P., Le Borgne, D., & Soubiran, C. 2008, MNRAS, 385, 1998
- Kormendy & Kennicutt (2004) Kormendy, J. & Kennicutt, Jr., R. C. 2004, ARA&A, 42, 603
- Kregel et al. (2005) Kregel, M., van der Kruit, P. C., & Freeman, K. C. 2005, MNRAS, 358, 503
- Kuntschner et al. (2006) Kuntschner, H., Emsellem, E., Bacon, R., et al. 2006, MNRAS, 369, 497
- Larson et al. (1980) Larson, R. B., Tinsley, B. M., & Caldwell, C. N. 1980, ApJ, 237, 692
- Le Borgne et al. (2004) Le Borgne, D., Rocca-Volmerange, B., Prugniel, P., et al. 2004, A&A, 425, 881
- Macciò et al. (2006) Macciò, A. V., Moore, B., & Stadel, J. 2006, ApJ, 636, L25
- Moiseev (2008) Moiseev, A. V. 2008, Astrophysical Bulletin, 63, 70
- Moore et al. (1996) Moore, B., Katz, N., Lake, G., Dressler, A., & Oemler, A. 1996, Nature, 379, 613
- Nilson (1973) Nilson, P. 1973, Uppsala general catalogue of galaxies (Acta Universitatis Upsaliensis. Nova Acta Regiae Societatis Scientiarum Upsaliensis - Uppsala Astronomiska Observatoriums Annaler, Uppsala: Astronomiska Observatorium, 1973)
- Pahre et al. (2004) Pahre, M. A., Ashby, M. L. N., Fazio, G. G., & Willner, S. P. 2004, ApJS, 154, 235
- Paturel et al. (2003) Paturel, G., Petit, C., Prugniel, P., et al. 2003, A&A, 412, 45
- Peletier et al. (2007) Peletier, R. F., Falcón-Barroso, J., Bacon, R., et al. 2007, MNRAS, 379, 445
- Prugniel et al. (2007) Prugniel, P., Soubiran, C., Koleva, M., & Le Borgne, D. 2007, ArXiv:astro-ph/0703658
- Quilis et al. (2000) Quilis, V., Moore, B., & Bower, R. 2000, Science, 288, 1617
- Salpeter (1955) Salpeter, E. E. 1955, ApJ, 121, 161
- Sánchez-Blázquez et al. (2006a) Sánchez-Blázquez, P., Gorgas, J., & Cardiel, N. a nd González, J. J. 2006a, A&A, 457, 809
- Sánchez-Blázquez et al. (2006b) Sánchez-Blázquez, P., Gorgas, J., & Cardiel, N. 2006b, A&A, 457, 823
- Schlegel et al. (1998) Schlegel, D. J., Finkbeiner, D. P., & Davis, M. 1998, ApJ, 500, 525
- Sersic (1968) Sersic, J. L. 1968, Atlas de galaxias australes (Cordoba, Argentina: Observatorio Astronomico, 1968)
- Sil’chenko (2006) Sil’chenko, O. 2006, ApJ, 641, 229
- Sil’chenko (2000) Sil’chenko, O. K. 2000, AJ, 120, 741
- Sil’chenko & Afanasiev (2004) Sil’chenko, O. K. & Afanasiev, V. L. 2004, AJ, 127, 2641
- Spitzer & Baade (1951) Spitzer, L. J. & Baade, W. 1951, ApJ, 113, 413
- Springob et al. (2005) Springob, C. M., Haynes, M. P., Giovanelli, R., & Kent, B. R. 2005, ApJS, 160, 149
- Strateva et al. (2001) Strateva, I., Ivezić, Ž., Knapp, G. R., et al. 2001, AJ, 122, 1861
- Tully & Fisher (1977) Tully, R. B. & Fisher, J. R. 1977, A&A, 54, 661
- van der Marel & Franx (1993) van der Marel, R. P. & Franx, M. 1993, ApJ, 407, 525
- van Dokkum (2001) van Dokkum, P. G. 2001, PASP, 113, 1420
- Worthey (1994) Worthey, G. 1994, ApJS, 95, 107
- Zasov et al. (2008) Zasov, A. V., Moiseev, A. V., Khoperskov, A. V., & Sidorova, E. A. 2008, Astronomy Reports, 52, 79