Study of the volume and spin collapse in orthoferrite LuFeO3 using LDA+U
Abstract
Rare earth (R) orthoferrites RFeO3 exhibit large volume transitions associated with a spin collapse. We present here ab initio calculations on LuFeO3. We show that taking into account the strong correlation among the Fe-3d electrons is necessary. Indeed, with the LDA+U method in the Projector Augmented Wave (PAW), we are able to describe the isostructural phase transition at 50 GPa, as well as a volume discontinuity of 6.0% at the transition and the considerable reduction of the magnetic moment on the Fe ions. We further investigate the effect of the variation of and and find a linear dependence of the transition pressure on these parameters. We give an interpretation for the non-intuitive effect of . This emphasizes the need for a correct determination of these parameters especially when the LDA+U is applied to systems (e.g in geophysical investigations) where the transition pressure is a priori unknown.
pacs:
62.50.-p,71.27.+a, 71.15.Mb,77.80.BhI Introduction
The magnetic spin collapse under pressure in transition metal oxides has attracted great interest in the past few years, not only because of the geophysical implicationsKantor et al. (2005); Speziale et al. (2005); Lin et al. (2005) and fundamental questions on the origin of the transition, but also because experiments and structural calculations have become feasible in the pressure regions where the spin transition takes place (see for example Refs. Yoo et al., 2005; Adams and Oganov, 2005; Kasinathan et al., 2006; Kunes et al., 2008). These high pressure regions could be reached because of the development of the diamond anvil cell (DAC)Fiquet (2001) on the experimental side. The development of electronic structure codes allowing for structural relaxations facilitates the computational treatment. In particular, plane wave methods combined with the Projector Augmented Wave (PAW) frameworkBlöchl (1994); Kresse and Joubert (1999); Holzwarth et al. (1997); Torrent et al. (2008) allow to treat atoms throughout regions, where the ionic radii, the ionic positions, the nominal valence as well as the crystal structure might heavily vary. However, the standard treatment using the Density Functional Theory (DFT)Hohenberg and Kohn (1964); Kohn and Sham (1965) in the local spin density approach (LSDA) is erroneously cumbered by the so-called self-interaction energy and more generally, by the wrong description of interactions of electrons inside localized orbitals (e.g ).
The limitation of DFT methods has provoked the development of new theoretical methods, such as the LDA+U and LDA+DMFT methodsAnisimov et al. (1991, 1997); Georges et al. (1996); Kotliar et al. (2006) (from a combination of the DFT in the Local Density Approximation (LDA) and a Hubbard Hamiltonian), the self-interaction corrected LSDA (SIC-LSDA),Temmerman et al. (1998) or the hybrid functional method.Heyd and Scuseria (2004)
Recently spin and volume collapse isostructural transitions under pressure have been observed in orthoferritesXu et al. (2001); Rozenberg et al. (2005) with X-ray-diffraction methods and Mössbauer spectroscopy. LuFeO3 is an ideal material to test the agreement between experimental and computational methods. The reasons for this are manifold: First, accurate experimental data exist up to pressures of 125 GPa.Rozenberg et al. (2005) Second, the transition is well defined contrary to some other orthoferrites (e.g. PrFeO3). Third, this compound has a simple magnetic structure,White (1969) because of the complete -shell of lutetium: correlation effects inside the -shell can thus be neglected and the focus can be put on the correct description of the iron atom. Fourth, the distortion of the perovskite structure in LuFeO3 is strong which clearly defines the geometrical structure of the crystal and allows to neglect thermal effects on the crystal structure (in other perovskite materialsZhong and Vanderbilt (1996) such as SrTiO3 and BaTiO3 this distortion is smaller and leads to a sequence of thermal phase transitions). This simplifies the theoretical treatment and allows straight forward comparison with experimental results. Fifth, the stoichiometry of LuFeO3 perovskite is well defined in contrast to other materials (e.g. FeO) where it is difficult to obtain pure samples.Ono et al. (2007); Kantor et al. (2004)
As a large number of transition-metal compounds are insulators, the existence of correlated metals raises many theoretical questions which have been tackled recently (see e.g. Refs. Pavarini et al., 2004, 2005; De Raychaudhury et al., 2007.) However, orthoferrites are Mott insulators with a large gapXu et al. (2001); Rozenberg et al. (2005); Singh et al. (2008) and the rare earth ions retain an important atomic behavior.
In general, the high spin (HS) to low spin (LS) transition in these systems is linked to the considerable volume collapse of the transition metal ion.Anderson (1989) It leads to the violation of atomic first Hund’s rule because of the enhanced crystal field and thus to the considerable reduction or even complete vanishing of the magnetic moment. The success of recent calculation using LDA+U and LDA+DMFT to describe volume and moment collapse in simple oxides such as MnOKasinathan et al. (2006); Kunes et al. (2008) and CoOWdowik and Legut (2008) emphasizes that this transition is clearly linked to the existence of strong interactions.
The electronic structure of LuFeO3 has been studied within the PBE formalism by Xing et al. (2007) and Iglesias et al. (2005) Though, the volume collapse transition was not studied in these works. In PBE Iglesias et al. (2005); Xing et al. (2007), the AFM magnetic structure is found correctly but no band gap Iglesias et al. (2005) is found or it is small (0.46 eVXing et al. (2007)). Indeed the R-FeO3 orthoferrites are known for their large optical gap.Xu et al. (2001); Pasternak et al. (2002) In Ref. Xing et al., 2007 atomic relaxations were applied whereas in Ref. Iglesias et al., 2005 the calculations were performed in the ideal cubic geometry, which could explain the different findings. Our work supports the notion of Ref. Iglesias et al., 2005: The combination of a standard treatment of the electronic exchange-correlation energy (LDA here, GGA in Ref. Iglesias et al., 2005) with the cubic crystal structure results in a metallic state. Recently, Singh et al. (2008) have performed calculations using the LDA+U formalism: much larger gaps are obtained. Unfortunately, the value of Coulomb interaction is not given.
In our study we thus focus on the phase transition, and use the LDA+U approximation which describes well Mott insulators such as LuFeO3. We show that the method is indeed able to describe the volume collapse associated to the spin transition upon pressure. We study how and contribute to the stabilization of the two phases.
II Methodology
In this section we gathered the description of the PAW datasets, the computational details related to LuFeO3, an analysis of the atomic occupation matrices for the HS and LS phases in the LDA+U method and a discussion of the thermodynamic potential at pressure, the enthalpy.
II.1 PAW atomic datasets
PAW atomic datasets are generated using ATOMPAW.Holzwarth et al. (2007); Tackett et al. (2001) For the LDA+U PAW calculations, semi-core states of Lu and Fe are treated in the valence. Valence states for Lu, Fe and O thus include 5s5p5d4f6s, 3s3p4s4p3d and 2s2p states, respectively.
PAW radii are 2.52 a.u., 2.01 a.u. and 1.11 a.u., respectively. These values of the radii have been chosen in order
to avoid the overlap of PAW augmentation regions at high pressure.
The Lu, Fe and O atomic data were tested for the oxygen molecule (O2, box size 10 Å, energy cutoff 16 Ha 545 eV), bcc ferromagnetic iron (k-points: , 56 points in total, energy cutoff 20 Ha 545 eV), rhombohedral iron oxide and hexagonal Lu metal (k-point: , 585 points in total, energy cutoff 20 Ha 545 eV). Equilibrium properties are compared to values in the literature in Tab. 1 which validates the PAW atomic data. In the case of lutetium metal, calculations of Ref. Pickard et al., 2000 are carried out with the ultrasoft-pseudopotential method, which could explain the discrepancy with the more precise PAW method, especially for a system which contains strongly localized electrons (mainly contained in the augmentation region).
In order to test the validity of the PAW datasets we performed LDA calculations on rhombohedral FeO. A four atomic rhombohedral (R-3m, space group 166) unit cell was chosen in order to accommodate antiferromagnetic ordering.Cococcioni and de Gironcoli (2005) We use 30 k-points for the k-point sampling and a 16 Ha plane wave energy cutoff. Thus is converged to 0.001 Å and to 7 GPa. The resulting EOS parameters of the AFM phase are given in Tab. 1.
| Molecule/crystal | quantity | Our work | Literature | error % | ||||
|---|---|---|---|---|---|---|---|---|
| O2 | d0 (Å ) | 1. | 216 | 1. | 21 | Ref. Serena et al.,1993 | 0. | 4 |
| Fe ferromagnetic | a0 (Å ) | 2. | 76 | 2. | 76 | Ref. Garcia-Suarez et al.,2004 | 0. | |
| 1. | 99 | 2. | 08 | 0. | 06 | |||
| Lu metal hcp | (Å | 52. | 24 | 53. | 373 | Ref. Pickard et al.,2000 | 2. | |
| 0. | 641 | 0. | 640 | 0. | 1 | |||
| FeO | (Å | 4. | 185 | 4. | 179 | Ref. Alfredsson et al.,2004 | 0. | 12 |
| [GPa] | 242. | 237. | 2. | |||||
II.2 Calculation setup
II.2.1 Computational scheme
Calculations are performed using the ABINIT package,Gonze et al. (2002) within the PAW Torrent et al. (2008) framework. The electron-electron interaction is treated using the LDA and the LDA+U.Anisimov et al. (1991, 1997); Liechtenstein et al. (1995); Czyżyk and Sawatzky (1994); Bengone et al. (2000); Amadon et al. (2008) The unit cell of the ideal perovskite structure is cubic and contains 5 atoms. In order to establish the GdFeO3 orthorhombic distortion observed by Rozenberg et al. (2005) a unit cell has to be considered with lattice vectors , and , where are the lattice vectors of the ideal cubic perovskite. This unit cell contains 20 atoms and allows for antiferromagnetic ordering of the Fe atoms. This unit cell was used for our unrelaxed antiferromagnetic calculations while the symmetry elements were reduced to those of space group Pbnm. For the unrelaxed structure, we found the antiferromagnetic (AFM) configuration to be lower in energy than the ferromagnetic (FM) configuration by 1.458 eV in good agreement with experiment where the AFM is found for the HS and the LS phases.Rozenberg et al. (2005) 111These calculations were performed using 4.3 eV and 0. The volume was 217.822 Å3 which corresponds to a pressure of 1.5 GPa. This AFM symmetry was therefore imposed during the calculation which on the other hand reduced the degrees of freedom. On the Lu positions we find no magnetic moment and therefore no magnetic ordering.
Convergence of LuFeO3 was reached on a Monkhorst sampling grid (36 k-points) and with an energy cutoff of 16 Ha ( eV). Energy differences of the HS and the LS phase were converged to 10 meV. The pressure is converged to 0.08 GPa and enthalpies to 50 meV. Moreover, transition pressures are converged to 0.04 GPa. The double counting energy in the fully localized limit (atomic limit)
| (1) |
was used throughout this work, where and .Liechtenstein et al. (1995); Czyżyk and Sawatzky (1994); Anisimov et al. (1993) The parameter representing the Coulomb repulsion of the Fe-3d orbitals was chosen 4.3 eV as it was determined by Cococcioni and de Gironcoli (2005) for the oxide FeO. A higher value could be used because of the more contracted orbitals in Fe3+ with respect to Fe2+.Solovyev et al. (1996) However, in other worksMosey et al. (2008) a slightly lower value was determined (3.7 eV). The values are thus difficult to compare because they depend on the orbital basis set. For the sake of simplicity and in order to compare with the Ref. Cococcioni and de Gironcoli, 2005, the exchange parameters was set to 0.Mazin and Anisimov (1997) Spin-orbit coupling is neglected in these calculations. We assume that the orbital magnetic moment – although not negligible – is mainly quenched by the crystal field.
II.2.2 Determination of the ground state
In the ionic limit, the charge of lutetium, oxygen, and iron would be 3+, 2- and 3+. This implies a formal occupancy of 5 electrons for the d-orbital sub-shell. In a cubic lattice, the ground state would thus consist of the filling of 3 and 2 orbitals (Hund’s Rule requires maximal spin polarization), while in the LS state electrons fill 5 states. In the atomic limit — corresponding to the complete filling of orbitals and without fluctuations —, and thus in LDA+U, the symmetry would therefore be broken in the LS state.Larson et al. (2007) Calculations for both phases have thus been carried out by imposing the Pbnm symmetry to the electronic states even for the undistorted structure. The experimentally observed crystal distortion appears not to be the consequence of the electron distribution in the LS phase alone, as the distortion is also present in the high spin phase. It is probably more due to the geometric redistribution of space between the ions of different radii as described in section III.3.
While for the HS configuration only one electronic arrangement is possible, the LS can be implemented in several ways because in the Pbnm symmetry the degeneracy of all d-orbitals is lifted. In order to enhance the convergence of the specific spin state the electron-electron interaction potential was fixed in the Hamiltonian according to a given occupancy matrix (see II.2)222See also Ref. Jomard et al., 2008 for a similar computational scheme for the correlated subspace during the 30 first steps of the energy minimization procedure. Then it was self-consistently optimized. We determined energies and orbital occupancies starting from one hundred different occupation matrices (for the correlated subspace) at a volume of 156.92 Å3 ( GPa). These one hundred occupations matrices correspond to the number of possibilities to have 3 spin majority and 2 spin minority states in the -shell.
The optimization of the electronic density ended in 3 possible electronic states which are all . These 3 electronic states corresponds to different possible coupling of the orbitals. We compared the energies of the 3 electronic configurations at pressures from 0 to 90 GPa and found that the enthalpies differ by a constant, which is independent of the pressure. This indicates an identical EOS for the three states in the LS spin region (see also FIG. 1). Assuming only diagonal density matrix as starting point, we find that the configuration is the most stable one.333x,y,z axis are parallel to Fe-O bonds in the cubic unit cell. It is referred to as LS in the following. The use of starting density matrix containing occupations (among the one hundred used) has enabled us to study a larger set of solution. Among them, the configuration LS’ has the lowest energy ( eV at a volume of 156.92 Å3). The configuration in the majority channel is . In the minority channel two states are occupied and characterized by non-diagonal occupation matrix elements. It gives a transition pressure which is 4 GPa lower than the one of LS. The LS and the LS’ structure converge towards a unique state upon structural relaxation. This is reflected in the energy as well as in the occupation matrix of the Fe-3d electrons. The third LS state (LS∗) lies between LS’ and LS, as far as the energy is concerned. In its minority channel, only one of the states contributes to non-diagonal matrix elements in the occupation matrix.
Atomic relaxations were performed using the Broyden-Fletcher-Goldfarb-Shanno minimization.Schlegel (1982) Enthalpies were converged to a precision of at least meV, energies to meV, forces to 0.01 Å.
II.2.3 The thermodynamic potential at pressure
| (2) |
was fitted to the energy-volume data, where is the ground state energy, the ground state volume, the bulk modulus and its first volume derivative.
In density functional theory the correct density is the one which corresponds to the lowest energy. Two different phases can correspond to local minima of the energy surface , where is the total energy and the volume.
However, the free parameter in experiment is not the volume but the pressure applied to the sample. The corresponding thermodynamic potential is the enthalpy . The enthalpy can be computed if the pressure is determined from the electronic density using the Hellman Feynman theorem as it is done in ABINIT. The pressure at which the transition occurs is given by the equality of the enthalpies. The transition pressure can be equivalently given by the well known construction of common tangents on curves.
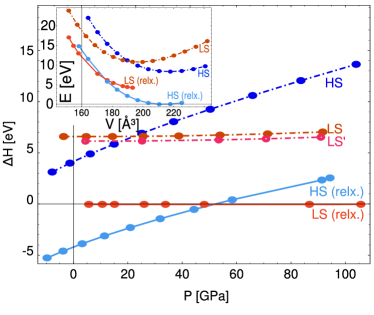
In practice, the discrete data set {} of various phases can be compared to the continuous enthalpy of an additional phase, which can be chosen to be the enthalpy of the fitted curve with the BM3 expression. The enthalpy difference (where ) allows to study the effects that lead to phase transitions and leave away features which are common to all phases considered (FIG. 1). In particular, the transition pressure is given by the intersection of two curves.
III Results
This section presents the description of the volume-collapse transition in LDA+U.
III.1 Electronic properties and densities of states
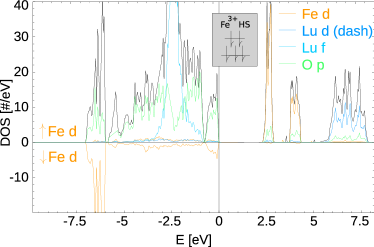
We first have performed LDA calculations for the ideal cubic configuration and have found the resulting DOS to be metallic and in particular d-states are at the Fermi level. Even starting from converged LDA+U ionic structures and the wave functions of the HS and the LS phase, respectively, the LDA fails: At small pressures (large volume) it gives a metallic DOS with a small magnetic moment of (FIG. 2). Only at an extremely large volume (highly negative pressure, FIG. 2) a gap opens (0.7 eV) and a considerable magnetic moment results (3.56 ). This electronic configuration though is not stable at smaller volume (in particular not at the volume corresponding to ambient conditions). This emphasizes the incorrect description of correlations. Indeed, rare earth orthoferrites are know to be large gap insulators.Xu et al. (2001); Pasternak et al. (2002); Singh et al. (2008) It is not possible to stabilize two different phases at positive pressure within the LDA.
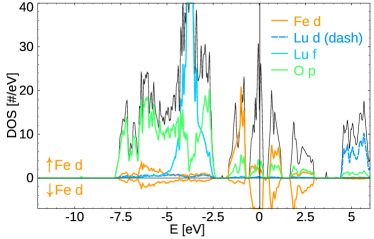
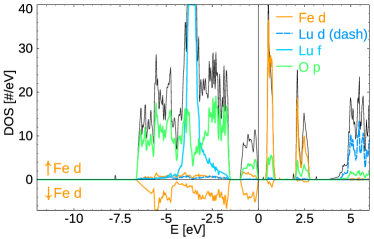
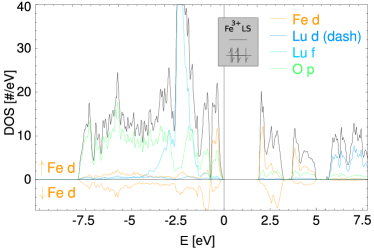
As described above (section II.2) and emphasized before (e.g Ref. Kasinathan et al., 2006), the LDA+U method, which takes into account the strong correlations in the atomic limit, is able to describe these two phases. The density of states (DOS) of the HS and LS phase – at a volume belonging to their individual stability range – are shown on FIG. 3 and 3. The main effect of LDA+U is to stabilize the HS phase at positive pressures and to increase the gap inside the d-orbitals. In the LS and the HS phases, the Fe-3d orbitals in the valence band are strongly hybridized with the oxygen p orbitals. The Lu-f retain their atomic-like character while the Lu-d – though unoccupied – hybridize with O-p orbitals. The DOS scarcely changes with pressure, even at low pressures (0 GPa) where the LS phase is unstable. The HS phase (FIG. 3) is characterized by atomic-like peaks for all elements, especially Lu and Fe.
At 0 GPa ( eV and , no relaxation) the HS phase is insulating with a gap of 1.75 eV, and the LS with a gap of 1.16 eV. At 50 GPa the gaps are 1.10 eV and 0.93 eV, respectively. In fact, the gap size shows a perfect linear behavior in the range between 0 and 200 GPa. Relaxation increases the band gap at 0 GPa to 2.17 eV (HS) and 2.03 eV (LS). In Ref. Singh et al., 2008, the value of the gap of the HS phase obtained in LDA+U is eV. The comparison with our results remains difficult because the parameters and were not given there.
One of the major impacts of the parameters and is their influence on the gap size. While always increases the gap, decreases it. The effect on the HS phase is half as strong as on the LS, where the gap increases by 0.45 eV when increases by 1 eV and decreases by 0.85 eV when increases by 1 eV.
The local spin moment on the Fe atoms is found to be 4.05 in the HS and 0.99 in the LS structure at 0 GPa, which decreases to 3.83 and 0.91 at 100 GPa, respectively (100 GPa corresponds to 164.79 Å in the HS and 155.00 Å in the LS phase).
The discrepancy between the ionic ideal value of the spin moment and the actual value can be explained as follows: The hybridization of Fe-d electrons with oxygen-p electrons generates small occupancies on orbitals which are empty in the ionic picture. orbitals are more hybridized with oxygen-p states: they are thus more filled. In the HS phase, 2 of the hybridized contribute to the minority spin and thus to the considerable reduction of the magnetic moment with respect to the ionic value (i.e. 5 ). In the LS phase, the hybridized orbitals appear in both spin channels and cancel each other. Only an almost empty orbital reduces the local magnetic moment, which therefore remains close to the ionic value.
As will be detailed in the next section, at ambient pressure we describe an insulator-insulator transition for LuFeO3. Recent LDA+U calculations on MnO give a similar conclusions, although the LS state obtained in this work seems to be less intuitive.Kasinathan et al. (2006) However we emphasize here the limitation of our work which does not contains fluctuations. These fluctuations could easily make the system metallic as has been shown recently in MnO.Kunes et al. (2008) Moreover, recent experimental works on NdFeO3Gavriliuk et al. (2003) and BiFeO3Gavriliuk et al. (2007, 2008) show that the transition is closer to an insulator-semiconductor or an insulator-metal transitions. Further optical experiment or LDA+DMFT calculations on LuFeO3 could clarify this issue.
III.2 The equation of state and the transition pressure
As emphasized before, the LDA is not able to describe the occurrence of two phases. Nevertheless, a continuous and linear decrease of the local magnetic moment from 1.05 to 0.55 is observed between 0 and 100 GPa (relaxed structure).
LDA+U calculations for the two phases were first performed with the frozen ideal cubic configuration on the 20 atoms super-cell. The symmetry was reduced to the 8 elements of the corresponding Pbnm space group in order to allow lifting of the degeneracy of the Fe-d states. The energy and enthalpy versus volume curves are reproduced on Fig 1. One can see a phase transition between the LS and the HS phases. It occurs at 22 GPa.
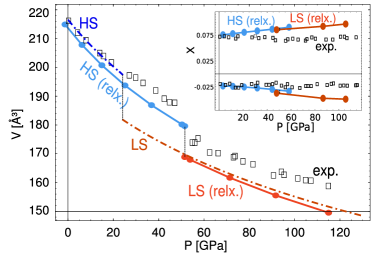
This pressure shifts to 51 GPa after structural relaxations, which compares well with the experimentally observed transition pressure of 50 GPa (FIG. 1).Rozenberg et al. (2005) Note, that the HS-LS transition was not found in earlier works and the Fe magnetic moment was underestimated (3.6 )Xing et al. (2007). The calculated collapse of the ground state volume at the transition amounts to 6.0%, compared to the measured 5.5%. Whereas in LDA the volume at zero pressure is underestimated by 12%, the introduction of interactions localizes the electrons, and thus raises the volume: the volumes at zero pressure are then well reproduced (within 2.5%, see Tab. 2) for both the HS and LS phases. Bulk moduli are in the range of experiment but with an error of about 20%. As a consequence, the difference between theoretical volume and experimental one increases to 6% at 150 GPa (see Fig 4). Besides, the discontinuity of the bulk modulus at the transition is qualitatively described (Tab. 2): 31 GPa (this work) compared to 72 GPa in experimentRozenberg et al. (2005) (see also FIG. 4).
Positional parameters are in good agreement with the experimental findings, moreover, we find no significant discontinuity of the positional parameters at the transition pressure as observed experimentally (FIG. 4 inset).
We investigated the effects of the Hubbard part of the Hamiltonian on the transition pressure. We therefore computed energies (non-self-consistently) in the LDA frame from the densities obtained in LDA+U () and observed that the HS-LS transition is maintained but shifted to much lower pressures. This shows that the LDA+U potential creates two different electronic densities which give different LDA energies. The term in the energy additionally determines the difference of energy between the two configurations, LS and HS (see also the discussion in section III.4).
Finally, we mention that we have neglected the entropic contribution in these calculations. In the iso-structural transition in cerium, the entropy appears to be essential to describe the transition.Amadon et al. (2006) In LuFeO3 we could expect the variation of entropy to be rather weak also because of the broken symmetry of states. However, we could miss fluctuations between configurations in the LS case. Furthermore, theoretical studies beyond LDA+U (e.g LDA+DMFT) as well as experimental studies of the transition as a function of temperature could help to understand these issues.
| [Å3] | [GPa] | Gap [eV] | |||
|---|---|---|---|---|---|
| LDA | 195.06 | 4.19 | 236 | 0 | |
| LDA+U | HS | 213.59 | 3.80 | 214 | 2.17 |
| LDA+U | LS | 197.41 | 3.77 | 245 | 2.03 |
| Exp.Rozenberg et al. (2005) | HS | 218.40 | 241 | ||
| Exp.Rozenberg et al. (2005) | LS | 199.40 | 313 |
III.3 The ground state structure
Perovskites (ABX3) are known to consist of mostly rigid BX6 octahedra,
while the A cations are placed in the interstitial space between the octahedra. Tilting of the mostly rigid octahedra allows to decrease space assigned to the A cations and the unit cell volume. The tilting angle is sensitive to the ratio of the B-X bonding length and the ionic radius of A.Woodward (1997a); Lufaso and Woodward (2001) According to Glazer (1972) and Woodward (1997b) perovskites can be classified according to three tilting angles and the phase (+/-) of successive octahedra along the tilting axis (see Ref. Glazer, 1972 p. 3386 for a sketch of the tilting system and Ref. Woodward, 1997b p. 34 and p. 36 for further details on this concept). LuFeO3 belongs to the space group Pbnm and the tilting system is . We find tilting angles of ° in the HS phase at 3 GPa and ° and ° in the LS phase at 87 GPa. The tilting angles are only approximate, because a symmetry conserving distortion is superimposed to the tilting of the octahedra and in the distorted octahedra the determination of the tilting angle is not unique. While in the HS phase the octahedra are elongated by 1% in the LS phase they are squeezed by 3%. The relaxed atomic positions of the HS and the LS phase can be found in Tab. 3. The more important distortion of the octahedra in the LS spin phase could be attributed to the existence of a Jahn Teller effect in this phase.
| Atom | Wyckof position | x | y | z |
|---|---|---|---|---|
| HS at 0 GPa, this work | ||||
| Lu | 4c | 0.0233 | 0. | 0.0758 |
| Fe | 4a | 0. | 0. | 0. |
| O 1 | 4c | 0.3783 | 1/2 | 0.0439 |
| O 2 | 8d | 0.8126 | 0.3112 | 0.1930 |
| HS experimental, Ref. Marezio et al.,1970 | ||||
| Lu | 4c | 0.01997 | 0. | 0.07149 |
| Fe | 4a | 0. | 0. | 0. |
| O 1 | 4c | 0.38010 | 1/2 | 0.04610 |
| O 2 | 8d | 0.81070 | 0.31210 | 0.19290 |
| LS at 50 GPa, this work | ||||
| Lu | 4c | 0.0371 | 0. | 0.0854 |
| Fe | 4a | 0. | 0. | 0. |
| O 1 | 4c | 0.3941 | 1/2 | 0.0300 |
| O 2 | 8d | 0.8267 | 0.2987 | 0.1917 |
III.4 Dependence of the transition pressure upon and
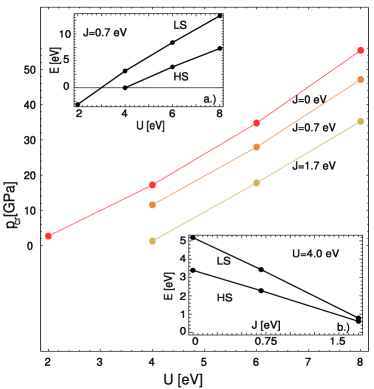
A number of calculations were performed with varying Hubbard parameter and exchange parameter . The aim was to determine the dependence and the sensitivity of the transition pressure on these parameters. We chose the parameters in the reasonable range of [in eV] 2, 4, 6, 8 and 0, 0.7, 1.7. The transition pressures were calculated using the frozen ionic configuration in the cubic structure: we were only interested in qualitative trends. The results are visualized in FIG. 5. The transition pressure in the region explored can be recast as
| (3) |
with GPa, GPa/eV and GPa/eV. This expression was obtained from a least squares fit to the calculated transition pressures and its reliability is GPa in the range studied. The resulting coefficients and are comparable with opposite sign, which emphasizes that the main parameter of the calculation is the difference . It shows that the formulation of Dudarev et al. (1998) is a good approximation in the present case. In these unrelaxed calculations the increase of from 4 eV to 8 eV raises the amount of the volume collapse insignificantly from 7.53% to 7.61%.
The positive dependence of on can be explained as following: Consider the simplified atomic Hamiltonian
| (4) |
where the density matrix is diagonal () and is chosen in the atomic limit (Eq. 1). can be recast as . As emphasized before,Solovyev et al. (1994); Cococcioni and de Gironcoli (2005) this quantity cancels when occupation numbers are integers and is positive elsewhere (see FIG.1 of Ref. Solovyev et al., 1994). At this point, we emphasize that the effect of is thus not obvious: An increase of stabilizes the high spin state both in and in , so that a clear effect on cannot be simply anticipated as emphasized before for MnO.Kasinathan et al. (2007)
When going from HS to the LS hybridization effects are enhanced. This is partly due to the decrease of the volume but also due to the different spin configurations of the HS and the LS phases as they were presented in section III.1 where the reduction of the magnetic moment of the HS phase was discussed. As a consequence, d-orbitals are increasingly hybridized with p-orbitals. It implies that Bloch states have a mixed O -Fe character: The states which should be empty in the pure ionic picture (see insets in 3 and 3) are more filled in the LS phase than in the HS spin phase (the occupancy is still lower than 0.5). As a consequence: (see FIG. 1 of Ref. Solovyev et al., 1994). Thus, if is increased or is decreased, the LS phase is destabilized with respect to the HS, and thus the transition pressure increases. This is what is observed in FIG. 5. This effect shows that and cannot be taken as parameters in the calculation, because the double counting expression – though approximate – should correct the LDA energy. This emphasizes the need for a correct determination of and . Additionally the effect of is slightly more important than the effect of . This is due to the difference between expression 4 for and the rotationally invariant expression that we use.444This difference is called in Refs. Kasinathan et al., 2007; Ylvisaker et al., 2009
The increase of induces a charge redistribution, which further lowers the relative energy of the LS phase (see also FIG. 5 insets), i.e. when increases in the LS phase, electrons are transferred from the fully occupied states to the weakly occupied states. This transfer can be taken into account in the calculation of the LDA+U contribution in Eq. 4. We calculate this contribution for a fixed occupation at different values of and compare it with the energy shift for different values of and relaxed atomic occupancies. We find that in the second case the energy change with is three times bigger than in the first case. On the other hand, the energy change due to electron redistribution is negligible in the case of the increase of . The total number of localized electrons varies when and vary. This effect is an order of magnitude smaller than the two other contributions (i.e. 1st the change of througth an increase of with fixed occupancies and 2nd the change of through a charge redistribution with a fixed total number of electrons).
As mentioned before, the bulk modulus is underestimated by about 20%, which increases the deviation in volume from 2.5% to 6%, when pressure increases from 0 to 150 GPa (see FIG. 4). Our analysis of shows a negative correlation between and (with a slope of -30 GPa/eV), indicating that the value of was slightly overestimated in our structural calculations. In LuFeO3 the electron-electron interaction is more efficiently screened than in FeO, where the interaction parameter was originally derived.Cococcioni and de Gironcoli (2005)
It is possible, that metallization is the origin of the hardening of the material at high pressure. As was observed for MnOKunes et al. (2008) and BiFeO3,Gavriliuk et al. (2008) the HS-LS transition can be accompanied by a insulator-metal transition.Gavriliuk et al. (2008) The experimental observation could be better described by DMFT calculations.Kunes et al. (2008) The increased bonding due to metallicity could make the material somewhat harder.
IV Conclusions
We have carried out LDA+U calculation within the PAW framework on the rare earth perovskite LuFeO3. We describe an iso-structural phase transition from a high spin phase towards a low spin phase with a volume collapse of 6.0% (Exp: 5.5%). Atomic positions, magnetic moments and lattice constants are computed and are in good agreement with experimental data.Rozenberg et al. (2005) At high pressure, the disagreement on volume is at most 6%. The observed reduction of the local magnetic moment on iron is .
We find, that the LDAIglesias et al. (2005); Xing et al. (2007) is not apt to treat LuFeO3. The LDA+U calculations presented here are always superior because the band gap, the phase transition pressure and the local magnetic moments could be determined more correctly.
As the computation of is not the goal of this work, we check the effect of and on the transition. We compare the filling of orbitals in the HS and LS phases and propose an interpretation for the non intuitive effect of . The determination of the parameter of the Coulombic on-site repulsion and the exchange energy appears to be essential, because the critical pressure for the spin collapse depends linearly on them. They enter the expression for the critical pressure with opposite signs but the same magnitudes [Eq. 3] as shown using the simplified LDA+U formalism of Dudarev et al. (1998)
These calculations open the way to other complex systems such as orthoferrites where correlation effects are important both on iron and on the rare earth atom. Concerning LuFeO3, some improvement of the understanding of the transition could also be brought by experimental studies of the transition as a function of temperature. Experiments on optical properties as a function of pressure as well as LDA+DMFT calculations could further clarify the nature of the transition.
V Acknowledgements
We thank M. Torrent for the iron PAW dataset and for useful discussions. We are indebted to F. Jollet, S. Mazevet, and B. Siberchicot for useful discussions and remarks. This work was supported by the French ANR under project CORRELMAT and computations were performed at CCRT Bruyères-le-Chatel.
References
- Kantor et al. (2005) A. Kantor, L. S. Dubrovinsky, N. A. Dubrovinskaia, I. Kantor, and I. N. Goncharenko, J. Alloys Compounds 402, 42 (2005), URL http://www.sciencedirect.com/science/article/B6TWY-4GGXX9C-H/%%****␣manuscript_v12.bbl␣Line␣25␣****2/1cb85499f03aa828d9a594fed321deb6.
- Speziale et al. (2005) S. Speziale, A. Milner, V. E. Lee, S. M. Clark, M. P. Pasternak, and R. Jeanloz, Proc. Natl. Acad. Sci. 102, 17918 (2005), URL http://www.pnas.org/cgi/content/abstract/102/50/17918.
- Lin et al. (2005) J.-F. Lin, V. V. Struzhkin, S. D. Jacobsen, M. Y. Hu, P. Chow, J. Kung, H. Liu, H. kwang Mao, and R. J. Hemley, Nature 436, 377 (2005), URL http://dx.doi.org/10.1038/nature03825.
- Yoo et al. (2005) C.-S. Yoo, B. Maddox, J.-H. P. Klepeis, V. Iota, W. Evans, A. McMahan, M. Y. Hu, P. Chow, M. Somayazulu, D. Hausermann, et al., Phys. Rev. Lett. 94, 115502 (2005).
- Adams and Oganov (2005) D. J. Adams and A. R. Oganov, Theory of minerals at extreme conditions: Predictability of structures and properties (Eötvös University Press, Budapest, 2005), vol. 7 of EMU notes in Mineralogy, chap. 18, pp. 441–454.
- Kasinathan et al. (2006) D. Kasinathan, J. Kuneš, K. Koepernik, C. V. Diaconu, R. L. Martin, I. D. Prodan, G. E. Scuseria, N. Spaldin, L. Petit, T. C. Schulthess, et al., Phys. Rev. B 74, 195110 (pages 12) (2006), URL http://link.aps.org/abstract/PRB/v74/e195110.
- Kunes et al. (2008) J. Kunes, A. V. Lukoyanov, V. I. Anisimov, R. T. Scalettar, and W. E. Pickett, Nature Materials 7, 198 (2008).
- Fiquet (2001) G. Fiquet, Z. Kristallogr. 216, 248 (2001).
- Blöchl (1994) P. E. Blöchl, Phys. Rev. B 50, 17953 (1994).
- Kresse and Joubert (1999) G. Kresse and D. Joubert, Phys. Rev. B 59, 1758 (1999).
- Holzwarth et al. (1997) N. A. W. Holzwarth, G. E. Matthews, R. B. Dunning, A. R. Tackett, and Y. Zeng, Phys. Rev. B 55, 2005 (1997).
- Torrent et al. (2008) M. Torrent, F. Jollet, F. Bottin, G. Zérah, and X. Gonze, Comput. Mat. Sci. 42, 337 (2008).
- Hohenberg and Kohn (1964) P. Hohenberg and W. Kohn, Phys. Rev. 136, B864 (1964).
- Kohn and Sham (1965) W. Kohn and L. J. Sham, Phys. Rev. 140, A1133 (1965).
- Anisimov et al. (1991) V. I. Anisimov, J. Zaanen, and O. K. Andersen, Phys. Rev. B 44, 943 (1991).
- Anisimov et al. (1997) V. I. Anisimov, F. Aryasetiawan, and A. I. Liechtenstein, J. Phys. Cond. Matt. 9, 767 (1997).
- Georges et al. (1996) A. Georges, G. Kotliar, W. Krauth, and M. J. Rozenberg, Rev. Modern Phys. 68, 13 (1996).
- Kotliar et al. (2006) G. Kotliar, S. Y. Savrasov, K. Haule, V. S. Oudovenko, O. Parcollet, and C. A. Marianetti, Rev. Modern Phys. 78, 865 (2006).
- Temmerman et al. (1998) W. M. Temmerman, A. Svane, Z. Szotek, , and H. Winter, in Electronic Density Functional Theory: Recent Progress and New Directions, edited by J. F. Dobson, G. Vignale, and M. P. Das (Plenum, New York, 1998), pp. 327–347.
- Heyd and Scuseria (2004) J. Heyd and G. E. Scuseria, J. Chem. Phys. 121, 1187 (2004), URL http://link.aip.org/link/?JCP/121/1187/1.
- Xu et al. (2001) W. M. Xu, O. Naaman, G. K. Rozenberg, M. P. Pasternak, and R. D. Taylor, Phys. Rev. B 64, 094411 (2001).
- Rozenberg et al. (2005) G. K. Rozenberg, M. P. Pasternak, W. M. Xu, L. S. Dubrovinsky, S. Carlson, and R. D. Taylor, EPL (Europhys. Lett.) 71, 228 (2005), URL http://stacks.iop.org/0295-5075/71/228.
- White (1969) R. L. White, J. App. Phys. 40, 1061 (1969).
- Zhong and Vanderbilt (1996) W. Zhong and D. Vanderbilt, Phys. Rev. B 53, 5047 (1996).
- Ono et al. (2007) S. Ono, Y. Ohishi, and T. Kikegawa, J. Phys. Cond. Matt. 19, 036205 (2007), URL http://stacks.iop.org/0953-8984/19/i=3/a=036205.
- Kantor et al. (2004) I. Y. Kantor, C. A. McCammon, and L. S. Dubrovinsky, J. Alloys Compounds 376, 5 (2004), URL http://www.sciencedirect.com/science/article/B6TWY-4BT7JMD-1/%2/3e16ce464f9276ec6d8d8e575abea726.
- Pavarini et al. (2004) E. Pavarini, S. Biermann, A. Poteryaev, A. I. Lichtenstein, A. Georges, and O. K. Andersen, Phys. Rev. Lett. 92, 176403 (2004).
- Pavarini et al. (2005) E. Pavarini, A. Yamasaki, J. Nuss, and O. K. Andersen, New J. Phys. 7, 188 (2005), ISSN 1367-2630.
- De Raychaudhury et al. (2007) M. De Raychaudhury, E. Pavarini, and O. K. Andersen, Phys. Rev. Lett. 99, 126402 (pages 4) (2007), URL http://link.aps.org/abstract/PRL/v99/e126402.
- Singh et al. (2008) N. Singh, J. Y. Rhee, and S. Auluck, J. Korean Phys. Soc. 53, 806 (2008).
- Anderson (1989) D. L. Anderson, Theory of the Earth (Blackwell Scientific Publications, Oxford, 1989).
- Wdowik and Legut (2008) U. D. Wdowik and D. Legut, J. Phys. Chem. Solids 69, 1698 (2008).
- Xing et al. (2007) B.-L. Xing, L. Wu, G.-P. Qin, Y. Li, Y.-F. Zhang, and J.-Q. Li, Acta Chim. Sinica 65, 1773 (2007), ISSN 0567-7351.
- Iglesias et al. (2005) M. Iglesias, A. Rodriguez, P. Blaha, V. Pardo, D. Baldomir, M. Pereiro, J. Botana, J. Arias, and K. Schwarz, J. Magnetism Magnetic Materials 290, 396 (2005), ISSN 0304-8853.
- Pasternak et al. (2002) M. P. Pasternak, W. M. Xu, G. K. Rozenberg, and R. D. Taylor, in Perovskite Materials, edited by R. M. Wentzcovitch, A. Navrotsky, and K. Poeppelmeier (Materials Research Society, Warrendale, 2002), MRS Proceedings Volume 718.
- Holzwarth et al. (2007) N. A. W. Holzwarth, M. Torrent, and F. Jollet, http://pwpaw.wfu.edu/ (2007).
- Tackett et al. (2001) A. R. Tackett, N. A. W. Holzwarth, and G. E. Matthews, Comput. Phys. Comm. 135, 329 (2001).
- Pickard et al. (2000) C. J. Pickard, B. Winkler, R. K. Chen, M. C. Payne, M. H. Lee, J. S. Lin, J. A. White, V. Milman, and D. Vanderbilt, Phys. Rev. Lett. 85, 5122 (2000).
- Cococcioni and de Gironcoli (2005) M. Cococcioni and S. de Gironcoli, Phys. Rev. B 71, 035105 (pages 16) (2005), URL http://link.aps.org/abstract/PRB/v71/e035105.
- Serena et al. (1993) P. A. Serena, A. Baratoff, and J. M. Soler, Phys. Rev. B 48, 2046 (1993).
- Garcia-Suarez et al. (2004) V. Garcia-Suarez, C. Newman, C. Lambert, J. Pruneda, and J. Ferrer, Europ. Phys. J. B 40, 371 (2004), ISSN 1434-6028.
- Alfredsson et al. (2004) M. Alfredsson, D. G. Price, C. R. A. Catlow, S. C. Parker, R. Orlando, and J. P. Brodholt, Phys. Rev. B 70, 165111 (2004).
- Gonze et al. (2002) X. Gonze, J.-M. Beuken, R. Caracas, F. Detraux, M. Fuchs, G.-M. Rignanese, L. Sindic, M. Verstraete, G. Zerah, F. Jollet, et al., Comput. Mat. Sci. 25 (2002).
- Liechtenstein et al. (1995) A. I. Liechtenstein, V. I. Anisimov, and J. Zaanen, Phys. Rev. B 52, R5467 (1995).
- Czyżyk and Sawatzky (1994) M. T. Czyżyk and G. A. Sawatzky, Phys. Rev. B 49, 14211 (1994).
- Bengone et al. (2000) O. Bengone, M. Alouani, P. E. Blöchl, and J. Hugel, Phys. Rev. B 62, 16392 (2000).
- Amadon et al. (2008) B. Amadon, F. Jollet, and M. Torrent, Phys. Rev. B 77, 155104 (2008).
- Anisimov et al. (1993) V. I. Anisimov, I. V. Solovyev, M. A. Korotin, M. T. Czyżyk, and G. A. Sawatzky, Phys. Rev. B 48, 16929 (1993).
- Solovyev et al. (1996) I. Solovyev, N. Hamada, and K. Terakura, Phys. Rev. B 53, 7158 (1996).
- Mosey et al. (2008) N. J. Mosey, P. Liao, and E. A. Carter, J. Chem. Phys. 129, 014103 (pages 13) (2008), URL http://link.aip.org/link/?JCP/129/014103/1.
- Mazin and Anisimov (1997) I. I. Mazin and V. I. Anisimov, Phys. Rev. B 55, 12822 (1997).
- Larson et al. (2007) P. Larson, W. R. L. Lambrecht, A. Chantis, and M. van Schilfgaarde, Phys. Rev. B 75, 045114 (pages 14) (2007), URL http://link.aps.org/abstract/PRB/v75/e045114.
- Schlegel (1982) H. B. Schlegel, J. Comp. Chem. 3, 214 (1982), URL http://dx.doi.org/10.1002/jcc.540030212.
- Poirier (2000) J.-P. Poirier, Introduction to the Physics of the Earth’s Interior (Cambridge University Press, Cambridge, UK, 2000).
- Birch (1947) F. Birch, Phys. Rev. 71, 809 (1947).
- Gavriliuk et al. (2003) A. G. Gavriliuk, I. Troyan, R. Boehler, M. Eremets, I. Lyubutin, and N. Serebryanaya, JETP Lett. 77, 619 (2003).
- Gavriliuk et al. (2007) A. G. Gavriliuk, I. Lyubutin, and V. Struzhkin, JETP Lett. 86, 532 (2007).
- Gavriliuk et al. (2008) A. G. Gavriliuk, V. V. Struzhkin, I. S. Lyubutin, S. G. Ovchinnikov, M. Y. Hu, and P. Chow, Phys. Rev. B 77 (2008).
- Amadon et al. (2006) B. Amadon, S. Biermann, A. Georges, and F. Aryasetiawan, Phys. Rev. Lett. 96, 066402 (2006).
- Woodward (1997a) P. M. Woodward, Acta Cryst. B 53, 44 (1997a).
- Lufaso and Woodward (2001) M. W. Lufaso and P. M. Woodward, Acta Cryst. B 57, 725 (2001).
- Glazer (1972) A. Glazer, Acta Cryst. B 28, 3384 (1972).
- Woodward (1997b) P. M. Woodward, Acta Cryst. B 53, 32 (1997b).
- Marezio et al. (1970) M. Marezio, J. P. Remeika, and P. D. Dernier, Acta Crys. B 26, 2008 (1970), URL http://dx.doi.org/10.1107/S0567740870005319.
- Dudarev et al. (1998) S. L. Dudarev, G. A. Botton, S. Y. Savrasov, C. J. Humphreys, and A. P. Sutton, Phys. Rev. B 57, 1505 (1998).
- Solovyev et al. (1994) I. V. Solovyev, P. H. Dederichs, and V. I. Anisimov, Phys. Rev. B 50, 16861 (1994).
- Kasinathan et al. (2007) D. Kasinathan, K. Koepernik, and W. E. Pickett, New J. Phys. 9 (2007).
- Jomard et al. (2008) G. Jomard, B. Amadon, F. Bottin, and M. Torrent, Phys. Rev. B 78 (2008).
- Ylvisaker et al. (2009) E. R. Ylvisaker, W. E. Pickett, and K. Koepernik, Phy. Rev. B. 79, 035103 (pages 12) (2009), URL http://link.aps.org/abstract/PRB/v79/e035103.