The White Dwarf in EM Cygni: Beyond The Veil 11affiliation: Based on observations made with the NASA-CNES-CSA Far Ultraviolet Spectroscopic Explorer. FUSE is operated for NASA by the Johns Hopkins University under NASA contract NAS5-32985
Abstract
We present a spectral analysis of the Far Ultraviolet Spectroscopic Explorer (FUSE) spectra of the eclipsing double-line spectroscopic binary EM Cygni, a Z Cam DN system. The FUSE spectrum, obtained in quiescence, consists of 4 individual exposures (orbits): two exposures, at orbital phases and , have a lower flux; and two exposures, at orbital phases and , have a relatively higher flux. The change of flux level as a function of the orbital phase is consistent with the stream material (flowing over and below the disk from the hot spot region to smaller radii) partially masking the white dwarf. We carry out a spectral analysis of the FUSE data, obtained at phase 0.45 (when the flux is maximal), using synthetic spectra generated with the codes TLUSTY and SYNSPEC. Using a single white dwarf spectral component, we obtain a white dwarf temperature of K, rotating at km/s. The white dwarf, or conceivably, the material overflowing the disk rim, shows suprasolar abundances of silicon, sulphur and possibly nitrogen. Using a white dwarf+disk composite model, we obtain that the white dwarf temperature could be even as high as 50,000K, contributing more than 90% of the FUV flux, and the disk contributing less than 10% must have a mass accretion rate reaching /yr. The single white dwarf model fits the absorption lines better than the white dwarf+disk model, but the white dwarf+disk model fits better the continuum in the shorter wavelengths. In both cases, however, we obtain that the white dwarf temperature is much higher than previously estimated. We emphasize the importance of modeling the spectra of EM Cyg around phase , when the white dwarf and disk are facing the observer, and we suggest that the discrepancy between the present analysis and previous spectral analysis might be due to the occulting effect of the stream veiling the white dwarf and disk.
1 Introduction
1.1 Dwarf Novae
Dwarf Novae (DNe) are a class of non-magnetic cataclysmic variables (CVs) in which a white dwarf (WD) accretes matter from a main-sequence star (the secondary) filling its Roche lobe by means of an accretion disk. DN systems are characterized mainly by their brightness variations, due to a periodic change in the accretion rate. Ongoing accretion at a low rate (quiescence) is interrupted every few weeks to months by intense accretion (outburst) of days to weeks which increases the luminosity of the system (Hack & La Dous, 1993; Warner, 1995). This outburst is believed to be due to an instability in the disk (the disk instability model - DIM (Cannizzo, 1998)), and it is known as a dwarf nova accretion event (or dwarf nova outburst).
Due to their long term accretion, the WDs in DNe have temperatures K (higher than field WDs), and therefore peak in the far-ultraviolet (FUV). The long periods of quiescence allow for long exposure observations (hrs) covering all the orbital phases (this is especially important for systems with a high inclination, as the WD can be eclipsed or masked at given orbital phases). Because of that, DNe, unlike other CVs, are ideal candidates to study the accreting WD, as during quiescence the WD is exposed in the FUV for long periods of time. FUV spectroscopic observations are used to determine the WD parameters such as temperature, gravity, rotational velocity and chemical abundances. The disk mass accretion rate of many systems can also be deduced accurately at given epochs of outburst or near outburst using spectral fitting techniques. In addition, DNe offer a fairly reliable estimate of their distances via the absolute magnitude at maximum versus orbital period relation (Warner, 1995; Harrison et al., 2004). As a consequence, DNe are ideal candidates to observe, as one can more easily derive their system parameters, which in turn can be used to test the theories of CV evolution.
Dwarf nova systems are further divided into sub-types: U Gem systems, SU UMa systems, and Z Cam systems. The U Gem systems are the typical DNe, i.e. with normal DN outbursts; the SU UMas exhibit both normal DN outbursts, and superoutbursts, which are both longer in duration and higher in luminosity than normal DN outbursts; and the Z Cam systems have standstills where they remain in a semi-outburst state for a long time (Ritter & Kolb, 2003). The binary orbital period in CV systems ranges from a fraction of an hour to about a day; however, there is a gap in the orbital period between 2 and 3 hours where almost no CV systems are found: the period gap. U Gem and Z Cam DN systems are found above the period gap, while the SU UMa DN systems are found below the period gap.
In this paper we present the FUV spectral analysis of the eclipsing Z Cam system EM Cygni observed during quiescence with FUSE.
1.2 EM Cygni System Parameters
First suspected to be related to CVs by Burbidge & Burbidge (1953), EM Cyg is a bright, double-lined spectroscopic binary variable (Kraft, 1964). Its eclipses were discovered by Mumford & Krezminski (1969) and the orbital period was found to be almost 7h (0.29090912 day). Its period was expected to decrease (by days/cycle; Pringle (1975); Mumford (1980)), however it has been found to be constant (Beuermann & Pakull, 1984; Csizmadia et al., 2008) with an upper limit /days. Its outburst cycle is of the order of 25 days and rapid coherent oscillations are detected during the late stages of outbursts with periods of the order of 14.6-16.5 seconds (see Stiening et al. (1982) and references therein).
EM Cyg is so far the only known Z Cam subtype eclipsing DN system. The eclipses are important as they allow, in theory at least, for a detailed study of the system. In addition, because EM Cyg is an eclipsing system as well as a double-lined spectroscopic binary, it has been extensively studied (e.g. Robinson (1974); Nevo & Sadeh (1978); Bailey (1981); Jameson et al. (1981); Patterson (1981); Stover et al. (1981); Szkody (1981); see also Stiening et al. (1982)). However, the determination of the stellar masses of the system by Robinson (1974) and Stover et al. (1981) was effected by the presence of a third star, Arkadash 111 The third star was named Arkadaş (“friend” in Turkish) by Welsh et al. (2005), in memory of Janet (Hannula) Akyüz Mattei (1943-2004). Janet Mattei determined an outburst cycle of 25 days for EM Cyg, and provided AAVSO data and information on the state of EM Cyg many times (e.g. Stover et al. (1981); Stiening et al. (1982); North et al. (2000)), as she did for many variable stars on countless occasions. , along the line of sight (North et al., 2000). This third star is not related to the system. The most recent study (Welsh et al., 2007) indicates a mass ratio and a WD mass . The distance found by Bailey (1981); Jameson et al. (1981), 320-350pc, could also be affected by the contribution of Arkadash in the red light, and Welsh et al. (2005) pointed out that could be as large as 450-500pc. However, using the maximum magnitude at outburst versus orbital period relation (Warner, 1995; Harrison et al., 2004), one finds a distance of pc (Winter & Sion, 2003).
A recent broad-band photometric study of the system (Spogli et al., 2003, 2005) shows the magnitude of EM Cyg varies between V=13.3 at minimum and V=12.5 at maximum, it reaches V=14.4 during the eclipse, and V=12.9 in standstill (note, however, that data from the AAVSO indicates it can reach V12.0). EM Cyg is located at a very low Galactic latitude (), where the Galactic reddening reaches almost 0.5. However, the reddening towards EM Cyg is only (Verbunt, 1987; La Dous, 1991; Bruch & Engel, 1994). The system has an inclination of only deg (North et al., 2000), however, because of its large disk and secondary star, the disk is partially eclipsed, while the WD itself is not eclipsed. The geometrical configuration of the disk, WD and secondary of the system is shown in Figure 1 at phase . All the system parameters are recapitulated in Table 1.
1.3 Previous Spectral Analysis of EM Cyg
EM Cyg was observed in quiescence with FUSE by Welsh et al. (2005), who carried out a spectral fit after combining the FUSE spectrum with an IUE spectrum. Their spectral fit consists of a disk with /yr and a WD with K, assuming a distance of 350pc. The model did not fit the flux in the short wavelengths of FUSE which is indicative of a much higher temperature. However at K the model spectrum became too blue and the fit was noticeably worse in the IUE range.
Winter & Sion (2003) carried out a spectral fit to the IUE spectrum SWP 08088 of EM Cyg taken in quiescence (with a flux of ergs cm-2Å-1) and obtained that the best fit is a disk with /yr and a WD of with K (contributing only 8% of the flux) with a distance of 210pc and . Later on, Urban & Sion (2006) analyzed the same IUE spectrum and obtained the same results except a distance of 350pc, when dereddening the spectrum assuming E(B-V)=0.05. Hamilton et al. (2007) analyzed the IUE spectrum SWP 07297 of EM Cyg in outburst assuming d=350pc, , and obtained that the flux comes mostly from a disk with /year.
In the spectral analysis of Winter & Sion (2003) and Urban & Sion (2006) only the IUE spectra of EM Cyg in quiescence was modeled. While in the work of Welsh et al. (2005) the fitting of the short wavelength range of FUSE (Å) was not carried out satisfactorily (as pointed out by Welsh et al. (2005) themselves). It is the purpose of this work to carry out a spectral fit to the FUSE spectrum of EM Cyg in quiescence including the short wavelength range, and to obtain the physical parameters of the exposed WD.
We give particular importance to the orbital phase at which the individual FUSE exposures were obtained. We show that at particular orbital phases the WD might be veiled by the stream from the first Lagrangian point overflowing the disk. We remark that previous estimates might have modeled a flux attenuated by as much as 75%, and consequently obtained a low WD temperature. We model here the FUSE spectrum of the WD when veiling is minimum and obtain a temperature K and possibly as high as 50,000K.
In the next section we present the four individual FUSE exposures and compare them with the IUE spectra taken in quiescence; in section 3 we review the stream-disk interaction and in particular we check the possibility of the stream overflowing the disk; in section 4 we describe the synthetic stellar spectral code as well as our fitting technique; the results are presented in section 5; and a discussion with our conclusions are given in the last section.
2 Observations of EM Cyg
2.1 The FUSE Spectrum
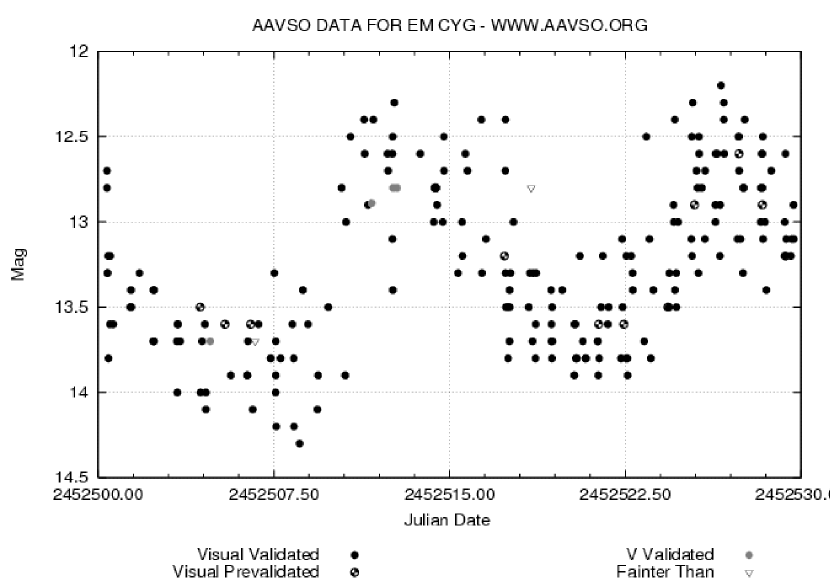
The FUSE data of EM Cyg were obtained on 2002 Sep 5 (HJD2452522-3, when the system was in a low state, see Figure 2) through the 30”x30” LWRS Large Square Aperture in TIME TAG mode. The data were processed with the latest and final version of CalFUSE (v3.2.0; Dixon et al. (2007)). We process the FUSE data as in Godon et al. (2008), and details of the procedure can be found there.
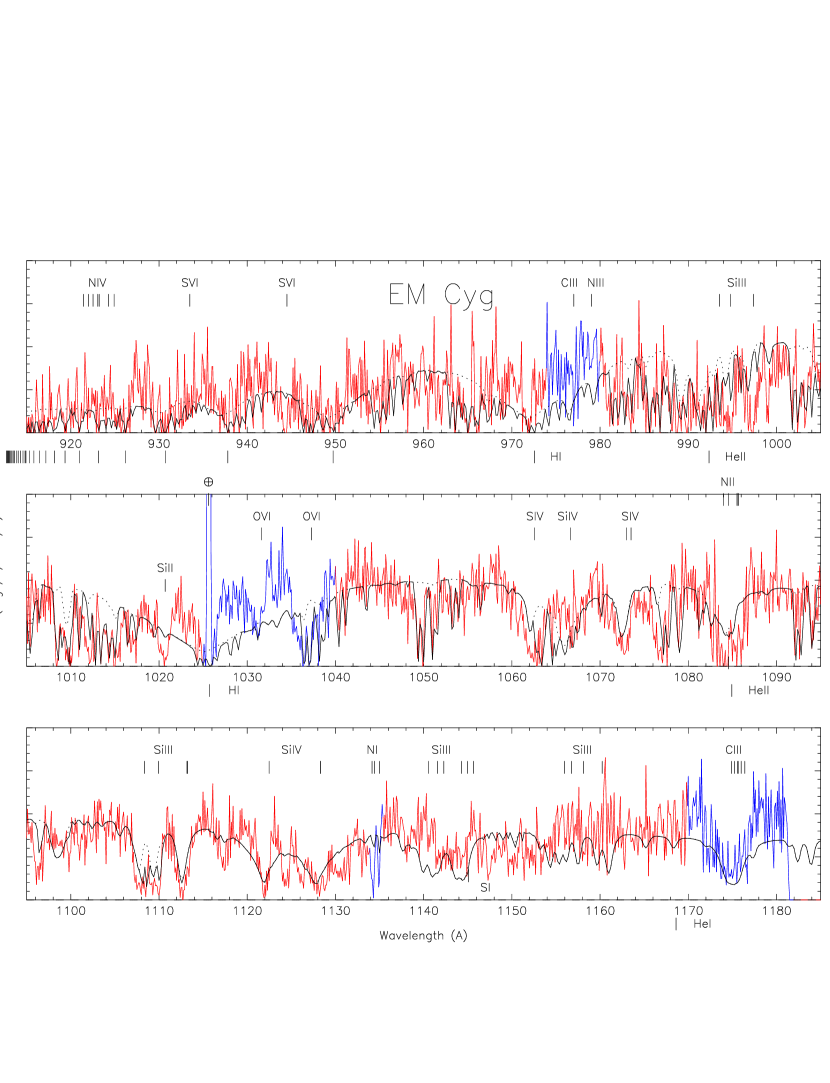
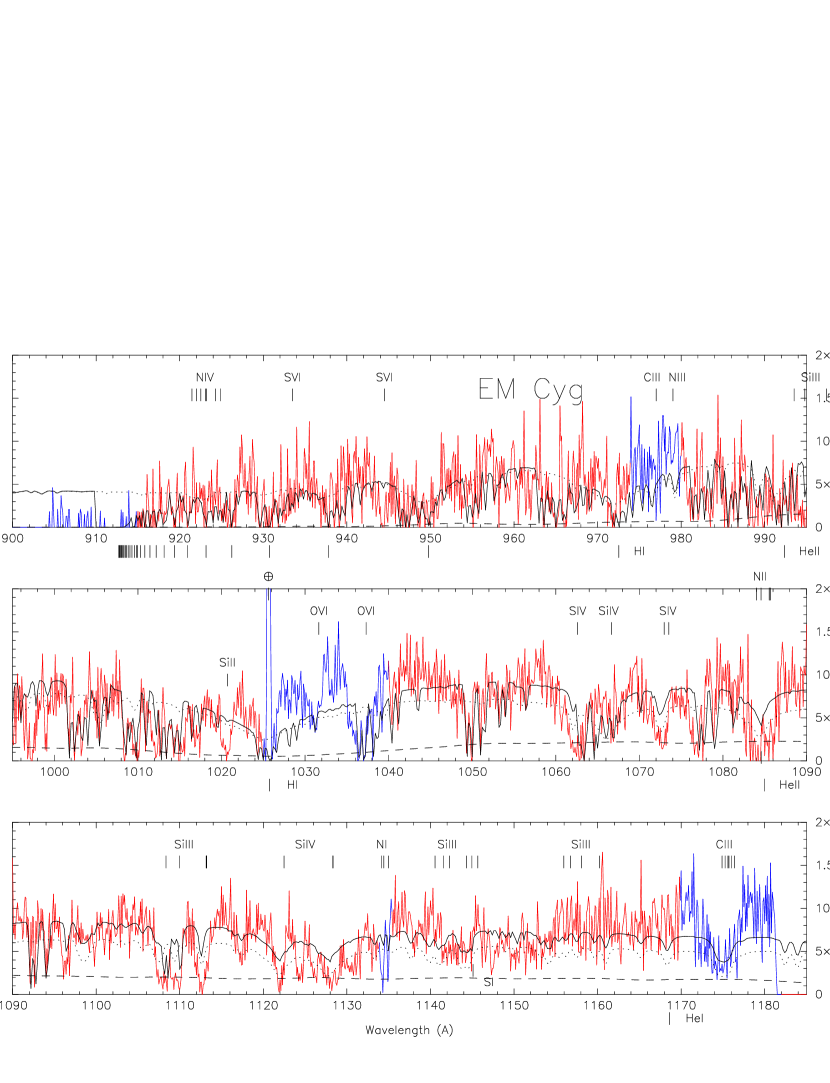
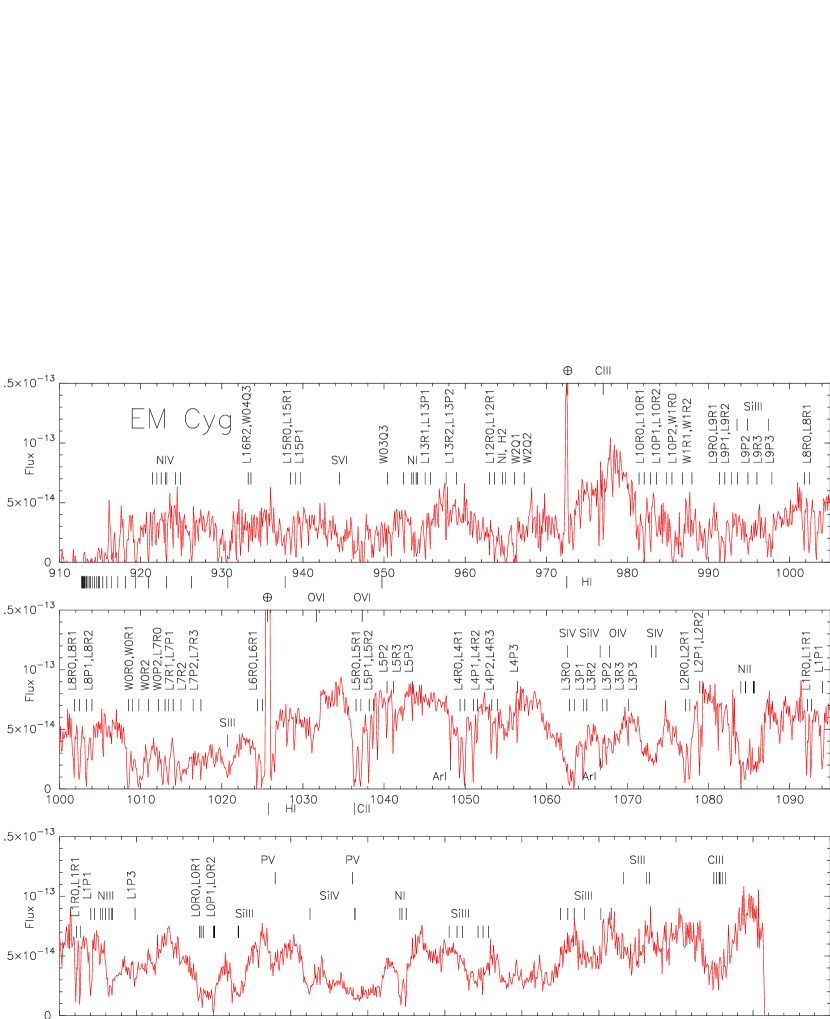
The FUSE spectrum of EM Cyg consists of 4 individual exposures
(one per orbit). For the purpose of line identifications we present the
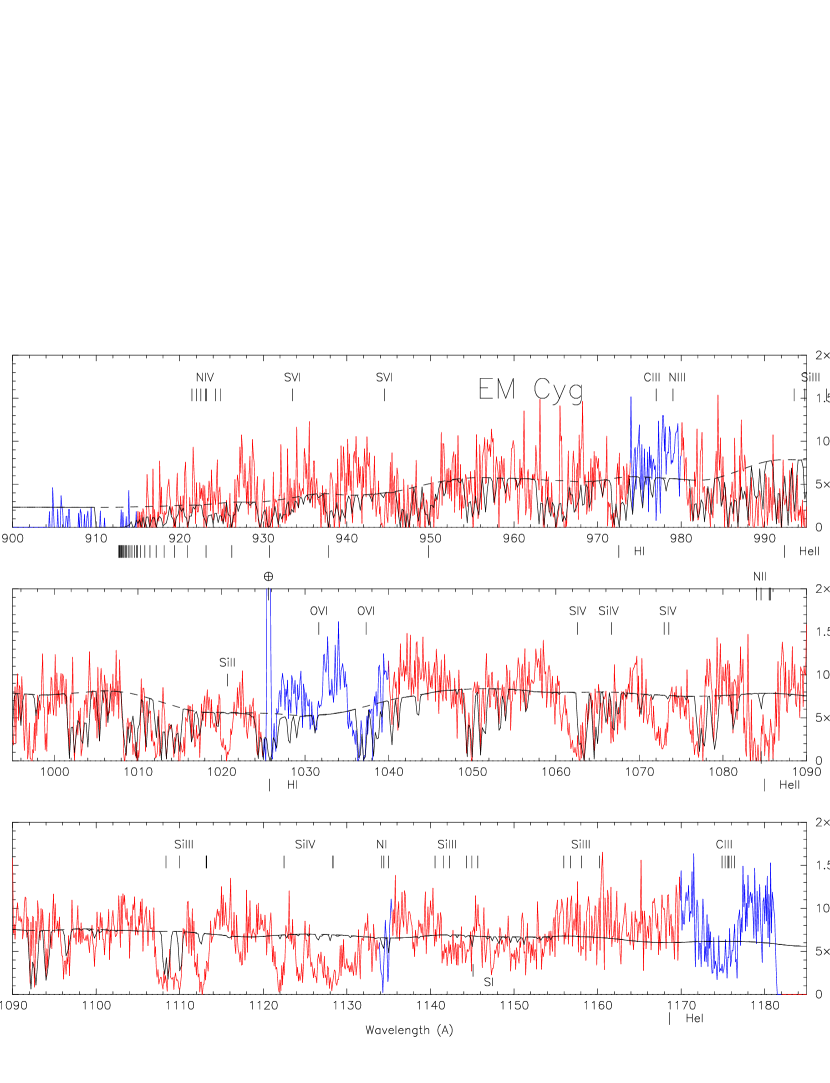
averaged spectrum in Figure 3.
We identify many ISM molecular hydrogen absorption lines as
well as some of the metal lines usually seen in the FUSE
spectra of accreting WDs.
The metal lines we identify are as follows:
- the S iii (1021 Å),
S iv (1062 & 1073 Å),
S vi (945 Å) lines
and O vi doublet, all indicative of a higher temperature
K and much higher;
- the Si iii (1114 Å ),
Si iv (1122 Å ),
and N ii (1085 Å ) lines, sometimes indicative of a lower
temperature K, but not inconsistent with a higher
temperature;
- the C iii (1175 Å) absorption line,
present at all WD temperatures, as long as the carbon abundance
is a fraction of its solar value.
The C ii (1010Å& 1066Å) absorption lines, seen
at lower temperatures (K), are not
detected here (though the C ii (1010Å) could be contaminated
with ISM molecular absorption).
There are some broad emission features from
C iii (977 Å), and the O vi doublet.
The C iii (1175 Å) presents a P-Cygni profile.
The sharper absorption lines are from the
ISM and possibly also from circumbinary material. It is likely that the
nitrogen absorption lines (N i & N ii) are
contaminated with terrestrial absorption. All these lines are marked
and identified in Figure 3. There are a few additional absorption
features/lines that we cannot identify, mainly in the longer wavelengths
(these lines are not labeled in the lower panel of Figure 3).
The sharp emission lines are from air glow (geo- and helio-coronal
in origin).
The broad Ly absorption feature is not clearly seen, pointing
to a high temperature, some broad oxygen doublet emission contamination,
and/or possibly a rotational velocity broadening from a disk component.
In the short wavelengths (Å) the flux does not go to zero
and the continuum there is about 1/3 of the flux at longer
wavelengths (Å), indicative of a high temperature and
consistent with the presence of higher ionization metal lines.
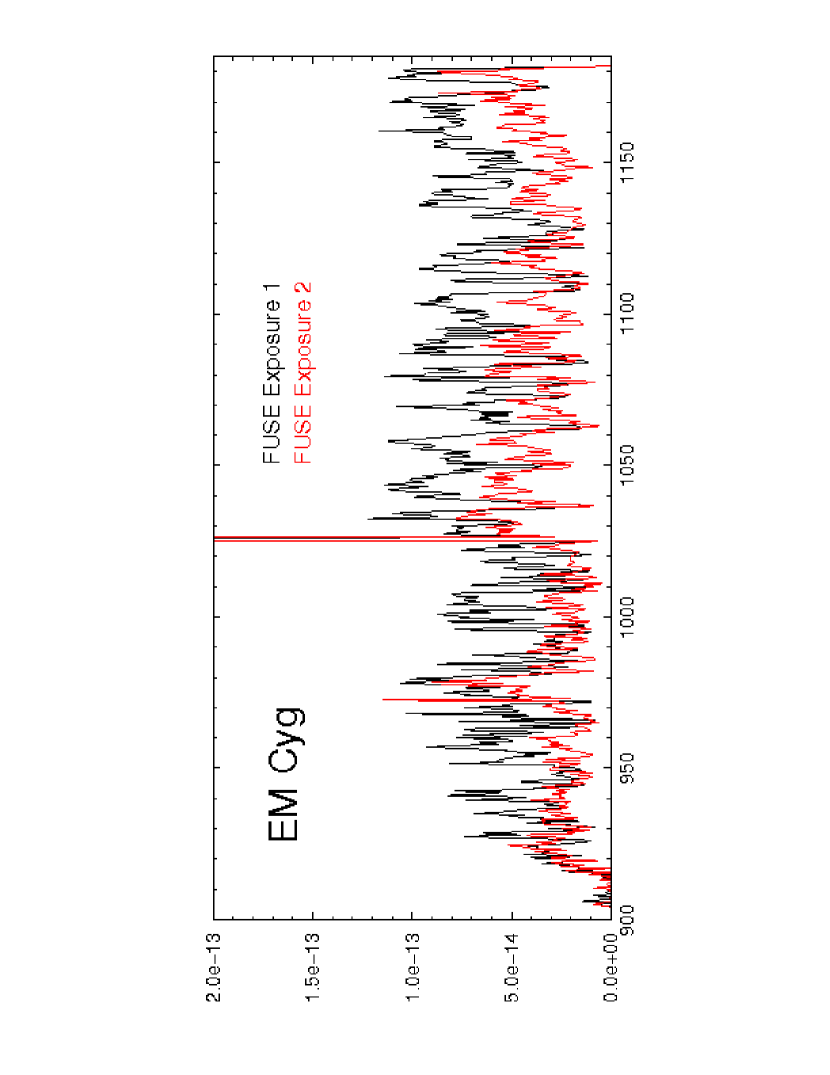
As mentioned, this FUSE spectrum consists of 4 individual exposures taken during 4 consecutive orbits of the FUSE telescope. The four exposures correspond to the binary phases 0.45, 0.65, 0.90, and 0.15, where corresponds to the eclipse (Welsh et al., 2005, 2007). The observations log for the individual FUSE exposures is given in Table 2. Using an analysis of the lines in the four individual FUSE exposures, Welsh et al. (2005, 2007) explicitly showed how the radial velocity changes as a function of the orbital phase. However, they did not consider the variation of the continuum flux level from exposure to exposure, i.e. the variation of the FUV flux as a function of the orbital phase. In Figure 4 we show how the flux varies from exposure to exposure, and this change is also registered in the visual magnitude of the system as shown in data from the AAVSO in Figure 2. We find that at phases 0.15 & 0.45 (exposures 4 & 1) the FUSE continuum flux is larger (by up to a factor three) than at phases 0.65 & 0.90 (exposures 2 & 3).
In order to understand the variation of the FUV flux, in Figures 5 we show the binary configuration at the times the 4 FUSE exposures were obtained. From the orbital configuration we see that the flux in exposures 2 & 3 is attenuated when the hot spot region and the stream overflow region are in front of the observer. In the next subsection we carry out an examination of the IUE spectra of EM Cyg, and we find that they too present some flux variation as a function of the orbital phase. We suspect that the FUV flux is possibly attenuated by absorption from the stream material (originating at L1) overflowing the disk edge and reaching a height above (and below) the disk of the order of We further check this suggestion in section 3.
2.2 The IUE Spectra
Since the FUSE flux varies as a function of the orbital phase it is interesting to compare it with other spectra obtained in quiescence; this will also help us interpret results from previous spectral analysis. The existing archival HST/STIS spectra of EM Cyg were taken during outburst, just a week before the acquisition of the quiescent FUSE spectrum (see Figure 2), and the three existing HUT spectra were also taken in outburst. Because of that we disregard the STIS and HUT spectra. However, some of the existing IUE spectra were taken in quiescence, and later were modeled by Winter & Sion (2003); Welsh et al. (2005); Urban & Sion (2006). We present and discuss these spectra here.
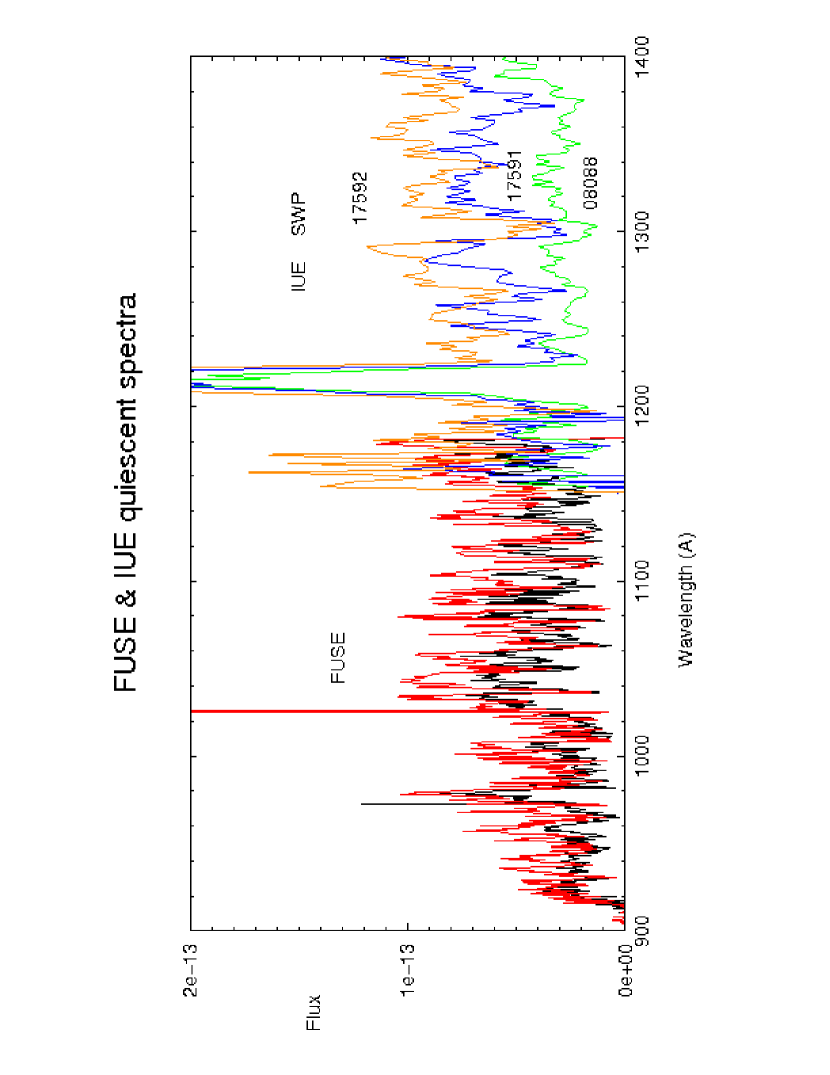
In Figure 6 we compare three IUE SWP spectra taken in quiescence together with the FUSE exposures in the spectral range Å . Since FUSE exposures 2 and 3 have about the same flux, we combine them together, and the same for exposures 1 and 4. We see that SWP 08088 (taken in 1980) has a much lower flux, similar to exposures 2 and 3. SWP 17591 (taken in 1982) has a flux level comparable with exposures 1 and 4, while SWP 17592 (taken 90min after SWP 17591) has a higher flux level.
The typical quiescent of the system is 13.5 but it has been observed as faint as 14.5 in quiescence (possibly at eclipse (Spogli et al., 2003, 2005)). From validated AAVSO data, it appears that, at the time of the FUSE observations, the system had a magnitude of (Figure 2), namely EM Cyg wasn’t in its lowest possible quiescent state at the time of the FUSE observations. This is clearly seen in Figure 2, where the previous quiescent state on JD2452505 is about 0.5mag fainter than the quiescent state during which the FUSE observations (JD2452522) were carried out. The IUE SWP 17591 and SWP 17592 spectra were obtained during a brighter state, when EM Cyg was on the rise to outburst, its magnitude around 13.2-13.5 (but still lower than a standstill with ). The IUE SWP 08088 spectrum was at (Szkody, 1981).
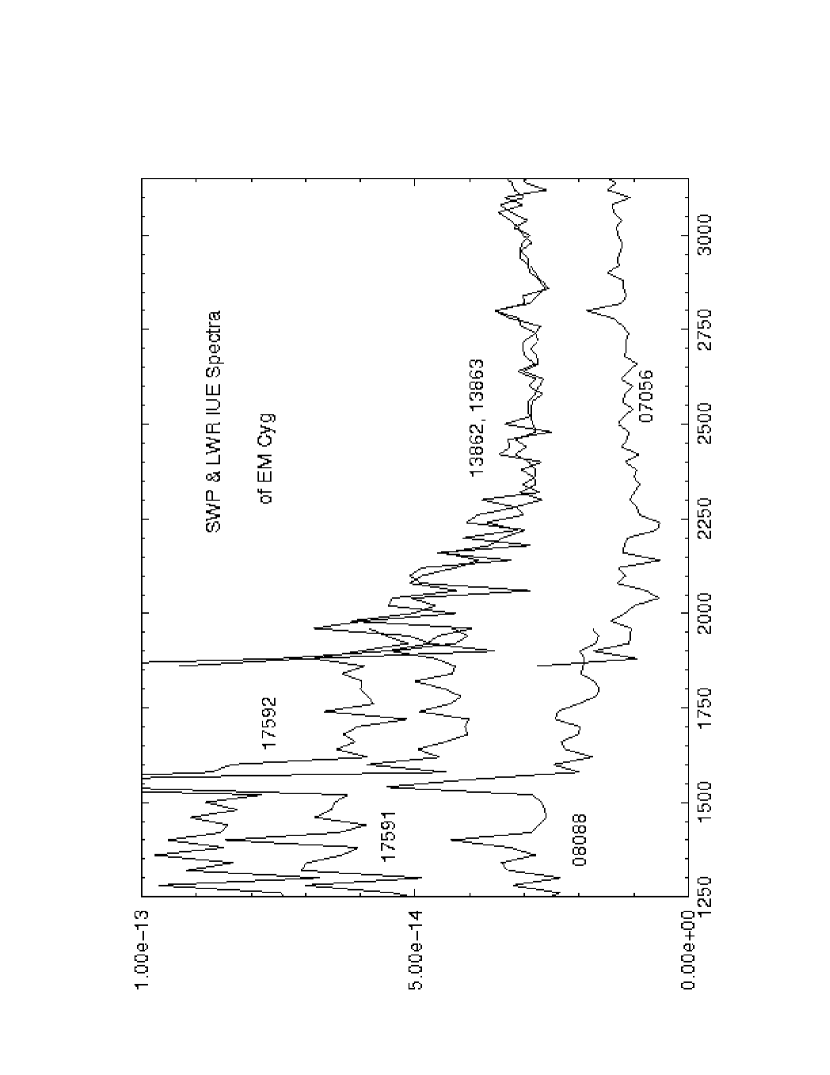
The three IUE SWP spectra are complemented with three LWR spectra. All the quiescent (LWR and SWP) IUE spectra are listed in Table 2 together with their corresponding orbital phase. The increase in flux between SWP 17591 and SWP 17592 over a time scale of 90min is most probably due to orbital variation (as in FUSE), and the matching LWR spectra 13862 and 13863 do not show any variation. As to the SWP 08088 and (matching) LWR 07056 spectra, their lower flux is due to a deeper quiescence and to orbital variation too.
Because of these changes in flux level (due to both orbital variation and intrinsic changes in the source) combining the FUSE and IUE spectra together is tricky and this might explain the difficulty Welsh et al. (2005) were having to match both the short wavelengths of FUSE and the longer wavelengths of IUE in the same fit. As a consequence we do not combine the FUSE spectrum of EM Cyg with any IUE spectrum. The shorter wavelength range as well as the higher S/N of FUSE over IUE makes the FUSE spectrum of EM Cyg ideal for determining the temperature of the accreting WD.
From the FUSE & IUE spectra of EM Cyg, we found that the FUV flux between 900Å and 2000Å is attenuated around phase . Since the FUSE spectrum presents many deep absorption lines, it is tempting to suggest the possibility of an absorbing component moving in front of the observer around phase , as the binary rotates. We further investigate this possibility in the next section.
3 The Stream-Disk Interaction
The only components of the system that could be in the field of view of the WD/inner disk around are the region downstream the hot spot and the stream possibly overflowing disk at the hot spot. In order to check this possibility, in this section, we consider previous studies of the stream-disk interaction, and also present a simple ballistic trajectory simulation using the binary parameters of EM Cyg. We show that for the binary parameters of EM Cyg, stream material could be found high enough above the disk of the plane, around phase to actually veil the WD and inner disk.
Pioneering analytical studies by Lubow & Shu (1976); Lubow (1989) have shown how part of the stream material possibly flows over and under the disk and falls back onto the disk at smaller radii at an angle ( is measured counter clockwise from the line joining the two stars), corresponding to an orbital phase . Observationally, Doppler tomography (Marsh, 1985) has been used for a quarter of a century to confirm the stream disk interaction and the impact at smaller radii in some system (e.g. Z Cha). In Lubow (1989) some of the stream matter was flowing over the disk at a scale height , where is the binary separation. For a disk of diameter , this corresponds to a scale height of at the edge of the disk. Namely, in these analytical studies, it was obtained that stream material overflows the disk rim (at the hot spot) and continue toward smaller radii while basically grazing the disk’s surfaces (at a few vertical scale lengths - a few ). Therefore, based on these studies alone, in order for the material to veil the WD, the inclination of the system has to be or larger: the system has to be nearly edge-on.
However, more recent full 3D hydrodynamical simulations, e.g. (Blondin, 1998; Kunze et al., 2001; Bisikalo et al., 2003), have followed in detail the interaction of the material streaming from the first Lagrangian point (L1) with the disk. The main result from these simulations is that the stream does not simply grazed the disk’s surfaces, but matter is actually deflected vertically from the hot spot and flows in a more or less diffuse stream to inner parts of the disk, hitting the disk surface close to the circularization radius (see Lubow & Shu (1975) for details on ) at orbital phase 0.5. In these simulations, the stream material deflected vertically at the hot spot region can reach an altitude . This stream deflection is believed to cause X-ray absorption in CVs (and LMXBs) around orbital phase 0.7, if the inclination is at least (Kunze et al., 2001). These simulations also explain streams of material perpendicular to the orbital plane as observed in Algol-type binaries (e.g. U CrB; Agafonov et al. (2009) and references therein). These results imply that stream material can be deflected vertically, and reaches a height and lands onto the disk at (corresponding to an orbital phase 0.5) (Kunze et al., 2001).
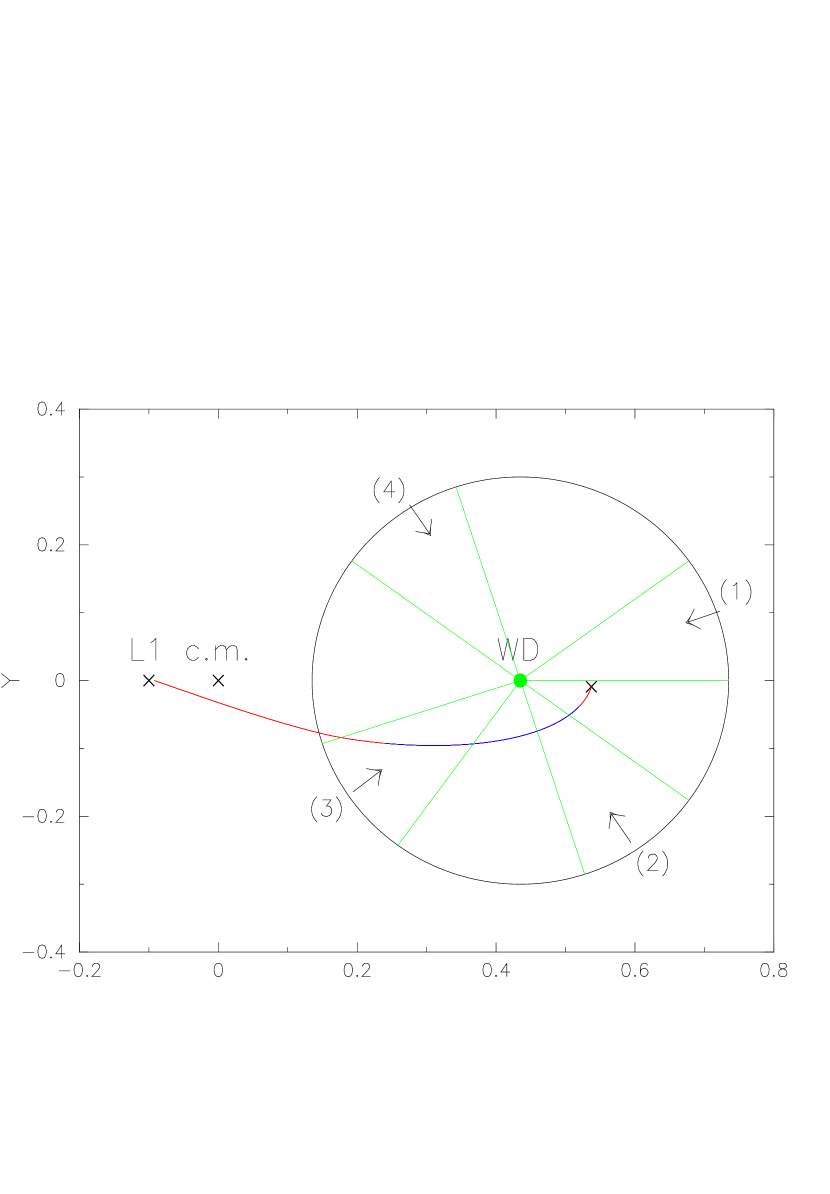
We suggest the same might be happening in EM Cyg, and the decreased flux around might be caused by the deflected stream flow. In order to verify the plausibility of this scenario, we simulate the stream flow from the L1 point using the ballistic trajectory approximation, and we deflect the ballistic particle at the hot spot by an angle (measure from the plane of the disk). Since the stream flow consists of a infinite number (in the continuity limit) of particles (and since the stream has a finite thickness extending vertically), the ballistic trajectory is solved for all possible value of (from to ). A maximum altitude is reached for a critical angle of deflection . This maximum altitudes depends on the values of the system parameters: veiling will not occur for every mass ratio, disk radius and inclination (the full details of the simulations as well as results for the entire space parameters of CVs are given elsewhere (Godon, 2009)). Figure 8 depicts such a simulation for EM Cyg, where we show with arrows the 4 FUSE exposures. The mass ratio is 0.77 and . The stream is shown in red and the blue area represents that portion of the trajectory for which the material reaches , corresponding to veiling at . Here the stream is deflected at the hot spot with an angle above (and below) the plane of the disk. This is the angle for which the altitude of the ballistic particle reaches a maximum. For a smaller, or larger, deflection angle , the blue region shrinks. For a smaller disk radius () the maximum elevation above the disk increases, however, the hot spot moves counterclockwise towards and as a consequence exposure (3) is not as veiled as for . This points to the importance of the large disk in EM Cyg for deflecting material off the disk plane around . This picture is consistent with the full 3D hydrodynamical simulations of Kunze et al. (2001). For different system parameters (inclination, mass ratio and disk radius) the deflected material does not especially veil the WD, as the maximum vertical elevation of the ballistic particle does not always reach .
From this specific ballistic trajectory simulation with the system parameters of EM Cyg, we conclude that the lower flux in the FUSE exposures 2 and 3 can be accounted for with stream material being deflected vertically at the hot spot forming a veil in front of the WD between orbital phases and (for an inclination of ). The increase in flux between the IUE spectra SWP 17591 () and SWP 17592 () over a time scale of 90min can also be explained by veiling of the WD/inner disk by the stream overflow around phase 0.75 (keeping in mind that the WD/inner disk are not eclipsed around ).
Furthermore, the stream material overflowing the disk edge lands onto the disk at a smaller radius corresponding to orbital phase of up to , and produces a bright spot there (Marsh, 1985; Lubow, 1989). Together with the hot spot, this contributes to additional flux in the longer wavelengths (LWR spectra). The emission from the hot spot and point of impact is possibly seen in the LWR spectra (13862, 13863) shown in Figure 7 as a plateau in the longer wavelengths (Å), where one rather expects the flux to decrease there. This flux in the longer wavelengths was already associated with emission from the hot spot by Szkody (1981). Though we have no way to confirm that the plateau in the longer wavelengths of IUE is due in part to the impact point of the stream overflow, it is, however, consistent with this possibility. The plateau seen in the LWR spectra, is also contributing significantly to the longer wavelengths of the SWP spectra. This is especially true for the SWP 08088 spectrum. These are additional reasons not to model the IUE spectra, nor to combine them with the existing FUSE spectrum, as the hot spot and point of impact contribute flux to the longer wavelengths of the IUE SWP spectra.
4 Synthetic Spectral Modeling
4.1 Modeling the Stellar Spectrum
We create model spectra for high-gravity stellar atmospheres using the codes TLUSTY and SYNSPEC222 http://nova.astro.umd.edu; TLUSTY version 200, SYNSPEC version 48 (Hubeny, 1988; Hubeny & Lanz, 1995). We generate photospheric models for a WD with effective temperatures ranging from 12,000K to 75,000K in increments of about 10 percent (e.g. 1,000K for T15,000K and 5,000K for T70,000K). We vary the stellar rotational velocity from km s-1 to km s-1 in steps of km s-1.
We also use disk models from the grid of models generated by Wade & Hubeny (1998). We select their models with a WD mass and inclinations & . These models have solar abundances, but because of the velocity broadening the absorption lines are completely smoothed out, such that the disk models () are not sensitive to the chemical abundances. These disk models are either used as such or in combination with WD models we generate.
After having generated grids of models, we use FIT (Press et al., 1992), a minimization routine, to compute the reduced ( per number of degrees of freedom) and scale factor values for each model fit. Before carrying out each synthetic spectral fit of the spectrum, we masked portions of the spectrum with strong emission lines, and air glow. While we use a minimization technique, we do not blindly select the least models, but we also examine the models that best fit some of the features such as absorption lines.
The WD rotation () rate is determined by fitting the WD model to the spectrum while paying careful attention to the line profiles. We did not carry out separate fits to individual lines but rather tried to fit the lines and continuum in the same fit. We first fit solar abundance models and only then we change the abundances of the species.
4.2 Modeling the ISM Hydrogen Absorption Lines
We identify ISM lines in Figure 3 to avoid confusing them with the WD lines. The ISM lines are deep and broad and we decided to model them, especially since some of the WD lines (such as S iv 1062.6 & 1073) are located at almost the same wavelengths.
We model the ISM hydrogen absorption lines to assess the atomic and molecular column densities. This enables us to improve the WD spectral fit. The ISM models (transition tables) are generated using a program developed by P.E. Barrett. This program uses a custom spectral fitting package to estimate the temperature and density of the interstellar absorption lines of atomic and molecular hydrogen. The ISM model assumes that the temperature, bulk velocity, and turbulent velocity of the medium are the same for all atomic and molecular species, whereas the densities of atomic and molecular hydrogen, and the ratios of deuterium to hydrogen and metals (including helium) to hydrogen can be adjusted independently. The model uses atomic data of Morton (2000, 2003) and molecular data of Abgrall et al. (2000). The optical depth calculations of molecular hydrogen have been checked against those of McCandliss (2003).
The ratios of metals to hydrogen and deuterium to hydrogen are fixed at 0 and , respectively, because of the low signal-to-noise ratio data. The wings of the atomic lines are used to estimate the density of atomic hydrogen and the depth of the unsaturated molecular lines for molecular hydrogen. The temperature and turbulent velocity of the medium are primarily determined from the lines of molecular hydrogen when the ISM temperatures are K.
The ISM absorption features are best modeled and displayed when the theoretical ISM model (transmission values) is combined with a synthetic spectrum for the object (namely a WD synthetic spectrum or a WD+disk composite spectrum).
5 Results
Though the distance estimate to EM Cyg is most like around 400pc (Bailey, 1981; Jameson et al., 1981; Winter & Sion, 2003; Welsh et al., 2005), we do not fix the distance in our model fitting. We adopt a WD mass of (Welsh et al., 2007) in all our models, with a corresponding radius of km (giving ). All the model fits are carried out on the first exposure (with the maximum flux). The reddening toward EM Cyg is . As a consequence, we model EM Cyg assuming both E(B-V)=0.0 and E(B-V)=0.05. We first carry out the fitting without dereddening the spectrum, and only later do we deredden the spectrum (assuming (E(B-V)=0.05) to assess the effect of reddening on the results.
We first run single disk models. We find that in order to fit the short wavelengths of FUSE, the best single disk model has a mass accretion rate yr-1, i.e. far larger than expected for quiescence, and . The model is shown in Figure 9. It gives a distance of 441pc and (all our values are smaller than one due to the low S/N of the FUSE exposures). On top of the model, we add an ISM model in order to optimize the fit. The ISM has the following parameters atoms/cm2 , molecules/cm2, T=160K, v=25km/s, , and Z=0 solar. We did not try to optimize the ISM model itself, nor to obtain accurate parameter values for the ISM. The modeling the ISM is carried only in the context of improving the disk/WD model fit and to help identify the lines and spectral features. It is clear from Figure 9 that this disk model only vaguely follows the continuum of the spectrum and does not fit the absorption features (except for the ISM lines). The two best single disk models are listed in Table 3.
Next, we run single WD models. We find that in order to fit the continuum the WD must have a temperature of 40,000K, with a corresponding distance of 280pc . The obtained is . The two first WD models in Table 3 shows how the distance and change as a function of the WD temperature. In this first set we chose a guessed rotational velocity of 200km/s. In the next model (Table 3), we improve the value by varying the rotational velocity. The optimal value is somewhere between and km/s, and we decide to fix the rotational velocity to 100km/s.
In the next four models (Table 3) we change the abundances of silicon, sulphur and nitrogen while keeping all the other abundances to their solar value (we found that a solar carbon abundance is the best fit, though the main carbon line at 1175Å has also some broad emission and makes it difficult to model). The best fit is obtained for enhanced abundances as follows: Sulphur: 10 times solar, Nitrogen: 10 time solar and Silicon: 20-30 times solar. We obtain a distance less than anticipated: 260pc. We present this best fit model in Figure 10. In order to optimize the fit we shift the synthetic WD spectrum to the blue by 0.5Å , to account for the radial velocity shift. This improves slightly the values (the values listed in Table 3 reflect this improvement). We also add an ISM model to the WD model, however, the ISM model is not shifted.
In the next model in Table 3 we deredden the spectrum assuming E(B-V)=0.05, and obtain the same results, except for the distance. Here the distance is barely 200pc. We note that assuming a WD mass of can increase the distance to 350pc without changing the remaining parameters of the fit. On the other side, adding an accretion disk does increase the distance too, and this is what we do next.
For the WD+disk composite model, we first take our best single WD model and add a disk model to it, to try and improve the fit and increase the distance. We find that the mass accretion rate has to be at least yr-1 for the disk to contribute a noticeable flux. As the disk is added, the model deteriorates and give a larger . We present such a model in Figure 11. The fit in the lower wavelength is not as good as the best fit single WD model presented in Figure 10.
In order to try and improve the fit in the shorter wavelength we increase the WD temperature, as the mass accretion rate is already too large for quiescence and therefore cannot be increased. We find that the fit in the shorter wavelengths can be improved by elevating the WD to a temperature K, however the overall is further increased by doing so. This model is shown in Figure 12. While the model does well at fitting the overall continuum of the spectrum, it does not fit the FUSE absorption lines as the velocity broadening in the disk makes the overall depth of the line shallower in the WD+disk model. It is possible that the absorption lines form above the disk and WD; we discuss this possibility and its implications in the next and last section.
6 Discussion and Conclusions
The over abundances and the unidentified lines in the FUSE spectrum of EM Cyg might be associated with some of the veiling material rather than the WD itself, we have no additional way to verify this. However, simulations of the stream disk interaction (Kunze et al., 2001) show that the stream overflow hits the disk at smaller radii where it can in part bounce back. If this is the case, stream material can be found at any orbital phase, but with greater density and altitude above the disk plane around . The rich variety of lines observed in the present FUSE spectrum of EM Cyg is reminiscent of the HST/STIS spectrum of the DN TT Crt observed in a low state with an inclination of (Sion et al., 2008), and of the FUSE spectrum of the NL BB Dor possibly with an inclination of (Godon et al., 2008). These spectra suggest line formation in different temperature regions, whether due to a wind above the disk (as could be the case in BB Dor) or overflowing stream material (possibly for TT Crt). So the strong and deep absorption lines in the FUSE exposure 1 of EM Cyg are likely due to circumstellar material, i.e. stream material overflowing the disk rim and bouncing off the disk at smaller radii, while the lower flux in exposures 2 and 3 are due to the direct veiling of the WD by the stream overflow around phase 0.7.
If the veiling material is responsible for the absorption lines, then the abundance fitting is not valid anymore, as the lines might be out of thermodynamic equilibrium or represent highly variable optical depths. As a consequence, the best fit to the continuum is actually the WD+disk model shown in Figure 12, rather than the single WD model. While the single WD model has a lower value, the WD+disk model is in better agreement with the distance of the system and its higher-than-quiescent state. Because of this, we conclude that the FUSE spectrum of EM Cyg is best interpreted as the spectrum of a hot WD with a small contribution from a low mass accretion disk.
The picture that emerges from this spectral analysis, is that of a 50,000K WD, contributing 93% of the total FUV flux, and a disk, with yr-1 contributing the remaining 7%. Such a composite WD+disk model gives a distance d=382pc in best agreement with its expected value. The WD+disk model is also in agreement with the moderately higher-than-quiescent state during which the FUSE spectrum was taken, even though the value is slightly larger as the model does not fit the absorption lines very well. The spectrum presents some deep absorption lines as well as unidentified lines in the longer wavelength region (Å), apparently forming in front and above the WD/disk, from stream material overflowing the disk edge. As a consequence, the exposure taken at phase has a higher flux than exposures obtained around . The large disk () in EM Cyg is consistent with this picture, as the hot spot is consequently located closer to the secondary (around ) and L1 stream material can more easily be found off the disk plane. The large disk is also consistent with the non-negligible mass accretion rate (yr-1).
However, whether modeled with a single WD component or a WD+disk composite model, the FUSE spectrum of EM Cyg reveals a rather hot WD. This result is in strong disagreement with the previous spectral analysis of Welsh et al. (2005); Winter & Sion (2003); Urban & Sion (2006) who found a WD temperature K. The discrepancy with previous analysis is due to (i) veiling of the WD by stream material overflowing the disk rim (in both the FUSE and IUE spectra around orbital phase , which were modeled as such); (ii) contribution of the hot spot and secondary impact region to the longer wavelengths of the IUE SWP spectra; and (iii) eclipse of the disk in the SWP 08088 IUE spectrum (taken around orbital phase ). In addition, in these previous analysis, the flux was contributed mostly from an accretion disk, while in the present work the main component is the WD.
Originally, the derivation of EM Cyg system parameters were affected by the presence of the third star, Arkadash, in the background of the system. In a similar way, we find that the previously derived mass accretion rate and WD temperature might have been affected by the veiling of the WD and disk by stream overflow around orbital phase .
References
- Abgrall et al. (2000) Abgrall, H., Roueff, E., & Drira, I. 2000, A&AS, 141, 297
- Agafonov et al. (2009) Agafonov, M., Sharova, O., Richards, M., 2009, ApJ, 690, 1730
- Bailey (1981) Bailey, J.A. 1981, MNRAS, 197, 31
- Beuermann & Pakull (1984) Beuermann, K. and Pakull, M.W. 1984, A&A, 136, 250
- Bisikalo et al. (2003) Bisikalo, D.V., Boyarchuk, A.A., Kaygorodov, P.V., Kuznetsov, O.A., 2003, Astron.Rep., 47, 809 (originally in Russian: Astro.Zhurnal 80, 2003, 879)
- Blondin (1998) Blondin, J.M. 1998, API Conf.Proc. 431, 309
- Bruch & Engel (1994) Bruch, A., & Engel, A. 1994, A&AS, 104, 79
- Burbidge & Burbidge (1953) Burbidge, E.M., Burbidge, G.R. 1953, ApJ, 118, 349
- Cannizzo (1998) Cannizzo, J. 1998, ApJ, 493, 426
- Csizmadia et al. (2008) Csizmadia, Sz., Nagy, Zs., Borkovits, T., Hegedüs, T., Biro, I.B., Kiss, Z.T. 2008, AN 329, 39
- Dixon et al. (2007) Dixon, W.V., et al. 2007, PASP, 119, 527
- Godon (2009) Godon, P. 2009, in preparation
- Godon et al. (2008) Godon, P., Sion, E.M., Barrett, P.E., Szkody, P., Schlegel, E.M. 2008, ApJ, 687, 532
- Hack & La Dous (1993) Hack, M., & La Dous, C. 1993, Cataclysmic Variables and Related Objects, (NASA SP-507)/US Gov.Printing Office
- Hamilton et al. (2007) Hamilton, T.R., Urban, J.A., Sion, E.M., Riedel, A.R., Voyer, E.N., Marcy, J.T. Lakatos, S.L. 2007, ApJ, 667, 1139
- Harrison et al. (2004) Harrison, T.E., Johnson, J.J., McArthur, B.E., Benedict, G.F., Szkody, P., Howell, S.B., Gelino, D.M. 2004, AJ, 127 460
- Hubeny (1988) Hubeny, I. 1988, Comput. Phys. Commun., 52, 103
- Hubeny & Lanz (1995) Hubeny, I.,& Lanz, T. 1995, ApJ, 439, 875
- Jameson et al. (1981) Jameson, R.F., King, A.R., & Sherrington, M.R. 1981, MNRAS, 195, 235
- Kraft (1964) Kraft, R.P. 1964, 1st Conf. on Faint Blue Stars, ed. Luyten, U. of Minnesota Press, Minneapolis
- Kunze et al. (2001) Kunze, S., Speith, R., & Hessman, F.V. 2001, MNRAS, 322, 499
- La Dous (1991) La Dous, C. 1991, A&A, 252, 100
- Lubow (1989) Lubow, S.H. 1989, ApJ, 340, 1064
- Lubow & Shu (1975) Lubow, S.H., & Shu, F.H. 1975, ApJ, 198, 383
- Lubow & Shu (1976) Lubow, S.H., & Shu, F.H. 1976, ApJ, 207, L53
- Marsh (1985) Marsh, T. 1985, Ph.D. thesis, Cambridge University
- McCandliss (2003) McCandliss, S.R. 2003, PASP, 115, 651
- Morton (2000) Morton, D.C. 2000, ApJS, 130, 403
- Morton (2003) Morton, D.C. 2003, ApJS, 149, 205
- Mumford (1980) Mumford, G.S 1980, AJ 85, 748
- Mumford & Krezminski (1969) Mumford, G.S., Krezminski, W. 1969, Ap 166, 429
- Nevo & Sadeh (1978) Nevo, I., & Sadeh, D. 1978, MNRAS, 182, 595
- North et al. (2000) North, R.C., Marsh, T.R., Moran, C.K.J., Kolb, U., Smith, R.C., Stehle, R. 2000, MNRAS, 313, 383
- Patterson (1981) Patterson, J. 1981, ApJS, 45, 517
- Press et al. (1992) Press, W.H., Teukolsky, S.A., Vetterling, W.T., Flannery, B.P., Numerical Recipes in Fortran 77, The Art of Scientific Computing, Second Edition, 1992, Cambridge University Press.
- Pringle (1975) Pringle, J. 1975, MNRAS, 170, 633
- Ritter & Kolb (2003) Ritter H., & Kolb U. 2003, A&A, 404, 301 http://physics.open.ac.uk/RKcat/RKcat_AA.ps
- Robinson (1974) Robinson, E.L. 1974, ApJ, 193, 191
- Sion et al. (2008) Sion, E.M., Gänsicke, B.T., Long, K.S., Szkody, P., Knigged, C., Hubeny, I., deMartino, D., Godon, P. 2008, ApJ, 681, 543
- Stiening et al. (1982) Stiening, R.F., Dragovan, M., Hildebrand, R.H. 1982, PASP, 94, 672
- Stover et al. (1981) Stover, R.J., Robinson, E.L., Nather, R.E. 1981, ApJ, 248, 696
- Spogli et al. (2003) Spogli, C., Fiorucci, M., Raimondo, G. 2003, IBVS 5365, 1
- Spogli et al. (2005) Spogli, C., et al. 2005, IBVS 5996, 1
- Szkody (1981) Szkody, P. 1981, ApJ, 247, 577
- Urban & Sion (2006) Urban, J.A., Sion, E.M. 2006, ApJ, 642, 1029
- Verbunt (1987) Verbunt, F. 1987, A&AS, 71, 339
- Wade & Hubeny (1998) Wade, R.A., & Hubeny, I. 1998, ApJ, 509, 350
- Warner (1995) Warner, B. 1995, Cataclysmic Variable Stars (Cambridge: Cambridge Univ. Press)
- Welsh et al. (2005) Welsh, W.F., Froning, C.S., Marsh, T.R., Robinson, E.L., Wood, J.H., 2005, ASPC 330, 351
- Welsh et al. (2007) Welsh, W.F., Froning, C.S., Marsh, T.R., Reimer, T.W., Robinson, E.L., Wood, J.P.R. 2007, ASPC 362, 241
- Winter & Sion (2003) Winter, L. and Sion, E.M. 2003, ApJ, 582, 352
| Parameter | Value | References |
|---|---|---|
| 7hr/0.29090912d | Mumford & Krezminski (1969) | |
| North et al. (2000) | ||
| Welsh et al. (2007); Robinson (1974); Stover et al. (1981) | ||
| Welsh et al. (2007); Robinson (1974); Stover et al. (1981) | ||
| 350-500pc | Bailey (1981); Jameson et al. (1981); Welsh et al. (2005) | |
| 14.4 | Spogli et al. (2003, 2005) | |
| 12.5 | Spogli et al. (2003, 2005) | |
| DNO | 14.6-16.5s | Stiening et al. (1982) |
| 2nd Spec.Type | K3V | North et al. (2000) |
| Arkadash Spec.Type | K2V-K5V | North et al. (2000) |
| Gal.Lat. | 4.277∘ | SIMBAD |
| E(B-V) | 0.050.03 | Verbunt (1987); La Dous (1991); Bruch & Engel (1994) |
| Obs. | Date | Time | Exp.time | Dataset | Start | Phase1 | V |
|---|---|---|---|---|---|---|---|
| (dd/mm/yy) | (UT) | (sec) | HJD | ( ) | (range) | ||
| FUSE | 05/09/02 | 11h34m11s | 1,479 | C0100101001 | 2452522.9849 | 0.42-0.48 | 13.1-13.9 |
| FUSE | 05/09/02 | 12h54m33s | 2,651 | C0100101002 | 2452523.0407 | 0.62-0.73 | 13.1-13.9 |
| FUSE | 05/09/02 | 14h34m31s | 2,648 | C0100101003 | 2452523.1102 | 0.85-0.96 | 13.1-13.9 |
| FUSE | 05/09/02 | 16h22m59s | 2,135 | C0100101004 | 2452523.1855 | 0.11-0.19 | 13.1-13.9 |
| IUE | 29/02/80 | 14h42m50s | 2,700 | LWR 07056 | 2444299.1102 | 0.86-0.98 | 13.6-13.7 |
| IUE | 29/02/80 | 15h32m22s | 4,500 | SWP 08088 | 2444299.1445 | 0.98-0.16 | 13.6-13.7 |
| IUE | 05/08/82 | 02h40m47s | 1,500 | LWR 13862 | 2445186.6152 | 0.65-0.71 | 13.2-13.5 |
| IUE | 05/08/82 | 03h11m30s | 1,500 | SWP 17591 | 2445186.6366 | 0.72-0.78 | 13.2-13.5 |
| IUE | 05/08/82 | 03h44m26s | 2,400 | LWR 13863 | 2445186.6595 | 0.81-0.91 | 13.2-13.5 |
| IUE | 05/08/82 | 04h34m08s | 2,399 | SWP 17592 | 2445186.6940 | 0.92-0.02 | 13.2-13.5 |
| [Si] | [S] | [N] | d | WD/Disk | Figure | ||||||
|---|---|---|---|---|---|---|---|---|---|---|---|
| (K) | (km/s) | (Solar) | (Solar) | (Solar) | (yr-1) | (deg) | (pc) | % | |||
| — | — | 1.0 | 1.0 | 1.0 | 75 | 441 | 0.6916 | 0/100 | 0.00 | 9 | |
| — | — | 1.0 | 1.0 | 1.0 | 60 | 754 | 0.6867 | 0/100 | 0.00 | ||
| 35 | 200 | 1.0 | 1.0 | 1.0 | - | - | 223 | 0.6063 | 100/0 | 0.00 | |
| 40 | 200 | 1.0 | 1.0 | 1.0 | - | - | 280 | 0.5823 | 100/0 | 0.00 | |
| 40 | 100 | 1.0 | 1.0 | 1.0 | - | - | 280 | 0.5709 | 100/0 | 0.00 | |
| 40 | 100 | 30. | 10. | 1.0 | - | - | 264 | 0.4780 | 100/0 | 0.00 | |
| 40 | 100 | 10. | 10. | 10. | - | - | 267 | 0.4847 | 100/0 | 0.00 | |
| 40 | 100 | 20. | 10. | 10. | - | - | 264 | 0.4768 | 100/0 | 0.00 | |
| 40 | 100 | 30. | 10. | 10. | - | - | 261 | 0.4767 | 100/0 | 0.00 | 10 |
| 40 | 100 | 30. | 10. | 10. | - | - | 197 | 0.4776 | 100/0 | 0.05 | |
| 40 | 100 | 30. | 10. | 10. | 60 | 318 | 0.5291 | 77/23 | 0.00 | 11 | |
| 50 | 100 | 30. | 10. | 10. | 60 | 382 | 0.5573 | 93/7 | 0.00 | 12 |

![[Uncaptioned image]](/html/0904.3879/assets/x5.png)
![[Uncaptioned image]](/html/0904.3879/assets/x6.png)