The ultraluminous X-ray source population of NGC 4485/4490.
Abstract
We report the results of spectral and temporal variability studies of the ultraluminous X-ray sources (ULXs) contained within the interacting pair of galaxies NGC 4485/4490, combining Chandra and XMM-Newton observations. Each of the four separate observations provide at least modest quality spectra and light curves for each of the six previously identified ULXs in this system; we also note the presence of a new transient ULX in the most recent observation. No short-term variability was observed for any ULX within our sample, but three out of five sources show correlated flux/spectral changes over longer timescales, with two others remaining stable in spectrum and luminosity over a period of at least five years. We model the spectra with simple power-law and multi-colour disc black body models. Although the data is insufficient to statistically distinguish models in each epoch, those better modelled (in terms of their fit) by a multi-colour disc black body appear to show a disc-like correlation between luminosity and temperature, whereas those modelled by a power-law veer sharply away from such a relationship. The ULXs with possible correlated flux/spectral changes appear to change spectral form at erg s-1, suggestive of a possible change in spectral state at high luminosities. If this transition is occuring between the very high state and a super-Eddington ultraluminous state, it indicates that the mass of the black holes in these ULXs is around 10–15 .
keywords:
black hole physics – X-rays: binaries – X-rays: galaxies – galaxies: individual: NGC 4485 – galaxies: individual: NGC 44901 Introduction
Ultraluminous X-ray Sources (ULXs) are point like X-ray sources situated external to the nucleus of their host galaxy, which have inferred X-ray luminosities in excess of 1039 erg s-1. Although, first observed 30 years ago by Einstein (Fabbiano 1989), these sources are yet to be fully understood, with the only certainty being that they cannot all be explained by stellar-mass black holes (with masses 3–20 ) radiating isotropically below their Eddington limit. The simplest way to circumvent this issue is to assume that larger compact objects reside within these systems, an approach that would provide us with objects intermediate in mass (IMBH, of mass 100–10,000 ; Colbert & Mushotsky 1999), as well as luminosity, between those of their stellar-mass and super-massive black hole cousins. This idea is appealing as it can provide a ‘missing link’ in the mass scale of these objects and would have significant implications on our understanding of the formation and evolution of both black holes and galaxies (e.g. Madau and Rees 2001; Ebisuzaki et al. 2001). Evidence supporting this scenario was presented in 2003 by Miller et al. in which the spectra of NGC 1313 X-1 and X-2 were fitted with a standard canonical accretion disc plus power-law continuum model for accreting black hole X-ray binary systems. This resulted in a remarkably cool disc temperature of kT150 eV, that implies a black hole mass of . Similar results were found for other sources (e.g. Miller et al 2004a & 2004b). However recent studies, such as Stobbart, Roberts & Wilms (2006), Gonçalves & Soria (2006), Vierdayanti et al. (2006) and Feng & Kaaret (2007) have demonstrated that the spectra of ULXs can be equally well explained by models that infer a stellar-mass black hole (perhaps up to 100 ) accreting at extreme rates to be powering the system.
To date, X-ray spectral analysis has been unable to uniquely determine the nature of ULXs. One option is to turn to a broader bandpass in an attempt to find counterparts to these sources. Alternatively, others have chosen to carry out X-ray variability studies on these highly luminous systems, to compare to the known variability characteristics of stellar-mass sources and AGN on both short and long timescales. The analysis of temporal variability for both stellar and super-massive black holes via power spectral densities (PSD) has shown a scaling by mass and accretion rates of the PSD break time-scales (e.g. McHardy et al 2006). Unfortunately very few ULXs show much variability power, but some measurements have been made, for example Soria et al (2004) detected a break at 2.5 mHz in the PSD of NGC 5408 X-1, which indicated a mass of 100 . In fact, intra-observational studies have revealed that only 15% of ULXs exhibit measurable short-term variability (Swartz et al 2004; Feng & Kaaret 2005).
When extending variability studies to longer timescales problems arise because few sources have been regularly observed. Unlike their Galactic stellar-mass counterparts or the brighter quasars, which can be monitored daily by instruments such as the All Sky Monitor on board the Rossi X-ray Timing Explorer, analysis can only be carried out using pointed observations. This leads to large gaps in the light curves, making it difficult to track the trends of these systems. However, findings to date show that ULXs tend to be persistent over timescales of 10 years (e.g. Roberts et al. 2004). One avenue that remains under-explored is that of spectral variability. These studies suffer from the same windowing issues discussed above, making it difficult to observe spectral evolution in detail. Some studies have been performed, such as the investigation into the X-ray source population of the Antennae performed by Fabbiano et al (2003). This, along with other studies, found that the majority of ULXs display a general hardening as the luminosity of the system increases (e.g. Homberg II X-1, Dewangan et al. in 2004; NGC 5204 X-1, Roberts et al. 2006).
In 2002, Roberts et al. published results from a 20 ks Chandra ACIS-S observation of the interacting galaxy pair NGC 4485 and NGC 4490 (this paper is referred to hereafter as RWWM02). These galaxies reside at a distance 7.8 Mpc, placing these amongst the very nearest interacting pairs of late type galaxies. Initially their work entailed a study of the general X-ray emission from the pair, considering the emission from both diffuse and discrete sources. A total of 29 discrete sources were found to be coincident with NGC 4490 and one with NGC 4485, with luminosities ranging from 2x1037 to 4x1039erg s-1. Of these, six were identified as emitting at ultraluminous rates, a number greatly in excess of the average of 1 per galaxy (Liu, Bregman & Irwin 2006), and a population of ULXs only bettered numerically by M51 and M82 within 10 Mpc. Here we revisit the data presented within RWWM02, combining this with information from subsequent Chandra and XMM-Newton observations in order to better explore the behaviour of these ULXs on both short and long timescales.
2 Observations and Data Reduction
The NGC 4485/4490 galaxy pair has been observed by Chandra on three occasions, the first of which was reported in RWWM02, with two subsequent deeper observations taken during 2004. A search of the XMM-Newton archive revealed one further observation taken in 2002. Details of these observations can be seen in Table 1. (For simplicity, the observations will be labelled as shown in this Table throughout the rest of this paper.)
| Observatory | Detector | Obs ID | Label | Mode | Date | Timea | Exposureb | Aimpointc | |
|---|---|---|---|---|---|---|---|---|---|
| (ks) | RA | Dec | |||||||
| Chandra | ACIS-S | 1579 | C1 | FAINT | 2000:11:03 | 01:24:04 | 19.7 | 12h 30m 31s.2 | +41o 39’ 00” |
| XMM-Newton | EPIC | 0112280201 | X1 | Full Field | 2002:05:27 | 07:15:20 | 12.8 | 12h 30m 30s.28 | +41o38’53”.8 |
| Chandra | ACIS-S | 4725 | C2 | VFAINT | 2004:07:29 | 20:44:43 | 39.0 | 12h 30m 31s.2 | +41o 39’ 00” |
| Chandra | ACIS-S | 4726 | C3 | VFAINT | 2004:11:20 | 06:30:59 | 40.1 | 12h 30m 31s.2 | +41o 39’ 00” |
Notes: aExposure start time in universal time (UT). b Instrument ontime (for EPIC we quote the pn value). cJ2000 coordinates.
2.1 Chandra observations
Chandra observations were performed with the Advanced CCD Imaging Spectrometer (ACIS), using the S-array. The first observation (C1) was positioned on the standard aimpoint for the back-illuminated S3 chip, although a Y offset of -2.0 arcmins was used during subsequent observations to centralise the galaxy pair on the S3 chip. The later observations were also performed with the telemetry in VFAINT mode to optimise the detection of the faint extended diffuse emission component in the galaxies detected by RWWM02. Data reduction was carried out using the ciao software, version 3.3.0.1, and standard Chandra data analysis threads111For Chandra threads, published by the Chandra X-ray Center, see http://asc.harvard.edu/ciao.. The three observations were filtered by energy, rejecting events with energies outside the range 0.3–10 keV. The source spectra and light curves were extracted for each source using the ciao tasks PSEXTRACT and DMEXTRACT, taking data from circular apertures, 5 pixels in diameter (thus encircling of the source energy) and centred on each ULX.
Background spectra were extracted via an annulus encircling the source (8 to 16 pixels in diameter). Background light curves were extracted from circular regions, the same size as the source region, positioned in a source-free region near each ULX. The response and ancillary response files, necessary for spectral analysis, were created automatically by the standard Chandra tasks.
2.2 XMM-Newton observation
Data from the XMM-Newton observation of the NGC 4485/4490 pair was collected from the XMM-Newton science archive (XSA) and reduced using the sas software (version 7.0.0). Here we utilise data from the XMM-Newton European Photon Imaging Camera (EPIC), which was operated in full-field mode with a medium optical filter in place for all 3 cameras during the observation. This observation was affected by a background flare which was removed using a good time intervals (GTI) file, created using a full-field background light curve extracted from the PN camera data. As a result of the applied time filter the total ontime was reduced to 12.8 ks. The same GTI file was used for both the PN and MOS instruments to allow for the direct co-addition of light curves. As a final check for unscreened flares we visually inspected the time filtered full-field light curves for each MOS detector, and no additional flares were observed.
Source spectra and light curves were extracted from circular regions centred on the individual ULXs in each detector. We used a region 16 arcseconds in radius where possible, to enclose as many source counts as possible, whilst minimising the contribution from other components within the galaxies. The encircled energy fraction for such regions is for both MOS and PN detectors. Where cross-contamination was likely due to the close proximity of these and other bright sources, data was extracted from a smaller circular region of 8 or 12 arcseconds in radius (dropping the encircled energy fractions to ; specific details of the regions used for individual sources are discussed below). We selected the best quality data (FLAG = 0) in each case and screened with PATTERN 4 for PN and PATTERN 12 for MOS, with light curves extracted in the 0.3–10.0 keV band. The response and ancillary response files were created automatically by the standard XMM-Newton tasks.
Background spectra and light curves were extracted from circular regions for every source. Regions were identical in size to source data extraction regions for light curves, but larger regions were used for spectra. Every effort was made to position these on the same chip as the source at a similar off-axis angle and distance from the read out nodes, though this was not always possible for the spectral regions. When necessary additional background regions were used to provide background data with average detector characteristics similar to the source data.
3 ULX properties
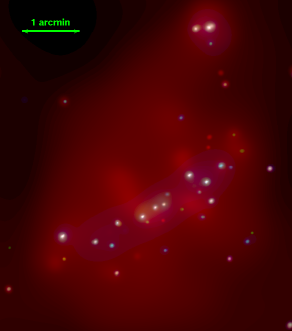
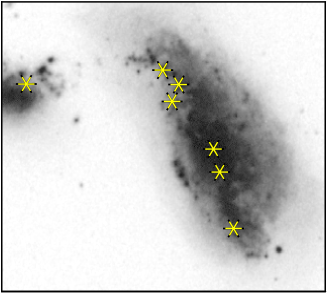
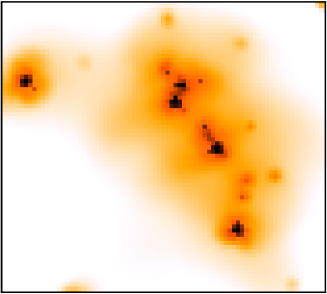
Our source selection was based on the ‘bright’ sample criteria set out by RWWM02, that is to say we selected sources that have observed X-ray luminosities of 1039 erg s-1 and above (i.e. objects ultraluminous in nature). The authors identified a total of six ULXs within these two galaxies that are listed in Table 2. It should be noted that the nomenclature for ULXs used here follows that of RWWM02, who used the official IAU designations for Chandra sources incorporating the source position in J2000 coordinates. Each observation was also checked to identify any previously unobserved ULXs that had emerged since the original study had been carried out. One additional source was found (in observation C3), which we refer to hereafter as CXOU J123038.3+413830 using the above nomenclature222Fridriksson et al. (2008) also noted the emergence of this source and one other possible ULX, CXOU J123035.1+413846. We extracted a spectrum for the latter finding an observed luminosity of 1039 erg s-1 in the 0.3 - 10.0 keV band, so it is not considered further in our analysis.. The seven ULXs (where detected) had ACIS-S/combined EPIC count rates of / count s-1, resulting in counts in total being accumulated per source per observation. We highlight their positions relative to the optical extent of the galaxies using Digitised Sky Survey data, which we display alongside Chandra and XMM-Newton images constructed from the observations studied herein, in Figure 1.
The spectra and light curves for the seven sources were extracted and analysed for each observation, providing their data was sufficiently good to allow spectral analysis. This was only possible for CXOU J123038.3+413830 during observation C3. Conversely CXOU J123029.5+413927 had sufficient data for spectral analysis in all but the XMM-Newton observation (X1). The source spectra and light curves for CXOU J123030.8+413911, CXOU J123029.5+413927 (light curves only) and CXOU J123032.3 +413918 were extracted from X1 using a region of only 8 arcseconds radius due to the close proximity of these three sources to one another. During the X1 observation, CXOU J123030.6+414142 was unfortunately positioned close to a PN chip gap. We therefore used a polygonal region to optimise our extraction of the PN source data. Circular apertures (radius 16 arcseconds) were viable for this source in each MOS detector. Similarly, PN data from CXOU J123042.3+413818 was extracted from a 12 arcsecond radius region due to the proximity of a chip gap, whilst its MOS data was extracted from a full 16 arcsecond radius aperture.
3.1 X-ray spectra
All the ULX X-ray spectra were grouped to a minimum of 20 counts per bin and then fitted using simple (absorbed single component) models in xspec version 11.3.1. The spectral fitting was carried out in the 0.3–10.0 keV range for all instruments. When fitting models to the spectra from XMM-Newton, the PN and MOS data were analysed concurrently to gain the best fit. A constant multiplicative factor was applied to allow for calibration differences between cameras. The PN constant was fixed at unity, whilst the constants for each of the MOS detectors were left as free parameters and, for the majority of sources, they agree to within 10% (larger discrepancies are only present where disparate extraction regions were necessary; see above).
Each model included two absorption components; a fixed column of representing the known absorption column along the line of sight to NGC 4485/4490 in our own Galaxy (from the Leiden, Argentine and Bonn Survey; Kalberia et al 2005), and a second component left free to vary that represents absorption within the host galaxy. These absorption columns were modelled using the tbabs model (Wilms, Allen & McCray 2000). In our initial fits it acted on either a power-law continuum (po in xspec syntax) or a multi-colour disc blackbody model (diskbb; Mitsuda et al. 1984), similar to RWWM02. We did attempt more complicated models, for example two component models such as an absorbed disc + power-law model, but no statistically significant improvement was achieved in the fitting of any of the data, and so they are not discussed any further in this paper.
The results of our fitting for the two models (absorbed power-law continuum and absorbed multi-colour disc blackbody; hereafter referred to as the PL and MCDBB models respectively) are shown in Table 2. This also includes a luminosity for each ULX, the luminosity and its errors were calculated using the best fitting model to the data. For Chandra data this calculation proved straightforward, but for the concurrently fit XMM-Newton data sets we estimated the model flux from the PN data only. As CXOU J123030.6+414142 was unfortunately positioned close to a chip gap in the PN detector, we derived its luminosity using an average of the two MOS detectors. The errors quoted throughout Table 2 are the 90 per cent errors for one interesting parameter.
| Source Name | Obs | TBABS * PO | TBABS * DISKBB | ||||||
|---|---|---|---|---|---|---|---|---|---|
| CXOU | a | / DoF | Luminosityb | a | c | / DoF | Luminosityb | ||
| C1 | 5 | 3.9 | 6.3/10 | 0.9 | 3.0 | 0.8 | 6.4/10 | 0.86 | |
| J123029.5 | X1 | … | … | … | … | … | … | … | … |
| + 413927 | C2 | 3.3 | 2.5 | 33.1/18 | 1.0 | 2.2∗ | 1.3∗ | 38.6/18 | 0.9∗ |
| C3 | 2.1∗ | 2.0∗ | 26.7/13 | 0.7∗ | 1.4∗ | 1.4∗ | 29.0/13 | 0.6∗ | |
| C1 | 0.37 | 1.72 | 61.1/59 | 4.0 | 0.160.05 | 1.4 | 46.8/59 | 3.6 | |
| J123030.6 | X1 | 0.410.1 | 2.10.2 | 35.9/38 | 2.1 | 0.090.08 | 1.2 | 39.5/38 | 1.9 |
| + 414142 | C2 | 0.36 | 2.00.1 | 84.1/66 | 2.4 | 0.14 | 1.20.1 | 77.1/66 | 2.12 |
| C3 | 0.400.07 | 1.87 | 70.2/69 | 2.6 | 0.140.05 | 1.4 | 55.3/69 | 2.2 | |
| C1 | 1.1 | 1.80.3 | 24.2/29 | 2.5 | 0.50.2 | 1.7 | 28.8/29 | 2.3 | |
| J123030.8 | X1 | 1.2 | 1.8 | 28.3/32 | 2.8 | 0.70.2 | 1.6 | 32.2/32 | 2.5 |
| + 413911 | C2 | 2.00.3 | 2.40.2 | 55.9/53 | 2.6 | 1.20.2 | 1.20.1 | 60.5/53 | 2.4 |
| C3 | 1.50.2 | 2.20.2 | 64.4/59 | 2.4 | 0.90.1 | 1.30.1 | 65.5/59 | 2.3 | |
| C1 | 0.60.2 | 1.70.3 | 12.8/21 | 1.7 | 0.3 | 1.5 | 14.2/21 | 1.5 | |
| J123032.3 | X1 | 1.00.1 | 2.20.2 | 57.4/47 | 2.8 | 0.50.1 | 1.20.1 | 47.3/47 | 2.7 |
| + 413918 | C2 | 1.00.2 | 2.00.2 | 72.6/59 | 3.2 | 0.50.1 | 1.4 | 67.0/59 | 2.9 |
| C3 | 0.90.1 | 1.90.1 | 88.1/64 | 2.5 | 0.53 | 1.5 | 83.8/64 | 2.4 | |
| C1 | 0.6 | 1.70.3 | 20.5/22 | 1.7 | 0.30.2 | 1.4 | 23.3/22 | 1.5 | |
| J123036.3 | X1 | 0.58 | 2.06 | 84.7/66 | 2.7 | 0.23 | 1.30.1 | 77.3/66 | 2.6 |
| + 413837 | C2 | 0.8 | 2.5 | 10.7/13 | 0.40 | 0.20.2 | 1.0 | 18.9/13 | 0.39 |
| C2 | 1.30.2 | 2.50.2 | 72.9/62 | 2.1 | 0.70.1 | 1.030.08 | 54.9/62 | 1.94 | |
| C1 | … | … | … | … | … | … | … | … | |
| J123038.3 | X1 | … | … | … | … | … | … | … | … |
| + 413830 | C2 | … | … | … | … | … | … | … | … |
| C3 | 1.8 | 2.6 | 41.5/35 | 1.2 | 1.10.2 | 1.10.1 | 35.8/35 | 1.2 | |
| C1 | 1.30.2 | 2.30.2 | 46.6/40 | 2.91 | 0.8 | 1.20.1 | 38.6/40 | 2.7 | |
| J123043.2 | X1 | 1.1 | 2.70.2 | 59.3/54 | 2.2 | 0.47 | 0.97 | 51.7/54 | 2.1 |
| + 413818 | C2 | 1.30.2 | 2.70.2 | 83.6/58 | 1.9 | 0.70.1 | 0.94 | 68.4/58 | 1.75 |
| C3 | 1.1 | 2.20.1 | 87.2/79 | 3.1 | 0.58 | 1.320.1 | 82.0/79 | 2.9 |
Notes: the data quality was insufficient for spectral fitting in the XMM-Newton observation of CXOU J123029.5+413927. CXOU J123038.3 + 413830 is the new transient source, not previously observed as a ULX, that appears only in the most recent observation. We embolden the /degrees of freedom (DoF) for the best fitting model for each source observation. Specific notes: a Absorption column in units of 1022 atoms cm-2. b Observed luminosity in the 0.5–8.0 keV band in units of 1039erg s-1. c Disc temperature in keV. ∗ The best fitting models to this data gave a reduced greater than 2, therefore we did not place constraints on the parameter errors.
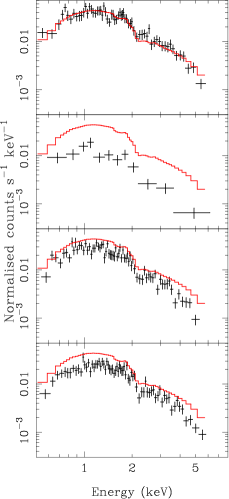
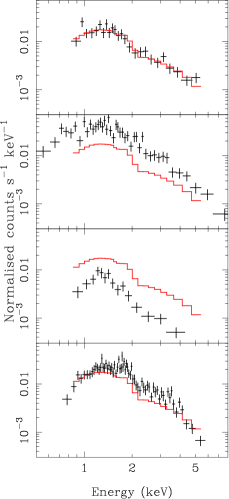
The simple absorbed single component models as shown in Table 2 provide acceptable fits to the majority of the data (model rejection probabilities, based on the fit, of ). Only three best-fits were statistically poor models of the data; both the latter Chandra observations of CXOU J123029.5+413927 (with rejection probabilities of ), and a very marginal rejection of the best fit to CXOU J123032.3+413918 in observation C3 (). We show examples of the spectral quality of our data in Figure 2, where data for two of the ULXs is shown over all four observation epochs. Clearly, the spectra and luminosity of the ULXs vary with time. We discuss this spectral variability further below.
The best-fitting parameters to the models are in the range for the PL model, and keV for the MCDBB model. As these two models are also commonly used to describe Galactic black holes, it is worth considering the comparative fits gained, although caution should be taken when doing this as the different band pass of Chandra to those instruments generally used to study Galactic black holes may be a contributory factor in differing results (see section 4.1 for further discussion). Here we find that the observed values for PL photon index are in most cases a little on the low side for the steep power-law state (a.k.a. very high state) as described by McClintock & Remillard (2006), which is defined by a power-law continuum, and in many cases are similar to the slopes seen in the hard state. However, this range of power-law slopes is very typical for Chandra observations of ULXs (Swartz et al. 2004, Berghea et al. 2008). In a similar vein, the MCDBB inner disc temperatures are generally a little high compared to Galactic black holes in the thermal-dominated (high/soft) state which generally possess disc temperatures keV (although higher temperatures have been seen, particularly in the steep power-law state cf. McClintock & Remillard 2006). They are however very similar to those measured in other ULXs modelled by a MCDBB (e.g. Makishima et al. 2000). The range of spectral properties therefore appear typical of the ULX class in general.333An explicit comparison of our fits to the data from C1, and the published fits from RWWM02, reveal that our parameter values () match very closely. However, there is a trend for our new absorption values to be higher (although in many cases there is reasonable agreement with the previous measurements within the errors). This difference is likely attributable to a combination of considering data below 0.5 keV - which RWWM02 did not - and the improvements in calibration made over the intervening years.
3.1.1 Spectral variability
As the previous section shows, we have multiple detections of the ULXs in the NGC 4485/4490 system, each with sufficient data quality to examine their individual X-ray spectra. This therefore provides an excellent dataset with which to begin to examine the variation in the X-ray spectra of these ULXs over time, as amply demonstrated in Figure 2. In particular, five ULXs have a complete set of spectral fits, i.e. an acceptable - or only marginally rejected - best-fitting spectrum in each epoch, which we base this analysis on. We do not discuss either the new transient ULX CXOU J123038.3+413830 (with only one spectral dataset), or the candidate SNR CXOU J123029.5+413927, in the following work.
A first interesting trend to consider is which models provide a best fit to the data. Initially we consider the best fitting model to be that with the lowest 2/DoF (although in some instances 2 between the models is marginal). On the whole, these ULXs are more frequently better fit by the MCDBB model than the PL model (12/20 datasets). One source is consistently best fitted by each model; CXOU J123030.8+413911 is always better fitted by the PL model, whereas CXOU J123043.2+413818 is better fitted by the MCDBB in the four observations. The other three can all be best fitted by both models in one or more observations. However, one trend appears in these three sources; the PL provides the better fits exclusively at lower observed luminosity, whereas the MCDBB fits to the higher luminosity data. An obvious interpretation of this change in spectral shape is that it could be an indication for a spectral state transition. Given the potential importance of this result, we have investigated it further. As so few of the spectral fits were rejected on the basis of the statistic, the vast majority of fits constitute acceptable interpretations of the data so we could not simply use the statistic to distinguish models. Instead, we turn to Bayesian Information Criterion analysis (Jefferys 1961; Schwarz 1978). This provides a measure of whether one model should be considered a superior description of the data, when compared to another. We calculate values in the range for the majority of our comparisons between models for the same epoch data. This is substantially lower than a value of 2, considered a positive result by the Bayesian Information Criterion (i.e. evidence that one model is superior to the other) (cf. Kass & Raftery 1995). Hence we cannot distinguish which model provides a statistically superior fit to each dataset, so claims that one model clearly provides a better fit than the other cannot be made on the basis of our data.
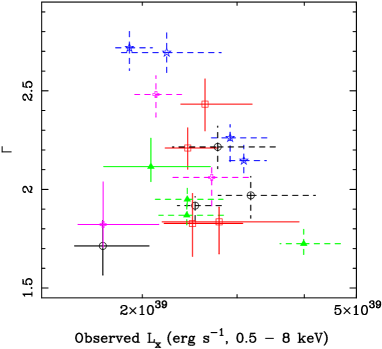
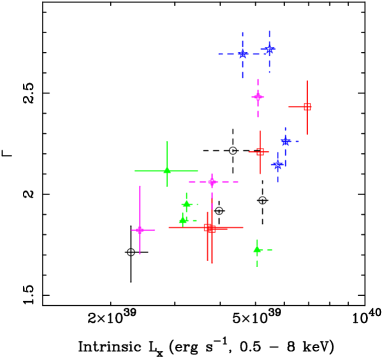
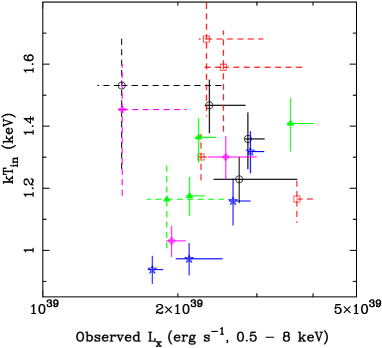
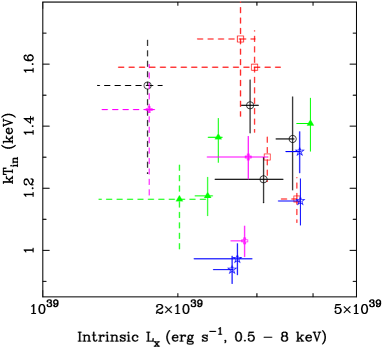
Despite the lack of a strong distinction between the two models in most sources, we do find that the parameterisations of these models vary between observations. This is perhaps not unexpected, given that it is a trend observed in other ULXs (e.g. NGC 2403 Source 3, Isobe et al. 2008). We have investigated this in Figure 3, where we plot the derived parameters for each model (the power-law photon index , and the inner accretion disc temperature , as listed in Table 2) against the 0.5–8 keV luminosity of the source derived from that model. We show this for both the observed luminosity, and for an intrinsic luminosity calculated in the same band by simply setting the absorption acting on the model to zero. In each plot we show the data points for which that model is the better fitting by solid error lines, and use dashed errors for the worse fitting model. Each separate ULX is distinguished via individual colours and symbols (see the Figure caption for a key). The Figure is plotted showing errors on the source parameters; clearly there are statistically significant changes in luminosity and/or parameterisation for each source over the course of our observations.
What is immediately obvious from comparing the two pairs of panels in Figure 3 is that the models react rather differently to the removal of an absorption column. The removal of an absorption column for the MCDBB model leads to little movement in the relative positions of the data points, only a general movement to higher luminosities (with the latter as would be expected from correcting to an intrinsic luminosity). However, the power-law continuum data points react rather more dramatically, with the data with softer intrinsic slopes (higher values of ) having a much larger apparent correction from observed to intrinsic luminosity than those data with harder slopes. This is rather well-demonstrated by the data for CXOU J123030.8+413911 (red squares, the only source always best-fitted by the power-law model), which appears to vary its spectral slope with little or no contemporaneous change in observed luminosity; however when the correction is made for the modelled absorption, it show a clear trend of becoming softer as its luminosity increases. A pertinent question is therefore whether this latter relationship is a physically correct interpretation of the data, or whether this is some sort of artefact of the fitting process.
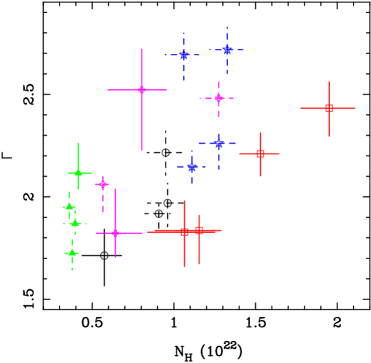
We have examined this question by plotting the best fitting values of the power-law photon index against the fitted absorption column density in Figure 4 . If there were no relation between the two one would see a simple scatter plot, with the column independent of the power-law slope. However, at least in the case of CXOU J123030.8+413911, the measured column density is clearly increasing concurrently with . This suggests that one of two scenarios is occuring: either there is a physically real increase in absorbing column, local to the ULX, that occurs simultaneously with a steepening of the spectral slope and increase in intrinsic luminosity; or that the spectral fitting process is artificially inferring higher columns that go hand-in-hand with steeper slopes in some observations. The latter is not so far-fetched; as the column is inferred from the low-energy turn-over of the power-law spectrum, one might expect some degeneracy between the slope being turned over and the amount of material required to produce the turn-over, particularly within the limited band-pass of the Chandra data where we see few data points above 5 keV to really constrain the slope of the power-law tail (cf. Figure 2).
The other four sources all behave somewhat differently to CXOU J123030.8+413911. Two sources - CXOU J123030.6+414142 and CXOU J123043.2+413818, plotted in Figures 3 & 4 as green triangles and blue stars respectively - appear to consistently harden their spectra as their luminosity increases. Interestingly these two sources are predominantly better fit by a MCDBB model (albeit with the caveats discussed above about distinguishing the models), and we note that this behaviour is quite consistent with accretion discs becoming hotter as their luminosity increases, as is seen in Galactic black hole X-ray binaries444Indeed, standard accretion disc spectra are known to show a relationship of , e.g. Done, Gierliński & Kubota (2007).. On the other hand, the behaviour of the remaining two sources is less clear cut. CXOU J123032.3+413918 (plotted as black circles) is mainly better fit by a MCDBB model; in this model it appears not to vary substantially (less than , with large errors) in luminosity or disc temperature, but when better fit by a power-law model it appears slightly harder in spectrum (although again with large errors). CXOU J123036.3+413837 behaves similarly - again it appears harder in the power-law state than when it possesses a MCDBB-dominated spectrum, although in this case there is a wider difference in the parameters of the data points for the MCDBB spectrum. Interestingly, though, these two disc-dominated spectra appear to follow the same more luminous/harder trend as CXOU J123030.6+414142 and CXOU J123043.2+413818. So, although we are unable to strictly distinguish which model provides the preferable fit to the data, it does appear as though those sources slightly better fitted by a MCDBB model are behaving in a fashion consistent with that expected of sources dominated by an accretion disc. We discuss this interesting result further in the next section.
3.2 Short-term X-ray variability
Following the method of RWWM02, light curves for each source observation were binned to 25 and 100 counts per bin to allow simple tests on variability to be carried out. Initially these tests were performed by fitting the background-subtracted light curves to a constant flux (the average for that observation) then examining the fit with a 2 test. It was necessary to cut the (co-added PN and MOS) light curves in two to remove a large flaring event from the observation, therefore the XMM-Newton data initially provides two light curves for each source. As a further test the XMM-Newton light curves were reassembled (excluding the flaring event) and the light curves were re-tested. A separate test on the light curves was carried out by investigating the excess variance of each dataset. However, no statistical signs of short-term variability were detected by any test in any light curve. We note that none of the seven ULXs we have in common with the work of Fridriksson et al. (2008) showed short-term variability in their analysis either, when tested using a one-sided Kolmogorov-Smirnov test.


3.3 Long-term X-ray variability
Fridriksson et al. (2008) examine the long-term variability of the ULXs in NGC 4485/4490, and detect significant flux variability in all but one of the ULXs (that one being CXOU J123030.8+413911). Here we also derive long-term light curves, albeit using generally more conservative techniques, which we present in Figures 5 and 6. We expand on the long-term lightcurves presented in RWWM02 (based on ROSAT data, and Chandra data from observation C1 alone), which we limit to the 0.5 - 2 keV band as this is the only band in common for all the instruments. The luminosities we quote are therefore generally lower than seen elsewhere. We also include limits where sources are undetected (calculated as per RWWM02). Finally, we display the 1 errors for the luminosities derived from spectral modelling of the Chandra and XMM-Newton data (the errors on the ROSAT data are more standard counting errors, due to the lack of spectral information in this data).
Long-term light curves for the six previously-known ULXs are shown in Figure 5, which is a simple extension of Figure 5 in RWWM02. The light curve for the new transient ULX (CXOU J123038.3+413830) is in Figure 6, and shows it would have been clearly detectable in earlier ROSAT PSPC, Chandra and XMM-Newton data. Of the other ULXs, CXOU J123030.8+413911 was itself deemed a transient in RWWM02 due to its non-detection by ROSAT; however it has apparently remained in outburst at roughly the same flux level in observations spanning yrs after its discovery. The flux of CXOU J123043.2+413818 has remained similarly stable, though this is over a longer yr timescale. At first glance this may appear to contrast with the findings of Fridriksson et al. (2008), but this difference is predominantly due to bandpass selection. They note significant variations in hard colour that by their definition covers the 1–7 keV band; we however consider the 0.5–2.0 keV band common to all instruments contributing data. To further test our result, we apply the same significance parameter (Sflux) used by the authors. They define a source as variable if Sflux 3. We find that Sflux 1.3 for CXOU J123043.2+413818, confirming the lack of variability. The three other brighter ULXs have displayed higher variability amplitudes over the yrs covered by the observations, though have remained detectable throughout this time (CXOU J123030.6+414152, Sflux 6.2; CXOU J123032.3+413918, Sflux 3.6; CXOU J123036.3+413837, Sflux 12.2). We discuss the remaining source (CXOU J123029.5+413927) below in section 4.2.

4 Discussion
4.1 Spectral state changes in ULXs?
In the previous section we have considered the properties of the ULXs separately. We show that most are adequately fitted by two simple spectral models (a power-law continuum or a MCDBB). Although there are apparent trends (based on a superior fit) in the best fitting model to the data with the luminosity of the ULX at a given epoch, we show that statistically we cannot distinguish a best fitting model on this basis alone. Interestingly, though, the best fitting parameters do give some support to the initial distinction based on the fit - those models better fitted by a MCDBB do appear to behave in a way consistent with this (increasing in disc temperature as their luminosity increases). No temporal variability is evident on short (intra-observation) timescales for any source contained within NGC 4485/4490. However, strong variability is seen over longer ( years) time scales in most of the ULXs.
When we consider the spectral and temporal behaviour of the ULXs together, we find that these ULXs appear rather heterogeneous, an unsurprising result given previous multi-epoch observations (e.g. Fabbiano et al. 2003a, Roberts et al. 2004, Zezas 2007). We initially consider only the five sources discussed in section 3.1.1, examining both the long-term light curves and spectral variability of each source to see if and how they are related. We find that the two sources remaining constant in their long-term light curves display very different spectral evolution behaviours over time. We find that CXOU J123043.2+413818 follows a similar spectral evolution to a disc, loosely following on the parameter-luminosity plot, whilst CXOU J123030.8+413911 appears to show the opposite trend, with decreasing as the luminosity increases. Although we cannot statistically separate model preference, it is interesting to note that each source is consistently better fitted by a particular model. While CXOU J123043.2+413818 varies in a disc-like manner, it also retains a lower 2 fit for MCD, whilst CXOU J123030.8+413911 is better fitted by a PL-type shape. We reiterate that we cannot offer a statistical distinction between these two models for either source, but suggest that this secondary evidence supports the initial distinction made by fits.
More interestingly, we find that the spectral fits to the other three sources, CXOU J123030.6+414142, CXOU J123032.3+413918 and CXOU J123036.3+413837, appear to show them transiting between these two models, which could potentially be used as a test of our secondary evidence. If we consider their changing spectral behaviour we find that those observations better modelled by a MCDBB appear to vary in a disc-like fashion in the majority of cases, while those modelled by a PL tend to leave the track. We also note that the long-term light curves of each of these sources vary substantially; crucially these flux variations correlate with apparent spectral state, with observations at low luminosities appearing to possess a PL-type shape, with spectra switching to a MCDBB-type state at higher luminosities. Again, despite the lack of statistical evidence for a distinction between the models, this behaviour does appear to support the fitting. If we do accept the changes in spectral shape, then the most obvious explanation of the behaviour of the ULXs is that they can reside in different spectral states, delineated by the PL and MCD spectra, and that in some cases we are observing sources that have undergone a transition from a PL-Type to MCD-type state (or vice-versa). As this is an extremely interesting result, we now consider the physical implications of such behaviour on our understanding of these systems.
A further reason the think that there may be some physical basis for the two spectral types we see in the NGC 4485/4490 ULXs is that they have been seen in other ULXs before. Mizuno et al. (2007) suggested (based on observations of two ULXs in NGC 1313) that the PL-type state may be representative of the very high state observed in Galactic black hole X-ray binary systems, whilst the MCDBB-type state may be more suggestive of the theoretically predicted “slim disc” model (e.g Watarai et al. 2001). The latter is supported by observations fit by the -free model (e.g. Vierdayanti et al. 2006). The -free model assumes that the disc temperature scales as , where is the radius and is a free parameter. In the case of a standard disc the value of would be fixed at 0.75 but if the -value decreases, softer energies become more enhanced, and the spectrum becomes more representative of a slim disc. In the case of the MCDBB-type spectra of M81 X-9, the best fitting parameters reduce the -value to 0.6, significantly smaller than a standard disc value (Miyawaki et al. 2006), supporting the existence of an ultraluminous slim disc state. Kuncic et al. (2007) made similar associations for the PL-type state, but suggested that this could also be representative of a system with some kind of outflow. The authors did this by demonstrating that a disc modified with jet emission could also explain the observed spectral shape. Soria & Kuncic (2008) developed this work further, presenting the idea that the PL-type state could be explained by a black hole in the hard state with an associated jet that persisted up to Eddington rates, where an outflow-dominated or a slim disc state would be formed. This allows for the possibility of direct transition from a hard PL-type state to a super-Eddington state.
The suspected change in state that we observe is consistent with those found previously and we argue that, although the PL-like spectrum observed appears similar to that of an accreting black hole in the low/hard state, we are probably observing sources residing in the very high state (VHS; a.k.a. steep power-law state, McClintock & Remillard 2006). The spectrum of the VHS is empirically characterised by a hot disc and a steep power-law in the 2.0–20.0 keV band. It should be noted that the power-law component is used as a proxy to describe optically-thin Comptonisation, however a spectrum resulting from this process is subtly curved with a shallower slope at lower energies. Here we observe only the lower 0.3–10.0 keV energy range, although the relatively poor high energy sensitivity of the Chandra ACIS-S means we only have constraints up to 5 keV. Hence we observe only the shallower section of the Comptonised component. This should then also be combined with emission from the 1–2 keV disc component seen in the VHS (although data quality is insufficient at present to separate these components). This amalgamation of components could potentially act to flatten the slope of the spectrum below 5 keV, resulting in the range of power-law photon indices observed. As the mass accretion rate (and so the observed luminosity) is increased, it is likely that a change in the accretion structure of the system occurs that invokes a change in spectrum to the MCDBB-like state. The observed curvilinear structure of such a state would be representative (in our modest spectral quality regime) of a slim disc, or an optically-thick Comptonising corona masking the inner radii of the disc (Done & Kubota 2006; Stobbart et al. 2006). We note that in each of these model scenarios the disc temperature increases with luminosity (Roberts et al. 2006; Vierdayanti et al. 2008).
The detection of this possible change in state (from PL to MCDBB-type or vice-versa) has previously been noted in other ULX studies. The clearest transition to date was reported in M81 X-9 by Miyawaki et al. (2006), with a transitional luminosity of 1.51040 erg s-1. Multiple spectra of NGC 1313 Source B were also analysed by the authors but results in this case were not as clear as M81 X-9. The tendency towards MCDBB-like spectra with increasing luminosity was apparent, although a precise transition was not evident, occuring within the range 1039 erg s-1. Similar transitions, from a PL-type state to a MCDBB-type state, have also occured in IC 342 X-1 and X-2 at around 1040 erg s-1 (although with only two observations analysed, it is impossible to give a precise transition luminosity; Kubota et al. 2001).
Soria & Kuncic (2008) proposed that the transition between states would occur at around the Eddington limit, if we assume little beaming. Based on this proposition the observations reported here provide a potential diagnostic to these systems. allowing us to place constraints on the masses of the black holes contained within the ULXs in NGC 4485/4490. Firstly we note that it is certainly not necessary to invoke an intermediate mass black hole to achieve the observed luminosities of these systems ( 41039 erg s-1), indicating that these sources need be no more than large stellar-mass compact objects ( if they obey the Eddington limit). Secondly, if this apparent state change is occurring at the Eddington limit, the luminosity at which a transition is observed would give a rough estimate on the mass of the system. Although we cannot observe a distinct change in state at this level of data quality, the variable ULXs in NGC 4485/4490 appear to change state at 21039 erg s-1, which would mean that these systems are host to 10–15 M⊙ black holes, i.e. standard stellar-mass black holes. Following this argument CXOU J123030.8+413911, which continues to reside in the PL-type state up to a luminosity of 2.81039 erg s-1, could therefore contain a more massive black hole. Interestingly, if we were to extrapolate this argument to other sources where transitions have been reported, with observed transitional luminosities ranging from 2–151039 erg s-1 (including our current sample), the primaries of ULXs would range in mass up to no more than 100 (M81 X-9, in agreement with Tsunoda et al 2006).
The implications of this argument are in agreement with evidence emerging from other observations of ULXs, a review of which was compiled by Roberts (2007). For example, when high quality X-ray spectra are available, a break emerges above 2 keV (Stobbart et al. 2006), which should not be present in the X-ray spectrum of large, intermediate-mass black holes. This feature is more indicative of some form of extreme accretion onto a smaller compact object. Optical evidence also appears to be converging on similar mass estimates, for example irradiation models describing the optical emission of ULXs have been used to constrain the mass of the black hole for several sources, generally imposing the limit MBH 100 M⊙ (Copperwheat et al. 2007). Recent developments in theory have shown that it is possible to create black holes with MBH 100 M⊙, in young stellar populations with either low metallicity stars (Fryer & Kalogera 2001, Heger et al. 2003), or with the merging of binaries (Belczynski et al. 2006). With evidence from both observation and theory converging on large stellar-mass objects, timely evidence came when Prestwich et al. (2007) found such an object. Repeated optical exposures of the Wolf-Rayet black hole binary known as IC10 X-1 culminated in a radial velocity curve, providing a primary mass estimate of 23–34 , the largest stellar-mass black hole found to date (see also Silverman & Filippenko 2008). Hence it is looking an increasingly realistic proposition that a large fraction of the ULX population are powered by black holes not substantially larger than those we already know of in our own Galaxy.
4.2 The candidate SNR CXOU J123029.5+413927
CXOU J123029.5+413927 was identified as a possible supernova remnant due to its high absorption column, soft underlying continuum and its coincidence with the radio source FIRST J12309.4+413927 (RWWM02). Mid-infrared studies of NGC 4485/4490, carried out by Vázquez et al. (2007) using the Spitzer Space Telescope, found that five of the ULXs showed high ionization features that are found in AGN. Conversely the mid IR spectrum of CXOU J123029.5+413927 showed emission more indicative of star forming regions. This, with the addition of a weakly detected [OVI] 25.91 m emission line, a line that is recognised as a strong feature in SNRs (Morris et al. 2006; Williams et al. 2006), supports the previous classification. If it is a SNR then it is obviously amongst the brightest of its class - X-ray luminosities in excess of erg s-1 are seen in a number of young SNRs (Immler & Lewin 2003), although typical older SNRs are 2 - 3 orders of magnitude fainter in X-rays (e.g. Pannuti et al. 2007). However, in contrast to previous evidence, analysis by Fridriksson et al. (2008) reported a 30% drop in luminosity for this source in the four months between the second and third Chandra observations, behaviour that is more typical of an X-ray binary source.
A compelling argument on the nature of this source is discovered when looking at the light curve of this source. We find that previous observations place its detonation (or at least the epoch at which its X-ray emission brightened) some time after the 1991 ROSAT observation, which would imply that we may be observing a very young SNR. The calculated rate of decay of X-ray flux within the light curve gives further insight. Studies performed using data from early X-ray telescope missions showed that this decay proceeds as with index (e.g. Chevalier & Fransson 1994); however the flux and temperature calculations performed in these earlier studies could have been contaminated by diffuse emission due to the poorer resolution of these satellites. More recent studies with Chandra and XMM-Newton have demonstrated that the decay observed within the light curve of a young SNR has an index (e.g. t-2.7 in Immler & Kuntz 2005, t-3 in Temple, Raychaudhury & Stevens 2005, t-3.9 in Aretxaga et al. 1999). The rate of decay observed in the light curve of CXOU J123029.5+413927 is found to be , a decay rate that is far shallower than young SNRs. Therefore this source could simply be an X-ray binary system, as suggested by Fridriksson et al. (2008). An alternative to this could be a young SNR with an additional roughly constant component, diluting the emission and affecting the observed decay rate. This component could be an X-ray binary system, although it is notable that it hasn’t produced the high ionisation nebulae as seen around the other ULXs in NGC 4490 by Vázquez et al. (2007). Much deeper observations would be required in order to test either hypothesis.
5 Conclusions
Multiple observations of the interacting galaxies NGC 4485 & 4490 have afforded us the opportunity to study its large ULX population, and in particular to see how their emission evolves over time. We have found that the population is unanimous in its lack of short-term temporal variability, but long-term spectral and temporal variations have given a possible insight into the mass of black holes contained within them. Observations have revealed that sources exhibiting large scale temporal variation (excluding CXOU J123029.5+413927) may change spectral shape from that of a PL-type to a MCDBB-type as their luminosity increases. If real - and there is some uncertainty here, as we cannot strongly differentiate between fits with PL and MCDBB models based on the current data – this change in spectral shape/state occurs at erg s-1 for the ULXs in this system. We propose that this state change is from the VHS to an ultraluminous state, a transition that occurs at around the Eddington limit. If this is the case it would imply that the majority of the ULX population residing in this interacting galaxy pair are stellar-mass black holes of around 10–15 .
The analysis of the possible spectral transitions has culminated in a testable hypothesis that can potentially be applied to other ultraluminous X-ray sources, for example the newly observed transient source CXOU J123038.3+413830. This object has only been observed once to date and so it is impossible to tell at present any more than its current preferred state, a MCD-type state. The observed luminosity of this source is much lower than the transitional luminosity noted for the majority of sources in our current source population. Extrapolating from our above arguments would suggest that this system contains a compact object of lower mass. Further observations are obviously required to constrain the nature of this source and indeed to continue our study of the behaviour of the whole ULX population of NGC 4485/4490. Fortunately, this will be possible using time allocated to us on XMM-Newton. The resulting data set – to be reported in a follow-up paper – will help us delve deeper into the nature of the remarkable ULX population residing in these galaxies.
Acknowledgements
We thank the anonymous referee for their constructive comments, that have helped to improve this paper. JCG gratefully acknowledges funding from the Science and Technology Facilities Council (STFC) in the form of a PhD studentship. This work is mainly based on data from the Chandra satellite, which is operated by the National Aeronautics and Space Administration (NASA). It is also partially based on observations obtained with XMM-Newton, an ESA Science Mission with instruments and contributions directly funded by ESA member states and the USA (NASA). The Digitized Sky Surveys were produced at the Space Telescope Science Institute under U.S. Government grant NAG W-2166. The images of these surveys are based on photographic data obtained using the Oschin Schmidt Telescope on Palomar Mountain and the UK Schmidt Telescope. The plates were processed into the present compressed digital form with the permission of these institutions. The National Geographic Society - Palomar Observatory Sky Atlas (POSS-I) was made by the California Institute of Technology with grants from the National Geographic Society. The Second Palomar Observatory Sky Survey (POSS-II) was made by the California Institute of Technology with funds from the National Science Foundation, the National Geographic Society, the Sloan Foundation, the Samuel Oschin Foundation, and the Eastman Kodak Corporation. The Oschin Schmidt Telescope is operated by the California Institute of Technology and Palomar Observatory. The UK Schmidt Telescope was operated by the Royal Observatory Edinburgh, with funding from the UK Science and Engineering Research Council (later the UK Particle Physics and Astronomy Research Council), until 1988 June, and thereafter by the Anglo-Australian Observatory. The blue plates of the southern Sky Atlas and its Equatorial Extension (together known as the SERC-J), as well as the Equatorial Red (ER), and the Second Epoch [red] Survey (SES) were all taken with the UK Schmidt. Supplemental funding for sky-survey work at the ST ScI is provided by the European Southern Observatory.
References
- [\citeauthoryearAretxaga et al.1999] Aretxaga I., Benetti S., Terlevich R. J., Fabian A. C., Cappellaro E., Turatto M., della Valle M., 1999, MNRAS, 309, 343
- [\citeauthoryearBelczynski et al.2006] Belczynski K., Sadowski A., Rasio F. A., Bulik T., 2006, ApJ, 650, 303
- [\citeauthoryearBerghea et al.2008] Berghea C.T., Weaver K. A., Colbert E. J. M., Roberts T. P., 2008, ApJ, 687, 471
- [\citeauthoryearChevalier & Fransson1994] Chevalier R. A., Fransson C., 1994, ApJ, 420, 268
- [\citeauthoryearColbert & Mushotzky1999] Colbert E. J. M., Mushotzky R. F., 1999, ApJ, 519, 89
- [\citeauthoryearCopperwheat et al.2007] Copperwheat C., Cropper M., Soria R., Wu K., 2007, MNRAS, 376, 1407
- [\citeauthoryearDewangan et al.2004] Dewangan, G. C., Miyaji, T., Griffiths, R. E., & Lehmann, I. 2004, ApJL, 608, L57
- [\citeauthoryearDone, Gierliński, & Kubota2007] Done C., Gierliński M., Kubota A., 2007, A&ARv, 15, 1
- [\citeauthoryearDone & Kubota2006] Done C., Kubota A., 2006, MNRAS, 371, 1216
- [\citeauthoryearEbisuzaki et al.2001] Ebisuzaki, T., et al. 2001, ApJL, 562, L19
- [\citeauthoryearFabbiano1989] Fabbiano, G. 1989, ARA&A, 27, 87
- [\citeauthoryearFabbiano et al.2003] Fabbiano G., Zezas A., King A. R., Ponman T. J., Rots A., Schweizer F., 2003, ApJ, 584, L5
- [\citeauthoryearFabbiano et al.2003] Fabbiano G., et al., 2003a, AAS, 35, 1409
- [\citeauthoryearFridriksson et al.2008] Fridriksson J. K., Homan J., Lewin W. H. G., Kong A. K. H., Pooley D., 2008, ApJS, 177, 465
- [\citeauthoryearFeng & Kaaret2005] Feng H., Kaaret P., 2005, ApJ, 633, 1052
- [\citeauthoryearFeng & Kaaret2007] Feng H., Kaaret P., 2007, ApJ, 660, L113
- [\citeauthoryearFryer & Kalogera2001] Fryer C. L., Kalogera V., 2001, ApJ, 554, 548
- [\citeauthoryearGonçalves & Soria2006] Gonçalves A. C., Soria R., 2006, MNRAS, 371, 673
- [\citeauthoryearHeger et al.2003] Heger A., Fryer C. L., Woosley S. E., Langer N., Hartmann D. H., 2003, ApJ, 591, 288
- [\citeauthoryearImmler & Kuntz2005] Immler S., Kuntz K. D., 2005, ApJ, 632, L99
- [\citeauthoryearImmler & Lewin2003] Immler S., Lewin W. H. G., 2003, LNP, 598, 91
- [\citeauthoryearIsobe et al.2009] Isobe N., et al., 2009, PASJ, 61, 279
- [\citeauthoryearJeffreys1961] Jeffreys H., 1961, “Theory of Probability”, Oxford University Press, Oxford
- [\citeauthoryearKass & Raftery1995] Kass R.E., Raftery A.E., 1995, Journal of American Statistical Association, 90, 773
- [\citeauthoryearKalberla et al.2005] Kalberla P. M. W., Burton W. B., Hartmann D., Arnal E. M., Bajaja E., Morras R., Poeppel W. G. L., 2005, yCat, 8076, 0
- [\citeauthoryearKubota et al.2001] Kubota A., Mizuno T., Makishima K., Fukazawa Y., Kotoku J., Ohnishi T., Tashiro M., 2001, ApJ, 547, L119
- [\citeauthoryearKuncic et al.2007] Kuncic Z., Soria R., Hung C. K., Freeland M. C., Bicknell G. V., 2006, in:“Black Holes: from Stars to Galaxies - across the Range of Masses” (Proceedings of the 238th Symposium of the IAU, 2006), eds Karas, V., Matt, G., Cambridge University Press, Cambridge, 2007., pp.247-250
- [\citeauthoryearLiu, Bregman, & Irwin2006] Liu J. F., Bregman J. N., Irwin J., 2006, ApJ, 642, 171
- [\citeauthoryearMakishima et al.2000] Makishima K., et al., 2000, ApJ, 535, 632
- [\citeauthoryearMadau & Rees2001] Madau, P., Rees, M. J. 2001, ApJL, 551, L27
- [\citeauthoryearMcClintock & Remillard2006] McClintock J.E., Remillard R.A., 2006. in: “Compact Stellar X-ray Sources”, eds. Lewin W.H.G. and va der Klis M., Cambridge University Press, Cambridge, p. 157
- [\citeauthoryearMcHardy et al.2006] McHardy I. M., Koerding E., Knigge C., Uttley P., Fender R. P., 2006, Natur, 444, 730
- [\citeauthoryearMiller et al.2003] Miller, J. M., Fabbiano, G., Miller, M. C., & Fabian, A. C., 2003, ApJ, 585, L37
- [\citeauthoryearMiller et al.2004a] Miller, J. M., Fabian, A. C., & Miller, M. C., 2004, ApJ, 607, 931
- [\citeauthoryearMiller et al.2004b] Miller, J. M., Zezas, A., Fabbiano, G., & Schweizer, F., 2004, ApJ, 609, 728
- [\citeauthoryearMitsuda et al.1984] Mitsuda K., et al., 1984, PASJ, 36, 741
- [\citeauthoryearMiyawaki et al.2006] Miyawaki R., Sugiho M., Kubota A., Makishima K., Namiki M., Tanaka T., Tsunoda N., 2006, in: Proceedings of The X-ray Universe 2005, eds. Wilson, A., ESA Publications Division, ESTEC, Noordwijk, p.433
- [\citeauthoryearMizuno et al.2007] Mizuno T., et al., 2007, PThPS, 169, 229
- [\citeauthoryearMorris et al.2006] Morris P. W., Stolovy S., Wachter S., Noriega-Crespo A., Pannuti T. G., Hoard D. W., 2006, ApJ, 640, L179
- [\citeauthoryearMorrison & McCammon1983] Morrison R., McCammon D., 1983, ApJ, 270, 119
- [\citeauthoryearPannuti, Schlegel, & Lacey2007] Pannuti T. G., Schlegel E. M., Lacey C. K., 2007, AJ, 133, 1361
- [\citeauthoryearPrestwich et al.2007] Prestwich A. H., et al., 2007, ApJ, 669, L21
- [\citeauthoryearRoberts et al.2002] Roberts T. P., Warwick R. S., Ward M. J., Murray S. S., 2002, MNRAS, 337, 677
- [\citeauthoryearRoberts et al.2004] Roberts T. P., Warwick R. S., Ward M. J., Goad M. R., 2004, MNRAS, 349, 1193
- [\citeauthoryearRoberts et al.2006] Roberts, T. P., Kilgard, R. E., Warwick, R. S., Goad, M. R., & Ward, M. J. 2006, MNRAS, 371, 1877
- [\citeauthoryearRoberts2007] Roberts T. P., 2007, Ap&SS, 311, 203
- [\citeauthoryearSchwarz1978] Schwarz G., 1978, Annals of Statistics, 6, 461
- [\citeauthoryearSilverman & Filippenko2008] Silverman J. M., Filippenko A. V., 2008, ApJ, 678, L17
- [\citeauthoryearSoria et al.2004] Soria R., Motch C., Read A. M., Stevens I. R., 2004, A&A, 423, 955
- [\citeauthoryearSoria & Kuncic2008] Soria R., Kuncic Z., 2008, AdSpR, 42, 517
- [\citeauthoryearStobbart, Roberts, & Wilms2006] Stobbart A.-M., Roberts T. P., Wilms J., 2006, MNRAS, 368, 397
- [\citeauthoryearSwartz et al.2004] Swartz D. A., Ghosh K. K., Tennant A. F., Wu K., 2004, ApJS, 154, 519
- [\citeauthoryearTemple, Raychaudhury, & Stevens2005] Temple R. F., Raychaudhury S., Stevens I. R., 2005, MNRAS, 362, 581
- [\citeauthoryearTsunoda et al.2006] Tsunoda N., Kubota A., Namiki M., Sugiho M., Kawabata K., Makishima K., 2006, PASJ, 58, 1081
- [\citeauthoryearVázquez et al.2007] Vázquez G. A., Hornschemeier A. E., Colbert E., Roberts T. P., Ward M. J., Malhotra S., 2007, ApJ, 658, L21
- [\citeauthoryearVierdayanti et al.2006] Vierdayanti K., Mineshige S., Ebisawa K., Kawaguchi T., 2006, PASJ, 58, 915
- [\citeauthoryearVierdayanti, Watarai, & Mineshige2008] Vierdayanti K., Watarai K.-Y., Mineshige S., 2008, PASJ, 60, 653
- [\citeauthoryearWatarai, Mizuno, & Mineshige2001] Watarai K., Mizuno T., Mineshige S., 2001, ApJ, 549, L77
- [\citeauthoryearWilliams, Chu, & Gruendl2006] Williams R. M., Chu Y.-H., Gruendl R., 2006, AJ, 132, 1877
- [\citeauthoryearWilms, Allen & McCray2000] Wilms J., Allen A., McCray R., 2000, ApJ, 542, 914
- [\citeauthoryearZezas et al.2007] Zezas A., Fabbiano G., Baldi A., Schweizer F., King A. R., Rots A. H., Ponman T. J., 2007, ApJ, 661, 135