Mass Segregation in NGC 2298: limits on the presence of an Intermediate Mass Black Hole 111Based on observations made with the NASA/ESA Hubble Space Telescope, obtained at the Space Telescope Science Institute, which is operated by the Association of Universities for Research in Astronomy, Inc., under NASA contract NAS 5-26555. This paper is associated with program #11284.
Abstract
Theoretical investigations have suggested the presence of Intermediate Mass Black Holes (IMBHs, with masses in the range) in the cores of some Globular Clusters (GCs). In this paper we present the first application of a new technique to determine the presence or absence of a central IMBH in globular clusters that have reached energy equipartition via two-body relaxation. The method is based on the measurement of the radial profile for the average mass of stars in the system, using the fact that a quenching of mass segregation is expected when an IMBH is present. Here we measure the radial profile of mass segregation using main-sequence stars for the globular cluster NGC 2298 from resolved source photometry based on HST-ACS data. NGC 2298 is one of the smallest galactic globular clusters, thus not only it is dynamically relaxed but also a single ACS field of view extends to about twice its half-light radius, providing optimal radial coverage. The observations are compared to expectations from direct N-body simulations of the dynamics of star clusters with and without an IMBH. The mass segregation profile for NGC 2298 is quantitatively matched to that inferred from simulations without a central massive object over all the radial range probed by the observations, that is from the center to about two half-mass radii. Profiles from simulations containing an IMBH more massive than (depending on the assumed total mass of NGC 2298) are instead inconsistent with the data at about confidence, irrespective of the IMF and binary fraction chosen for these runs. Our finding is consistent with the currently favored formation scenarios for IMBHs in GCs, which are not likely to apply to NGC2298 due to its modest total mass. While providing a null result in the quest of detecting a central black hole in globular clusters, the data-model comparison carried out here demonstrates the feasibility of the method which can also be applied to other globular clusters with resolved photometry in their cores.
1 Introduction
Intermediate Mass Black Holes (IMBHs — with masses of order to ) have been suggested to form in the cores of young star clusters (e.g., see Portegies Zwart et al., 2004) and in dense globular clusters (Miller & Hamilton, 2002). Possible observable features related to these objects such as shallow cusps in the density and velocity dispersion profile of the cluster stars were proposed early on (e.g. see the seminal paper of Frank & Rees 1976 and van der Marel 2004; Miller & Colbert 2004 for a review). Cuspy central Surface Brightness Profiles (SBPs) have now actually been observed in HST data on a sizable fraction of GCs (Noyola & Gebhardt, 2006), but it is unclear if they are directly related to IMBHs. Detections based on the analysis of line-of-sight velocity data have been made but the evidence does not appear to be conclusive (see the introductory discussion in Gill et al. 2008). For example, a paradigmatic case is that of the much debated detection of a black hole in the extragalactic cluster (see Gebhardt et al., 2002; Baumgardt et al., 2003; Gebhardt et al., 2005; Trudolyubov & Priedhorsky, 2004; Ulvestad et al., 2007).
Ideally a direct unambiguous detection of an IMBH is possible in GCs by measuring orbits of stars bound to the BH, which would also allow a precise measurement of the central mass. Present-day HST imaging capability has the accuracy required for this kind of observation but a significant investment of time spread over multiple epochs is required. It is therefore necessary to find preliminary criteria to narrow down the list of candidate GCs for focused follow-up observations.
In this paper we apply to NGC 2298 a new method we recently proposed for assessing the presence of an IMBH (see Gill et al., 2008). The idea is to quantify the amount of mass segregation present in a collisionally well-relaxed stellar system, that is with a half-light two-body relaxation time below one billion years. We have shown through direct N-body simulations that the presence of an IMBH heavily affects mass segregation of stars in a GC. Systems hosting an IMBH develop a low degree of mass segregation, as opposed to IMBH-free GCs in which more massive stars move preferentially towards the center of the cluster over a relaxation timescale. The presence of the IMBH tends to equalize the velocity dispersions of all stellar mass components in the system, thus reducing radial mass segregation. Note that the method we propose is not applicable to the most massive galactic globular clusters such as and Centauri, because their two-body relaxation time is too long and the amount of observed mass segregation does not necessarily reflect its long term equilibrium value. Our investigation thus aims to cover a different region of galactic GC parameter space compared to the one explored by current claims of GCs IMBH detection such as Gebhardt et al. (2002) and Noyola et al. (2008).
The radial profile for mass segregation in main-sequence (hereafter MS) stars can be readily measured in GCs via observations with sufficient angular resolution to resolve individual sources in the crowded cores of these systems (e.g. see De Marchi & Pulone, 2007). In this paper we use archival HST ACS observations of NGC 2298 as analyzed by De Marchi & Pulone (2007). These data are ideal to measure the radial variations of mass segregation because they range from the center out to more than twice the half-light radius. The observed radial variation in the mean MS mass is then compared to expectations based on the numerical simulations of Gill et al. (2008), which allow us to constrain the mass of a central BH in the system.
2 Observations and Data Analysis
We study the mass segregation of MS stars of NGC using deep HST/ACS observations in the F606W and F814W bands. The field covers an area of arcmin2 around the cluster center, extending to more than twice the cluster’s half-light radius (see Harris, 1996). The data reduction is described in De Marchi & Pulone (2007), who derive the color-magnitude diagram that we use in our analysis. The data have detection limits of and with a completeness at the detection limit above . Background sources contamination is essentially negligible for this cluster (De Marchi & Pulone 2007). We assume a distance modulus of mag (distance of about kpc), and color excess from Harris (1996). From the color magnitude diagram we infer the mass of each individual main sequence source using the mass-luminosity relation from Baraffe et al. (1997) and assuming a metallicity for the cluster (Harris, 1996). Our MS stars catalog consists of objects with masses in the range , where the lower limit is set by completeness cutoff and the upper limit by the turn-off mass.
2.1 Cluster Properties
The Surface Brightness Profile for NGC 2298 is part of the Trager et al. (1995) compilation of photometric data on galactic GCs. McLaughlin & van der Marel (2005) fitted a single-mass King model to it, obtaining a total mass of while De Marchi & Pulone (2007) derive a total mass of based on a multi-mass dynamic model. The Harris (1996) catalog reports a projected half-light radius of arcsec, while McLaughlin & van der Marel (2005) derive arcsec, corresponding to parsecs. De Marchi & Pulone (2007) find instead a larger half-mass radius — that is arcsec — from their multi-mass model.
From the structural parameters of NGC2298 we can derive its half-light relaxation time, defined in physical units as (Djorgovski, 1993):
| (1) |
where is the average mass of a star (including dark remnants), is the number of stars and is the total mass of the system.
Assuming an average stellar mass of , the half-light relaxation time for NGC 2298 is yr using the McLaughlin & van der Marel (2005) structural parameters. If we consider instead the De Marchi & Pulone (2007) modeling 222Note that the relaxation time of 3.1 Gyr quoted in De Marchi & Pulone (2007) for NGC 2298 is the result of a typo in the output of the code they used to contruct the dynamic model., Eq. 1 yields yr. In both cases NGC2298 appears to be a dynamically old cluster even after accounting for a significant mass loss in the cluster during its evolution, as suggested by Baumgardt et al. (2008): if the cluster was originally four times as massive and twice as large 333Trenti et al. (2007b) find that the half-mass radius stays approximately constant while a star cluster is being tidally disrupted there would still have been enough time to relax, as the initial relaxation time would have been .
Further evidence for an old dynamic age comes from the shape of the mass function of NGC , which shows a depletion of low mass stars. This makes the cluster a good candidate for our search because it would be expected to have undergone core collapse, unless there is a central source of energy capable of halting the core contraction, such as an IMBH or a significant population of primordial binaries (e.g. see Trenti et al., 2007b, a). While the current formation scenarios for IMBHs in GCs assume a higher cluster mass than the current NGC2298 mass, its probable initial mass — up to (Baumgardt et al., 2008) — was well in the range required for IMBH formation.
In order to consistently compare the data with our sample of numerical simulations, we identify the projected half-mass radius in main sequence stars within the ACS field of view — which we call . Given that the mass-to-light ratio of globular clusters has radial gradients, this quantity is different from the standard half-light radius used in the literature. To measure we bin the star counts in cluster-centric radius and sum over star mass, applying the completeness correction appropriate for the given cluster-centric radius and star magnitude. We obtain the surface density profile of the cluster from main sequence stars and then apply the non-parametric spline-smoothing technique described in Pasquato & Bertin (2008) to the profile obtaining our best estimate of the total main sequence mass of the cluster in the field of view and of the respective half-mass radius. We do not extrapolate the light profile outside the ACS field which might lead to the discrepancies in the determination of the structure of the cluster discussed above, but rather include the effect of a finite field of view into the simulation analysis (see Section 3). We derive arcsec, slightly larger than reported in Harris (1996). This is not surprising, as the light profile tends to be dominated by red giant stars, more massive on average than MS stars and therefore more centrally segregated (for example, see Hurley, 2007).
2.2 Mass Segregation
We quantify mass segregation through the radial variation of the mean mass of MS stars. At the center of the system, where high mass stars segregate through energy equipartition, the mean mass of stars in such range is expected to be higher than in the outer region of the system (Spitzer, 1987). To construct we apply the completeness correction as follows:
| (2) |
where is the star’s mass and is the completeness for a star of magnitude at cluster-centric 2D radius . To apply the completeness correction, we assumed a one to one map from mass to luminosity ( to ) for main-sequence stars (specifically that of Baraffe et al., 1997). The color information is of course used to select main sequence stars. The sum over the index is carried out over all stars in an annulus around the radius . Since the completeness function was defined in both radial and magnitude bins by De Marchi & Pulone (2007), we define a continuous by bilinear interpolation. As a compromise between obtaining high spatial resolution and minimizing Poisson fluctuations we calculate using concentric annuli comprising each of the stars in number.
Errors on each radial annulus are obtained using a bootstrap technique (Efron, 1979). We proceed as follows: Let be the catalog of observed main sequence star masses within a radial annulus. We use this catalog to generate 100 synthetic catalogs. To construct a synthetic catalog, we first extract random numbers from a uniform random number generator in the range . The synthetic catalog of masses is then defined as , that is we extracted with replacement and uniform probability from the original data-set. Eq. 2 is then applied to each synthetic catalog of a radial annulus and the 1 error on the observed is defined as the standard deviation of the sample of the 100 synthetic catalogs for that radial position.
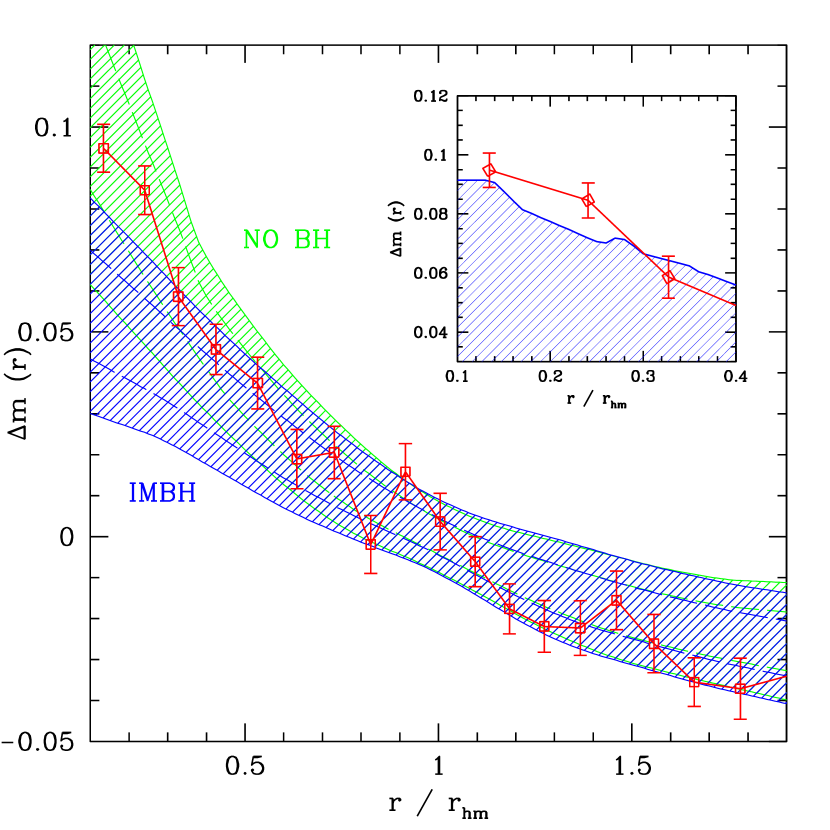
The observed mass segregation profile, normalized to the average mass measured around (using the average MS mass measured between 0.8 and 1.2 ) is indicated as and shown in Fig. 1. From the plot it is clear that the cluster has a marked radial variation in the MS mass, with a difference of about from the center to the outermost region at . This is about of the average mean MS mass of the system .
3 Comparison with Numerical Simulations
The numerical simulations used in this paper have been carried out with a state-of-the-art direct N-body code for star cluster dynamics, NBODY6 (Aarseth, 2003). NBODY6 has been modified as discussed in Trenti et al. (2007a) to improve accuracy in the presence of an IMBH, and uses regularization of close gravitational encounters without any softening, guaranteeing high accuracy on the integration of the star trajectories even in the proximity of the black hole.
The details of the N-body simulations — along with a mass segregation analysis — are discussed in Gill et al. (2008), here we summarize their properties (see also Tab. 1). We use from to particles. Their individual masses are drawn from an initial mass function (IMF, either Salpeter 1955 or Miller & Scalo 1979) and then evolved through an instantaneous step of stellar evolution to Gyr of age using the Hurley et al. (2000) tracks. Our stellar mass black holes are in the range. The stellar evolution step evolves the cluster IMF to match the turn-off mass of observed in NGC 2298. Simulations also have up to of primordial binaries and include the effects of a galactic tidal field.
Simulations are carried out until complete tidal disruption of the systems, which happens after about 20 initial half-light relaxation times (defined in Eq. 1), a timescale longer than the age of the Universe for a typical globular cluster. As discussed in Gill et al. (2008), the simulations settle down in a quasi-equilibrium configuration with respect to mass segregation after a few relaxation times. At this point, there are three regimes for the asymptotic value of mass segregation measured as the difference in the main sequence mass between the center and the half mass radius444Note that the quantity defined in Gill et al. (2008) has a slightly different normalization with respect to used in this work. We define as the difference in mean MS mass between the center and mean MS mass in the radial annulus . Gill et al. (2008) use instead a smaller annulus around the half mass radius, defined as that containing 5% of mass of the cluster and centered on . In Table 1 we report both indicators for comparison. (): a low value () corresponding to an high probability of harboring an IMBH, a high value () associated to a low probability of harboring an IMBH and an intermediate regime, where models with and without an IMBH both can be found. In addition, the mass segregation profile measured through and/or is a differential measure normalized to the half-mass radius, so the average value of the MS star mass over the whole cluster is not important and runs with either a Salpeter 1955 or Miller & Scalo 1979 IMF have similar profiles.
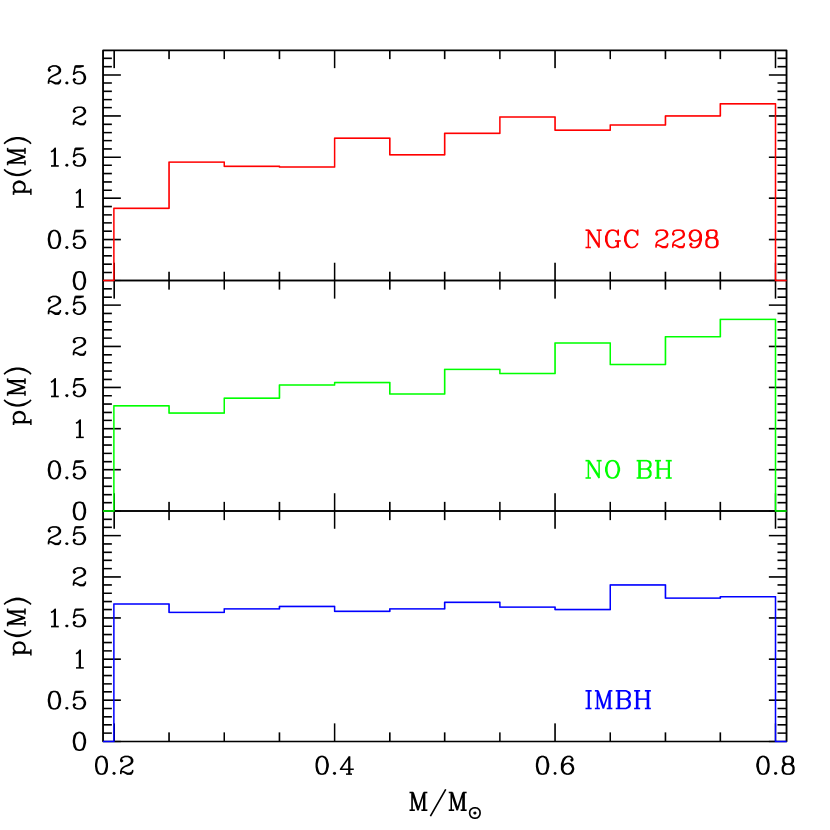
Furthermore, our N=32k runs starting with a Miller & Scalo (1979) mass function have a similar shape of the mass function in main sequence once they have lost about 75% of their initial mass (as estimated for NGC 2298 by Baumgardt et al. 2008). This is shown in the left panel of Fig. 2 for our simulation 32km at : dynamic evolution of the cluster and the subsequent preferential ejection of light stars has naturally evolved the initial Miller & Scalo distribution to match that observed in NGC 2298, especially for the simulation with no BH. To ensure a self-consistent comparison of the observations with our simulation, Fig. 2 has been obtained by taking into account the completeness limit of the data when “observing” the simulation: we have projected the simulation snapshots along random lines of sight, then rejected with probability particles with magnitude at a 2D radius .
To construct the mass segregation profile of our simulations, we use all the snapshots from Gill et al. (2008) with particles. We restrict the analysis to the time interval between and , a period in which the simulated clusters have reached their asymptotic amount of mass segregation but still have more than half of the initial number of particles (except for the plot shown in Fig. 2, obtained using snapshots between 15.5 and 16.5 ). This gives us snapshots per simulation for runs with , and snapshots for runs with for a total of snapshots available for comparison with observations. As in this paper we aim at analyzing the simulations as similarly as possible to the NGC 2298 data, we recast the analysis in terms of the full radial profile for mass segregation rather than limiting to as in Gill et al. (2008). Only line-of-sight projected quantities are used and only main sequence stars are considered in the analysis. For those runs with primordial binaries, binary stars are projected onto the main sequence for single stars and treated as a single star with mass equal to that of the heavier main sequence member (see Gill et al. 2008). The analysis is also restricted to MS stars more massive than to match the completeness limit of the observations. Under these assumptions we calculate the center of visible projected mass for each simulation snapshot (this turns out not to differ significantly from the center of mass of all gravitationally bound particles) and a first guess of . We then repeat our analysis including only particles lying within from the center and recompute both the center of visible mass and the final value. This procedure closely resembles the observational limit on the field of view of our data, which extends to about . To bring the number of particles “observed” in a simulation snapshot close to the actual number of stars in NGC 2298 we sum three independent projections for each snapshot. In this way we almost reach a 1:1 ratio of particles to stars for our larger runs.
Fig. 1 shows the results from the Gill et al. (2008) sample of snapshots superimposed to the observed mass segregation profile derived in Section 2. The blue shaded area corresponds to the region defined by the contours for points derived from all the snapshots of all runs with an IMBH (thus encompassing simulations with different IMF and binary fractions as reported in Table 1), while the green shaded area is the region for runs with no central BH (including all the no BH runs in Table 1).
The data-points for NGC 2298 are fully encompassed by profiles derived by simulations run without a black hole and the central profile (innermost two measurements) is outside the region associated to simulations with a central BH. The error bars associated to the observed points are smaller than the scatter from simulation snapshots, thus the main factor in setting the confidence level at which we can exclude a central black-hole is set by the variance in the simulations. The upper right inset of Fig. 1 shows the upper envelope of all mass segregation profiles obtained from snapshots of simulations containing an IMBH. The two central observed data points lie above such envelope at a combined confidence level greater than confidence level, providing us with a quite stringent test against the possibility that the observed high amount of mass segregation in NGC 2298 is the result of a random fluctuation of a system with a central IMBH. If this were the case, two fluctuations both in the simulations and in the observations would be required, thus we can exclude this scenario at about level.
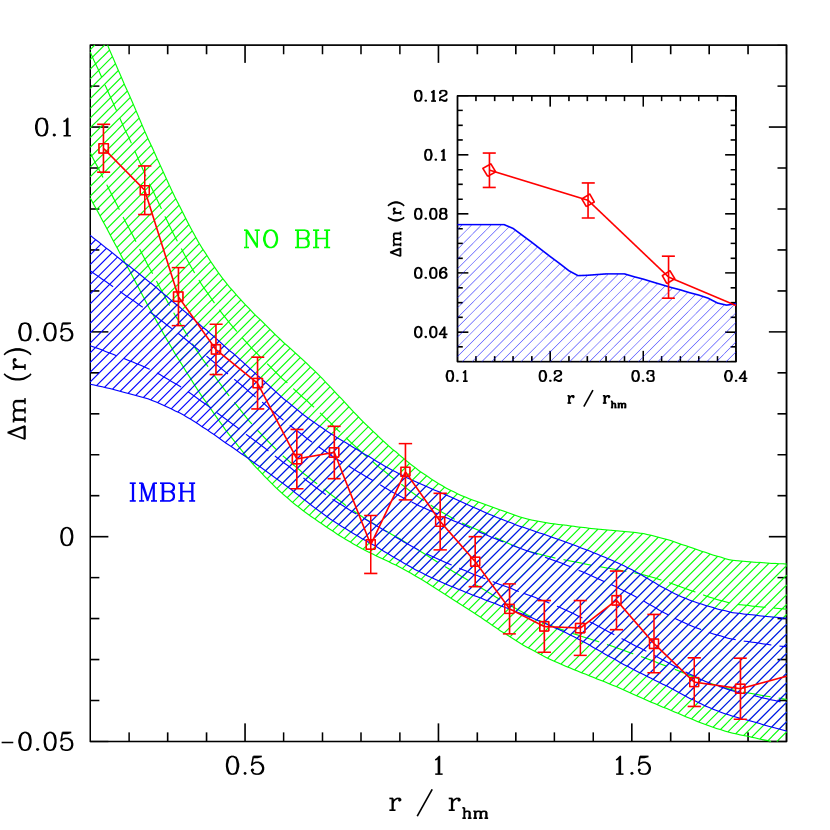
To better quantify the influence of different initial conditions on the expected variance of the mass segregation profile, we used a second, different approach. Rather than calculating the variance of all sample of simulations with or without a central IMBH, we compute the variance in separately for each run. In Fig. 3 we then define the blue and green shaded areas as the envelope of the regions of each run. In this way simulations with different IMF and binary fractions are treated separately and the systematic differences between them are not treated as random error. The two shaded areas are therefore larger by construction than in Fig. 1. Still a clear separation is present between runs with and without an IMBH. showing that systematics due to different IMF and binary fractions are not a concern for our results.
Fig. 3 is also based on four additional runs with respect to the Gill et al. (2008) runs that were used to construct Fig. 1. These additional runs, listed at the end of Table 1, have been generated using the same initial conditions of run 16kmbh in Gill et al. (2008), except for a different seed of the random number generator. These runs have been added to further study mass segregation in presence of an IMBH when there is a Miller & Scalo IMF. Note that run 16kmbh in Gill et al. (2008) is the one which shows the highest degree of mass segregation among those with an IMBH, even though both its and counterparts in Gill et al. (2008) have a lower degree mass segregation. Our additional runs show on average a slightly lower degree of mass segregation as reported in Table 1 (eight column), even though one of the four runs is very close to the original Gill et al. (2008) results. In preparing Fig. 3 we treated all these five 16kmbh runs independently, thus the envelope shown in the figure includes a confidence level area with respect to this specific initial condition. Note also that the addition of 106 snapshots from four new runs have naturally lead to a slight increase of the maximum amount of mass segregation measured in the simulations (plotted in the upper right inset of Fig. 3) compared to the inset of Fig. 1. But these additional snapshots also increase the confidence level for BH rejection: the inset in Fig. 3 is based on a total of snapshots and still none of those snapshots reaches the data whithin the observed error bar (in particular with respect to the second innermost data point).
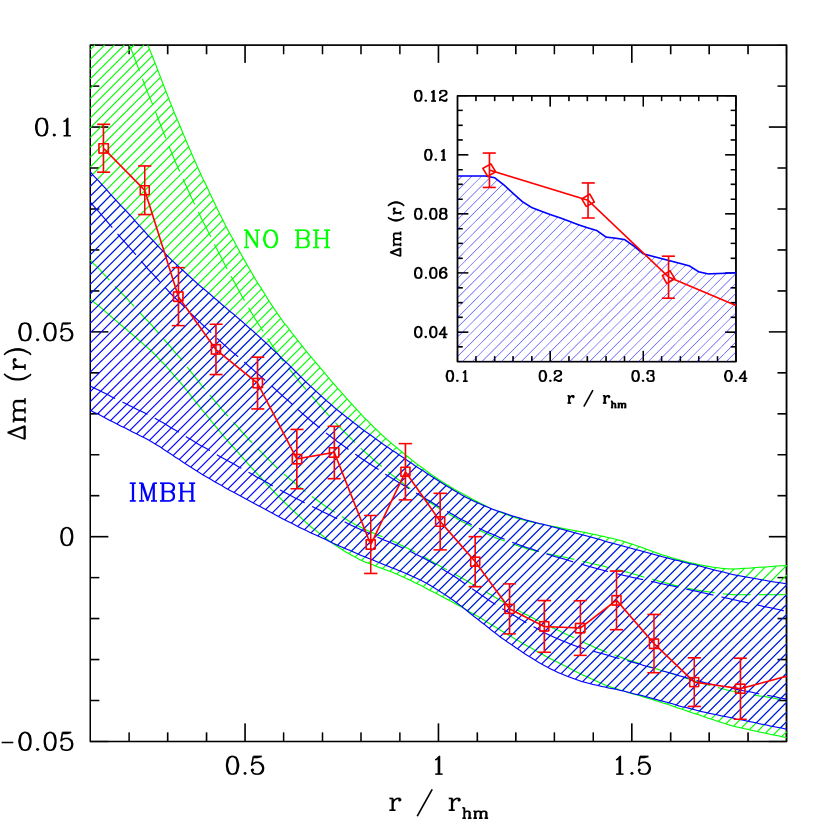
If we restrict our analysis to snapshots that have a global mass function similar to that observed in NGC 2298, our results are stronger. The right panel of Fig. 2 shows a comparison of the observed with the expectations from our N=32k Miller&Scalo simulations evolved around , when particles remains in the system (a mass loss consistent with the one estimated for NGC 2298 by Baumgardt et al. 2008). The global mass function of the simulations at that point is an excellent match to the observed one, especially for the run without central BH. Evaporation of a significant fraction of stars has marginally lowered the amount of central mass segregation compared to that measured at for the same runs. The contour areas for the simulated in this figure are contained within those of Fig. 1, but are significantly more compact in the central region. Therefore from Fig. 2 the presence of a central BH can be rejected at a significance level much higher than . In addition, we get a fully consistent representation of the mass segregation profile from the simulations without a central BH. The quantitative match of the observed mass segregation profile to the numerical expectations also provide a posteriori evidence that NGC 2298 has reached its equilibrium value for mass segregation and thus it is collisionally relaxed (see discussion in section 2.1).
All our simulations that include an IMBH have a ratio of about between the total cluster mass and the black hole mass. Assuming a total mass for NGC 2298 of , this implies that we can exclude the presence of a central BH of mass . The latter limit would increase to if the total mass of NGC2298 is instead .
3.1 Systematic Uncertainties
In order to compare simulations to observations there is need to fix a radial scaling. We choose to normalize the mass segregation profile to its value at , as discussed in Section 2 and shown in Fig. 1. A correct measurement of is therefore vital for a consistent comparison between simulations and observations. For the simulations, we have a complete control over the observables in the system, but we have to evaluate possible biases in the measure of from the photometry of NGC 2298. Mis-estimating the value of mean MS mass at due either to local fluctuations of or to a wrong estimate of can then in principle lead to an un-physical shift of the whole profile upwards or downwards along the vertical axis.
Local fluctuations in the average main sequence mass are reduced by our choice to normalize the profile using the mean MS mass between and , instead of the punctual value at exactly (see Section 2). We note in passing that also choosing a smaller interval () yields comparable results, although with more noise.
To assess the impact of a mis-determination of , we repeat our analysis using values for shifted by arcsec from our best estimate . A change in of this amount does not critically affect our conclusion, as it shifts by less than the error associated to the measure. The amount of observed mass segregation is decreased if one adopts a smaller value for . Only a significant change in ( arcsec) would move the measurement within the amount of segregation typically associated to the presence on an IMBH.
Another source of systematic uncertainty that needs to be addressed is the determination of the center of the cluster. Noyola & Gebhardt (2006) point out that center determination of GCs is a difficult problem, with literature/ground based coordinates of GC centers sometimes being inaccurate. Miscentering of the cluster in the analysis of observational data could in principle lead to an artificially shallower mass segregation profile in the central part of the cluster. If this is the case, then the confidence level of our null result would just increase. However, miscentering is not likely to be a significant issue in our case. Not only did we use high resolution data from HST but we determined the center based on the mass of main sequence stars, not on the total light from the cluster. Therefore the Poisson fluctuations in the small number of red giant stars that might dominate the light profile of a globular cluster do not affect significantly our analysis. To quantify the random error on our adopted center position we carried out a Monte Carlo bootstrap resampling test. We generated synthetic samples of stars by extracting with replacement main sequence stars from the observed catalog. We then re-computed the center of each synthetic sample and used the center coordinates thus obtained to calculate the fluctuation of the center position. The value we recover from our Monte Carlo test is below arcsec.
3.2 Applicability of mass segregation indicator to constrain IMBH presence
In Gill et al. (2008) we suggest two conservative criteria to ensure that a stellar system has reached its long-term mass segregation profile: (1) have a tidal to half-light radius and (2) have an half-light relaxation time below Gyr. NGC 2298 fulfills the second condition, even assuming a worst case estimation of its structural parameters (see Section 2.1), but marginally fails the first one, as . As discussed in Gill et al. (2008), these requirements are sufficient, but not necessary for the mass segregation to have reached its equilibrium value. Based on a detailed dynamic modeling of the cluster in Section 2.1 we demonstrate that the cluster appears to be well relaxed and its stars to have reached energy equipartition, despite its significant mass loss due to tidal evaporation. Furthermore, if there is some primordial mass segregation, like it has been suggested for NGC 2298 by Baumgardt et al. (2008), then the time needed to develop the asymptotic mass segregation profile becomes shorter. This provides a further validation for the application of our analysis to this system.
4 Discussions and Conclusions
We have analyzed ACS-HST data covering the globular cluster NGC 2298 to quantify the radial variation of mass segregation, measured from main sequence stars in the range . For dynamically relaxed systems such as NGC 2298 (that is with a half-mass two-body relaxation time well below the Hubble time), the degree of mass segregation present can shed light on the presence of a central intermediate mass black hole (see Gill et al., 2008). The observed mass segregation profile (see Fig. 1) has been compared to the expectation from a sample of direct N-body simulations with and without a central IMBH. The simulations have been analyzed as closely as possible to the observational data. We find that NGC 2298 exhibits a fair amount of mass segregation, with the average main sequence stellar mass being larger at the center compared to that at the half-mass radius by . This observed radial variation of the main sequence mass is fully encompassed by curves derived from simulations without a black hole. None of the simulation snapshots with a central IMBH presents such a large degree of mass segregation and the two innermost data-points lie each at above the maximum mass segregation measured in the simulations, for a nominal combined confidence level of about . At this confidence level we can thus consider unlikely the presence of an IMBH of mass (depending on the total mass of the system). Certainly NGC 2298 does not appear a promising candidate for follow-up observations to search for an IMBH such as with a proper motion study. This could partly have been expected based on the small size of NGC 2298, because the proposed scenarios for IMBH formation in GCs require a higher cluster mass (Miller & Hamilton, 2002; Portegies Zwart et al., 2004) than its present-day mass. On the other hand, dynamical interaction with the galactic environment is likely to have stripped the majority of the cluster’s initial mass (Baumgardt et al., 2008), which could have been well above the threshold for runaway collapse of massive stars.
A critical assumption in our analysis is a proper evaluation of the current dynamic state of NGC2298 and in particular of its half-light relaxation time, which is complicated by the presence of potentially inconsistent structural parameters in the literature (see our discussion in Section 2.1). Even assuming a worst case scenario with respect to the structural parameters published, the current half-light relaxation time we derive is below , guaranteeing that the cluster had enough time to reach energy equipartition and its equilibrium value of mass segregation, even if it has lost most of its initial mass and thus its initial half-light relaxation time could have been as high as Gyr. With respect to this issue, note that Gill et al. (2008) recommend to apply the mass segregation analysis to well relaxed clusters, defined as having a current and in order to avoid false positives, that is clusters that have a low amount of mass segregation not because there is an IMBH but because the cluster has not yet fully developed mass segregation. In the case of NGC2289 we are in the opposite regime as we find more mass segregation than expected in presence of an IMBH. Furthermore, we have a quantitative match of the observed radial profile of mass segregation with the expectations from our numerical models. This is a further evidence that NGC2298 is collisionally relaxed and our analysis of the full radial profile of mass segregation goes beyond the single point measure discussed in Gill et al. (2008).
The absence of a central IMBH in NGC2298 has an interesting consequence for the dynamics of the system. The cluster has a rather large core and does not appear to have undergone core collapse despite its advanced dynamic age (De Marchi et al., 2007). This means that there must be another source in the core capable of generating kinetic energy through gravitational encounters, such as a population of primordial binaries with a number density (e.g. see Heggie et al., 2006; Trenti et al., 2007b). The color-magnitude diagram for the cluster has indeed a widened main sequence which allows us to get a lower limit of for the binary fraction in the core and a likely fraction two to three times higher.
We have addressed possible sources of systematic errors in constructing the observed mass segregation profile, namely mis-estimation of the half-mass radius and cluster miscentering (see Section 3.1). Neither of these is expected to have a significant impact on our measure. Quantifying the robustness of the measured run-to-run variations from the sample of our simulations is instead more challenging. While the original Gill et al. (2008) simulations have snapshots with an IMBH and it is thus hard to solidly assess fluctuations above the level, Fig. 3 shows that the inclusion of more snapshots from runs with an IMBH does not alter our main results, thereby showing that both systematic and statistic errors are under control.
Despite the null result of this search, we have demonstrated the practical application of mass segregation as a fingerprint for the presence or absence of an IMBH. The method can be applied to other galactic globular clusters provided that data of HST quality for the central regions of the systems are complemented by the acquisition of a field located around the half-light radius of the system.
References
- Aarseth (2003) Aarseth, S. J. 2003, Gravitational N-Body Simulations (Cambridge, UK: Cambridge University Press)
- Baraffe et al. (1997) Baraffe, I., Chabrier, G., Allard, F., & Hauschildt, P. H. 1997, A&A, 327, 1054
- Baumgardt et al. (2008) Baumgardt, H., De Marchi, G., & Kroupa, P. 2008, ApJ, 685, 247
- Baumgardt et al. (2003) Baumgardt, H., Makino, J., Hut, P., McMillan, S., & Portegies Zwart, S. 2003, ApJ, 589, L25
- De Marchi et al. (2007) De Marchi, G., Paresce, F., & Pulone, L. 2007, ApJ, 656, L65
- De Marchi & Pulone (2007) De Marchi, G. & Pulone, L. 2007, A&A, 467, 107
- Djorgovski (1993) Djorgovski, S. 1993, in Astronomical Society of the Pacific Conference Series, Vol. 50, Structure and Dynamics of Globular Clusters, ed. S. G. Djorgovski & G. Meylan, 373–+
- Efron (1979) Efron, B. 1979, Ann. Statist., 7, 1
- Frank & Rees (1976) Frank, J. & Rees, M. J. 1976, MNRAS, 176, 633
- Gebhardt et al. (2002) Gebhardt, K., Rich, R. M., & Ho, L. C. 2002, ApJ, 578, L41
- Gebhardt et al. (2005) —. 2005, ApJ, 634, 1093
- Gill et al. (2008) Gill, M., Trenti, M., Miller, M. C., van der Marel, R., Hamilton, D., & Stiavelli, M. 2008, ApJ, 686, 303
- Harris (1996) Harris, W. E. 1996, AJ, 112, 1487
- Heggie et al. (2006) Heggie, D. C., Trenti, M., & Hut, P. 2006, MNRAS, 368, 677
- Hurley (2007) Hurley, J. R. 2007, MNRAS, 379, 93
- Hurley et al. (2000) Hurley, J. R., Pols, O. R., & Tout, C. A. 2000, MNRAS, 315, 543
- McLaughlin & van der Marel (2005) McLaughlin, D. E. & van der Marel, R. P. 2005, ApJS, 161, 304
- Miller & Scalo (1979) Miller, G. E. & Scalo, J. M. 1979, ApJS, 41, 513
- Miller & Colbert (2004) Miller, M. C. & Colbert, E. J. M. 2004, International Journal of Modern Physics D, 13, 1
- Miller & Hamilton (2002) Miller, M. C. & Hamilton, D. P. 2002, ApJ, 576, 894
- Noyola & Gebhardt (2006) Noyola, E. & Gebhardt, K. 2006, AJ, 132, 447
- Noyola et al. (2008) Noyola, E., Gebhardt, K., & Bergmann, M. 2008, ApJ, 676, 1008
- Pasquato & Bertin (2008) Pasquato, M. & Bertin, G. 2008, ArXiv e-prints, 805
- Portegies Zwart et al. (2004) Portegies Zwart, S. F., Baumgardt, H., Hut, P., Makino, J., & McMillan, S. L. W. 2004, Nature, 428, 724
- Salpeter (1955) Salpeter, E. E. 1955, ApJ, 121, 161
- Spitzer (1987) Spitzer, L. 1987, Dynamical evolution of globular clusters (Princeton, NJ, Princeton University Press, 1987)
- Trager et al. (1995) Trager, S. C., King, I. R., & Djorgovski, S. 1995, AJ, 109, 218
- Trenti et al. (2007a) Trenti, M., Ardi, E., Mineshige, S., & Hut, P. 2007a, MNRAS, 374, 857
- Trenti et al. (2007b) Trenti, M., Heggie, D. C., & Hut, P. 2007b, MNRAS, 374, 344
- Trudolyubov & Priedhorsky (2004) Trudolyubov, S. & Priedhorsky, W. 2004, ApJ, 616, 821
- Ulvestad et al. (2007) Ulvestad, J. S., Greene, J. E., & Ho, L. C. 2007, ApJ, 661, L151
- van der Marel (2004) van der Marel, R. P. 2004, in Coevolution of Black Holes and Galaxies, ed. L. C. Ho, 37
| ID | N | IMF | / | / | ||||||
|---|---|---|---|---|---|---|---|---|---|---|
| 16ks | Sal | |||||||||
| 16ks.1 | Sal | |||||||||
| 16km | M&S | |||||||||
| 16kbs | Sal | |||||||||
| 16kbm | M&S | |||||||||
| 32km | M&S | |||||||||
| 16ksbh | Sal | |||||||||
| 16ksbh.1 | Sal | |||||||||
| 16kmbh | M&S | |||||||||
| 16kbsbh | Sal | |||||||||
| 16kbmbh | M&S | |||||||||
| 32kmbh | M&S | |||||||||
| 16kmbhI | M&S | |||||||||
| 16kmbhII | M&S | |||||||||
| 16kmbhIII | M&S | |||||||||
| 16kmbhIV | M&S |
Note. — Properties of the N-body simulations used in this paper. The first column is the simulation ID (subscript .1 means that the IMF was down to ), the second column reports the number of particles in the run, the third the IMF (Salpeter 1955 or Miller & Scalo 1979), the fourth the BH to total mass ratio, the fifth the BH mass in solar units, the sixth the primordial binary fraction. The seventh entry, , is the snapshot-time-averaged value for the difference between mean main-sequence mass at the center of the cluster and mean main-sequence mass around , according to the definition of Gill et al. (2008). The eight entry, , is the same quantity but normalized as discussed in section 2.2. Its standard deviation, minimum and maximum values are given in the last three columns. Snapshots from to are used in the analysis. The first 12 entries are the simulations discussed in Gill et al. (2008). The last 4 entries are additional runs, that are “randomized” clones of 16kmbh (generated with a different random number seed).