V405 Peg (RBS 1955): A Nearby, Low-Luminosity Cataclysmic Binary 111Based in part on observations obtained at the MDM Observatory, operated by Dartmouth College, Columbia University, Ohio State University, and the University of Michigan.
Abstract
The cataclysmic binary V405 Peg, originally discovered as ROSAT Bright Source (RBS) 1955 (= 1RXS J230949.6+213523), shows a strong contribution from a late-type secondary star in its optical spectrum. This led Schwope et al. (2002) to suggest that it is among the nearest cataclysmic binaries. Here we present extensive optical observations of V405 Peg. Time-series spectroscopy shows the orbital period, , to be d (= 4.2635 hr), or 5.629 cycles d-1. We classify the secondary as M3 - M4.5, and estimate its contribution to the light. Astrometry with the MDM 2.4m telescope gives a parallax milli-arcsec, and a relative proper motion of mas yr-1. We employ a Bayesian technique to form a best estimate of the distance from the parallax and other indicators; this yields pc. The semiamplitude of the secondary stars’s radial velocity is km s-1, indicating a fairly low orbital inclination if the masses are typical. Extensive time-series observations in the -band show the system varying between a minimum brightness level of and states of enhanced activity about 0.2 mag brighter. During the low state, the light curve is dominated by ellipsoidal modulation of the secondary star at a period consistent with the spectroscopic value. In the high-state we detect an additional photometric modulation with 0.1 mag amplitude, which occurs in the range 220 to 280 min. The frequency of this modulation appears to be stable for a month or so, but no single period was consistently detected from one observing season to the next. The occurrence of low states can be reconciled with a magnetic cataclysmic variable. While the additional signal could point to an asynchronously rotating white dwarf, our data do not show this signal to be truly coherent. We estimate the system luminosity by combining optical measurements with the archival X-ray spectrum. The implied mass accretion rate is orders of magnitudes below the predictions for the standard angular momentum loss above the period gap. The system may possibly belong to a largely undiscovered population of hibernating CVs.
1 Introduction
Cataclysmic variable stars (CVs) are close binary systems in which a low-mass secondary transfers mass onto a white dwarf; Warner (1995) wrote an excellent monograph on CVs.
Because CVs are discovered by a variety of methods with idiosyncratic and varying efficiency, their space density remains uncertain. This is unfortunate, since an accurate knowledge of the space density would serve as a strong constraint on evolutionary scenarios.
CV evolution is driven by the gradual loss of angular momentum. As the Roche lobe around the secondary star shrinks, matter is transferred to the white dwarf, giving rise to the rich observed phenomenology. The mass transfer rate is observed to decline with declining orbital period (Patterson, 1984), so there should be a preponderance of short-period, slowly-evolving CVs, unless short-period CVs are somehow destroyed (Patterson 1998 discusses these issues vividly). In addition, Shara et al. (1986) suggest that old novae ‘hibernate’, that is, render themselves faint and inconspicuous by fading into extended states of little or no mass transfer between nova outbursts.
The closer an object is, the easier it is to discover, so representatives of these hard-to-find classes would be expected to show up relatively nearby. Schwope et al. (2002) summarize the properties of CVs discovered in the ROSAT bright source (RBS) survey. The RBS was a program to identify optical counterparts of more than 2000 of the brightest X-ray sources, sec-1, detected at high latitudes () during the ROSAT all-sky survey. The optical spectrum of one of these, since named V405 Peg (Kazarovets et al., 2006), shows a strong contribution from an M-type secondary. This led Schwope et al. (2002) to suggest it was either a symbiotic-like object or a CV; for the latter case they estimated a distance of only 30 pc. Kato & Yamaoka (2002) estimated a proper motion of milli-arcsec (mas) yr-1 from catalog positions, which constrains the distance to pc for transverse velocity km s-1. A 30 pc distance would make V405 Peg the nearest known CV, and would suggest that a large space density of such objects remains undetected. We therefore observed this object to find its orbital period, explore its nature, and constrain its distance.
2 Observations and Analysis
Spectroscopy. We obtained spectra at the 2.4m Hiltner telescope at MDM Observatory on Kitt Peak, using the modular spectrograph. Most of the spectra are from 2002 October, with sparser coverage during other observing runs extending up to 2005 September (see Table 1). The instrument configuration and protocols were as described in Thorstensen et al. (1998); briefly, the setup yielded 2 Å pixel-1 from 4210 to 7500 Å, with severe vignetting towards the ends. The wavelength calibration was generally maintained to a few km s-1, but for a few spectra the night-sky line was used to correct calibration errors. Flux standards were observed when the sky was reasonably clear. Observations were extended to large hour angles to minimize ambiguities in the orbital modulation’s daily cycle count. Exposure times were mostly 300 s to resolve possible short periods.
Direct imaging, astrometry, and color photometry. Direct images were obtained on eight observing runs, from 2002 October through 2005 November, using the parallax protocols described by Thorstensen (2003).
On 2002 Oct. 25 UT we obtained a set of images; we checked these using images obtained on two different photometric nights in 2003 June. To derive transformations to standard magnitudes we observed standard star fields from Landolt (1992). The scatter of the standard star magnitudes and colors was mag, and somewhat worse for . Table 3 gives measurements of the brighter stars with their estimated counting-statistics errors, together with positions derived from a fit to numerous USNO-A2.0 stars (Monet et al., 1996). Fig. 1 shows an -band image of the field with -magnitudes of selected stars. V405 Peg proved to be the bluest object in the field in and , but the reddest in .
We selected 96 -band images for the parallax reduction, for which we used procedures described by Thorstensen (2003). The parallax relative to the reference-frame stars, , is 6.1 mas, with a formal error of 0.8 mas. Based on the scatter of the field star parallaxes, we adopt a somewhat more conservative uncertainty of 1.1 mas. The colors and magnitudes of the reference stars indicate that the correction to absolute parallax is near 1.1 mas, so our best estimate of is mas. The proper motion relative to the reference stars is mas yr-1 in and respectively, or 59 mas yr-1 in position angle 211 degrees. The formal fitting error in the proper motion is less than 1 mas yr-1, but there are systematic uncertainties of at least a few mas yr-1 in the correction to absolute proper motion (not attempted here); the reference stars in addition show a dispersion of several mas yr-1 in each coordinate. A second determination of the proper motion alone, using archival Sky Survey images from the USNO Plate Measuring Engine 222available at http://ftp.nofs.navy.mil/data/FchPix/ together with one of the CCD images, produced a nearly identical result.
Time resolved photometry. Time resolved photometry was acquired on 48 nights in 2002, 2003, 2005 and 2006 using the 1.23 m reflector at Calar Alto Observatory, the 1 m Elisabeth telescope at SAAO, Sutherland, the IAC 80 cm telescope at Observatorio del Teide, Tenerife and the 70 cm telescope of the AIP in Babelsberg (see Table 2 for a summary). To be more sensitive for the ellipsoidal variations of the secondary star all observations were taken with an -filter, but different filter systems had to be used; the Calar Alto and IAC observations were done with a Johnson -filter, while the SAAO natively uses the Kron-Cousins system. The different band passes and effective wavelengths of the two filter systems will introduce an additional uncertainty in the zero-point determination. Landolt (1983) and Bessell (1983) give transformations for the color of both systems, which are unfortunately not very well established for stars redder than or later than spectral type M1. The transformations indicate that for M-dwarfs independent of subtype the Johnson filter will yield magnitudes 0.06 mag brighter compared with the Kron-Cousins system. We consequently have corrected the Calar Alto and IAC photometry by this amount.
We also performed an absolute calibration of the field stars at 1.23 m Calar Alto telescope with the Johnson -filter, but using standards of Landolt (1992) given in the Kron-Cousins system. The calibrated magnitudes of these agree within the errors with those obtained at the Hiltner telescope as predicted by the transformations cited above. A detailed descriptions of the long-term variability of V405 Peg and period analysis will be given in Sect. 3.
Spectrum and Flux Distribution. Fig. 2, the flux-calibrated spectrum from 2002 October, shows one reason for the unusual colors – the spectrum is a composite of an M dwarf and a much bluer component. The average presented in Fig. 2 excludes data obviously affected by clouds, but the absolute flux is probably still underestimated by a few tenths of a magnitude because of thin clouds and light losses at the slit. Table 4 gives measurements of the emission lines in the mean spectrum.
Fig. 3 shows the mean spectra from 2002 October and December. The spectrum varies dramatically. In December the hot component of the flux was much reduced and the emission lines were much weaker, with the He I lines almost disappearing. The Balmer lines were much narrower than in October. Evidently, the December data represent a state of very low accretion.
We used the well-exposed 2002 October spectrum to estimate the late-type contribution. Archival spectra of M dwarfs taken with the same instrumental setup were scaled and subtracted from the object’s average spectrum. The archival spectra were all classified by Boeshaar (1976). Types from M3 to M4+ gave acceptable cancellation of the M-dwarf features over most of the spectral range, but only M4 and M4+ matched the rapid rise of the continuum longward of 7200 Å, which is near the limit of the spectral coverage and hence not as reliable as the middle. The single M5 star library spectrum did not give an acceptable subtraction. The scale factors giving good cancellation started near 0.6 of the combined flux (at 6500 Å) for type M3, and declined to 0.4 of the combined light at type M4+ as the band strength increased. The lower solid trace in Fig. 2 shows what remains after subtracting Gl 896B, classified M4+Ve by Boeshaar (1976). Schwope et al. 2002 classify the secondary as M3. Considering all this we adopt M3.75 subclasses for the secondary. This is similar to the spectral types of other CV secondaries near this orbital period (4.27 hr, derived below; Beuermann et al. 1998 and Baraffe & Kolb 2000 compile secondary spectral types as a function of orbital period).
The M-dwarf contribution subtracted in Fig. 2 has a synthetic , computed using the passband tabulated by Bessell (1990). The same procedure applied to the observed spectrum of V405 Peg yields , so for that particular decomposition, 0.23 of the -band light is from the secondary. For the best M3 decompositions the corresponding figures are and 0.34, so a conservative estimate for the secondary’s fractional -band contribution is . The synthetic magnitude of the observed spectrum is magnitude fainter than the magnitude measured with direct photometry on the same observing run. It is possible that the star varied by this amount in the few-day interval between the direct and spectroscopic observations, but we believe it is likely that the cloud and slit losses mentioned earlier account for the difference, and we assume this is the case. Accounting for this gives best estimates of the secondary’s magnitude of 17.32 and 16.90 for types M4+ and M3 respectively.
Knowing the secondary’s contribution, we can calculate the color of the ‘blue’ component. Stauffer & Hartmann (1986) tabulate accurate colors of M dwarfs which also have spectral classifications by Boeshaar (1976), and comparing these one finds for M3V stars and for M4+V. The observed and assumed contributions to the light then give for the ‘blue’ component alone; the calculation is insensitive to the secondary spectral type because the secondary contribution gets weaker toward later (redder) spectral types. The ‘blue’ component is therefore surprisingly red in .
Radial Velocities and Period. We measured radial velocities of the M-component by cross-correlating tone he line-rich 6000 - 6500 Å spectral region against an M-dwarf template, using xcsao (Kurtz & Mink, 1998). The template was created by taking spectra of several M dwarfs with precise velocities measured by Marcy, Lindsay, & Wilson (1987), shifting the spectra to zero velocity, and averaging them. This procedure should result in a velocity zero point accurate to km s-1. The individual velocities of V405 Peg had typical uncertainties of km s-1 as estimated by xcsao. There were 106 exposures that gave absorption velocities with estimated errors less than 25 km s-1; the remaining 17 velocities were not used. For the H emission lines, we measured velocities by convolving the emission line profile with an antisymmetric function consisting of positive and negative Gaussians km s-1 from the line core (see Schneider & Young 1980), which effectively gave a measurement of the line wings. The 116 spectra all yielded velocities, with typical counting-statistics velocity uncertainties of a few km s-1, but with a less reliable zero point than the absorption velocities.
The absorption-line velocity period search yields a period of 0.1776472(10) d, or 4.26 hr. There is no significant ambiguity in the cycle count over the 3-year span of the observations. Because the 4.26-hour period is seen in the absorption lines, it is clearly the orbital period. When the emission-line velocities are folded on this period, most of the data show a clear modulation with little scatter, except for the ten velocities taken 2002 December, when the star was in a much fainter state with narrower lines. These velocities did not show any modulation, but instead scattered around the -velocity by km s-1. When the 2002 December velocities are excluded, the remaining emission-line velocities show a strong periodicity at the absorption period (as well as a few other aliases allowed in by the exclusion of the December data). The combined best-fitting period is 0.1776469(7) d. Table 5 gives sinusoidal fit parameters, and Fig. 4 shows folded velocities. The emission velocities are offset in phase from the absorption by 0.581(8) cycles, compared to a value of 0.5 expected if the emission lines trace the white dwarf motion. The absorption line velocities should accurately reflect the phase of the M-dwarf motion, so the significant displacement of the emission velocities from their expected phase demonstrates that the emission velocities do not accurately trace the white dwarf motion.
With the binary period in hand, we prepared a single-trailed, phase-averaged greyscale image of our 2002 October spectra. Fig. 5 shows the region around H, which shows a nearly stationary, narrow core with fainter wings, extending to km s-1 from the line core. The H emission-line velocity measurements appear to be dominated by the motion of these wings. The HeI lines (here represented by ) show a modulation similar to the H line wings. The M-dwarf absorption features show clear orbital velocity variation.
3 Time Series Photometry
During the photometric monitoring V405 Peg exhibited two different brightness states which were accompanied by marked changes of its photometric variability.
High state photometry 2002/2003 In October/November 2002 and October 2003 the source was in a high state with an orbital averaged brightness of and . At that time the light curves exhibited a near sinusoidal modulation with an amplitude of mag, with strong flickering activity superimposed. A periodogram of these data sets (Fig. 7) derived with the analysis of variance (AOV) method (Schwarzenberg-Czerny, 1989) reveals a series of apparently significant periods in the range of 150 to 400 min, all of which are one-day aliases of each other. The strongest of these aliases occur at 227.9 min, 270.0 min and 333.8 min, none of which coincides with the spectroscopic period. A separate AOV search for the October 2003 data confirms the reality of the independent periodic photometric signal, but does not resolve its daily cycle count ambiguity.
The three different period solutions are illustrated in Fig. 6 for the combined data of 2002. Visual inspection favors the two aliases closest to orbital period at 227 and 270 min, which provide a slightly cleaner folding, especially around the photometric minimum. The two candidate periods would be either 10 % shorter or 5 % longer than the binary period.
Low state photometry 2002/2003 During December 2003 low state the source grew somewhat fainter, to , and exhibited a smooth, double-humped modulation without any flickering (Fig. 6, lowest panel). This change also affects the periodogram (Fig. 7, lower panel) where now a period close to the spectroscopic value of 255.8 min (and its inevitable aliases) becomes the only notable signal. Very likely accretion has almost completely ceased at this epoch leaving the bare secondary star as the dominant source of light. The ellipsoidal variation with peak-to-peak amplitude of mag and two unequal minima are a clear signature of a tidally deformed companion. Contrary to the normal appearance of ellipsoidal variation the secondary minimum is not symmetric to the primary, but displaced from the timing of superior conjunction by 0.05 phase units. This small but significant effect may either indicate the influence residual accretion or asymmetric distribution of the surface brightness of the secondary, e.g. by irradiation. The primary minimum is observed at HJD 2452979.3272. This agrees within 0.01 cycle with the time predicted for inferior conjunction of the M-star, using the absorption-line fit parameters given in Table 5.
The long-term photometric coverage can be extended using differential photometry from the -band parallax images. For seven of the eight parallax observing runs, the -band magnitude was near , consistent with high state data from the time series photometry, but with significant variations of mag (while the comparison stars were typically constant to within about mag). In 2003 June the source was at a still higher level, near . Unfortunately we have no photometry close in time to the low state seen in the 2002 December spectroscopy (Fig. 3).
High state photometry 2005 A dense set of 20 nights of photometry was obtained in September/October 2005. The source was in a high to intermediate state at mean brightness of . The periodogram (Fig. 8) computed from this data shows a complex pattern with two independent periodicities. One signal is related the orbital period at 255.8 min, while the most prominent one appears at 251.8 min. The two periods are independent of each other, i.e. we detect no side-band periods between those two. The beat period on the other hand would be expected at 11.176 days. None of the periods previously seen in the periodograms of the 2002 and 2003 are present in this data set.
In Fig. 10 the phase-folded light curves related to the two periodicities are displayed. The light curve folded on the orbital period shows a double-humped pattern similar to the low state of December 2003 and is likely caused by ellipsoidal variation. The dominant photometric signal at 251.8 min features a single humped light curve with a full amplitude of 0.05 mag. Thus the modulation was much weaker than during the observations of 2002/2003.
We also performed period searches using only sub-sets of the entire data. These experiments show that the features in the periodograms are quite variable. For example, for the September data alone the additional periodicities appear at 221 and 261 min, while no signal at 251.8 min, the peak of the combined data set, is detected. On the other hand, both signals at 221 and 261 min do not show up in the combined data set. Thus, the occurrence of the additional photometric periodicity is either time-dependent or strongly depends on the sampling of the data.
High state photometry 2006 In order to confirm the previously detected periods, a further set of 19 nights of photometry was obtained in September and November 2006. The source was again in a bright state, although the mean was slightly fainter than in 2005. In contrast to the periodogram from 2005 we can identify only one clear signal at the orbital period of 255.8 min. This detection is accompanied by a complicated pattern of alias periods, which includes the cycle/day and cycle/day ambiguities and a fine structure due to the two-week data gap in September 2006. We investigated the existence of further periodicities by subtracting the orbital modulation from the data. The periodogram of this cleaned data set (Fig. 9) shows tentative signals at 221.8, 262.4 and 278.4 min. Interestingly, two of those periods do coincide with the additional signals temporarily seen in September 2005. Nevertheless, our data do not specify a unique non-orbital periodicity that is coherent over different observing seasons.
4 How Far Away is V405 Peg?
We estimate the distance as follows. First, we use secondary star’s contribution, in combination with the orbital period, to estimate a distance spectrophotometrically. Next, we use a Bayesian formalism described by Thorstensen (2003) to combine this estimate with the parallax and proper motion. This gives a best possible distance.
Beuermann et al. (1999) tabulate radii and other properties of a variety of late-type stars. From this one can derive the surface brightness as a function of spectral type, which can be formulated conveniently as , the absolute magnitude of a 1-solar-radius star of the same surface brightness. Among the examples given in their table, this quantity varies from a minimum of 8.61 to a maximum of 9.97 in the range M3 – M4.5. From this, we adopt for the M secondary of V405 Peg.
Beuermann et al. (1998) give a convenient formula for the Roche lobe radius as a function of orbital period and secondary mass; at the period of V405 Peg, this yields , where is close to unity. The secondary mass can only be guessed at, but fortunately the radius depends only weakly on ; as a guide, the evolutionary models calculated by Baraffe & Kolb (2000) span a range from 0.172 to 0.475 at hr, implying . Applying this to the surface brightness range found above gives the secondary’s absolute magnitude, . The spectral decomposition gave for the secondary alone, which gives a distance modulus . Combining these gives a best distance of pc 333This assumes the errors are uncorrelated. In this case correlations between the various derived quantities will tend to reduce the uncertainty – a later spectral type is intrinsically fainter, but also contributes a lesser fraction of the light. Note that this computation does not assume a ‘normal’ mass-radius relation for the secondary – it is based instead on the secondary’s surface brightness and the requirement that it fill the Roche lobe.
Our Bayesian analysis of the parallax and proper motion follows the procedure described by Thorstensen (2003). As noted earlier, we measure mas. We assume the same a priori distribution of space velocities as Thorstensen (2003). Using the parallax and proper motion alone, the Bayesian analysis gives pc, consistent with the spectrophotometric estimate. Folding the spectrophotometric estimate into the Bayesian analysis yields pc. The final estimate is slightly greater than because a correction for the Lutz-Kelker bias increases distance estimates when the relative parallax error is not small. The rather small final uncertainty reflects the concordance of all the information – the distance evidence is all nicely consistent.
5 Orbit and dynamics
Binary Parameters. Combining the orbital period with the velocity amplitude of the secondary, km s-1, yields a mass function . Assuming broadly typical values of for the white dwarf and for the secondary gives a binary inclination of 20 degrees (i.e., close to face-on). Decreasing to a very low brings the inclination up only to 30 degrees, so it is difficult to escape the conclusion that the orbit is viewed close to face-on. Because of the phase offset between the emission and absorption velocities, we do not believe further dynamical analysis is warranted.
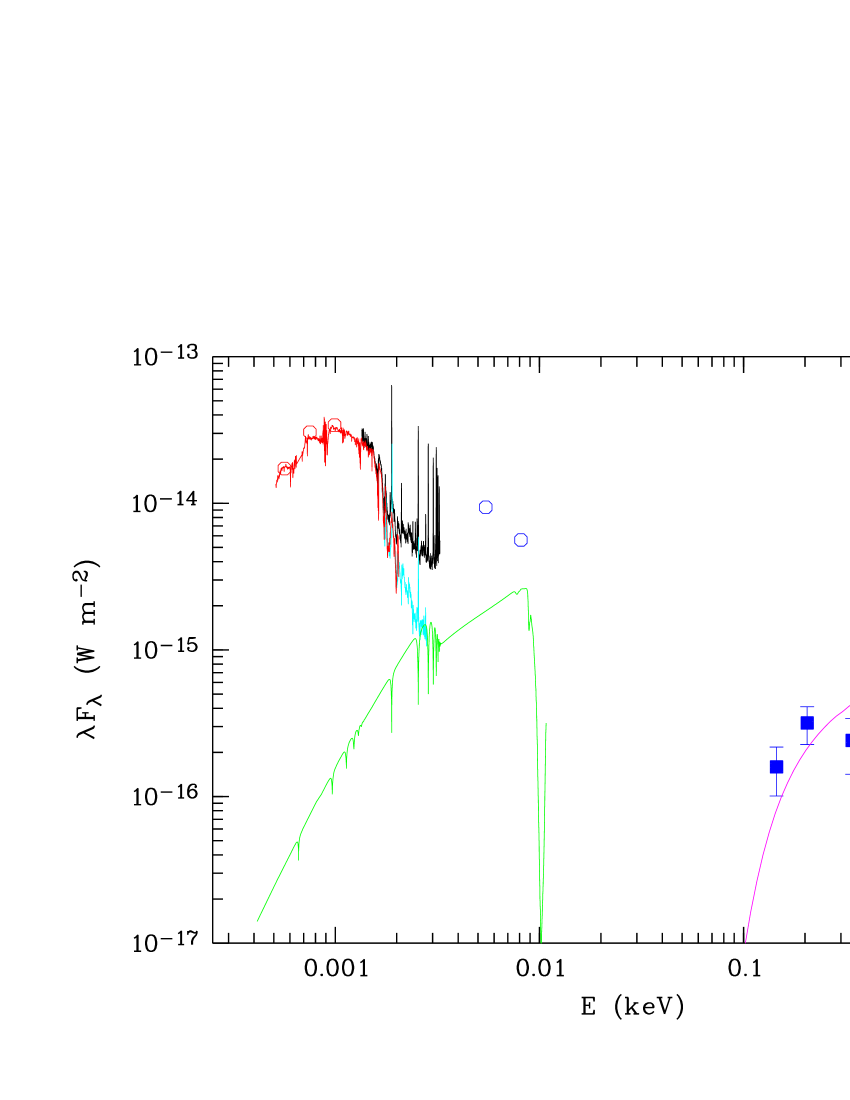
6 Broad-band spectral energy distribution
The sky around V405 Peg happened to be scanned by GALEX, 2MASS, and SDSS photometrically, and SDSS also obtained a spectrum. Fig. 11 shows all those archival data together with our low-state spectrum from Dec. 2002 and the ROSAT all sky survey spectrum.
The Sloan spectrum, obtained 2007 Aug 16, shows a rich emission-line pattern, indicating another high-accretion state. The overall flux level was comparable to that of our own high-state spectra. An M3.5 IR-optical template spectrum from Leggett’s archive (Leggett et al., 2000) scaled to fit the optical flux also accounts for the observed IR magnitudes from 2MASS. There is therefore no evidence for an IR contribution in addition to the M dwarf; in particular, there is no obvious cyclotron component.
An estimate to the temperature of the primary was obtained by matching the blue part of the optical low-state with a white dwarf template assuming a DA spectral type with a standard mass of 0.6 M⊙, a distance of 150 pc, and K. A scaled model spectrum is included in Fig. 11 but is regarded merely illustrative; the spectral type is not yet determined. GALEX photometry shows a pronounced excess over the extrapolated WD flux in both the FUV and NUV bands. This could be due to stream emission, the heated photosphere below a hypothetical accretion spot or even due to cyclotron radiation from an accretion plasma in a high magnetic field. An alternative way to estimate an upper limit temperature of the white dwarf is derived on the requirement that an assumed white dwarf model atmosphere scaled to the optical minimum spectrum shall not exceed the GALEX FUV flux. This gives K and a massive white dwarf of 1.1 for the assumed distance of 150 pc.
Schwope et al. (2002) used a two-component model to successfully reflect the RASS-spectrum, consisting of a rather hot blackbody, 38 eV, and a thermal component, likely from an accretion plasma. We wanted to derive more stringent limits on the temperatures of the spectral components involved and thus retrieved the original photon data collected in the ROSAT all-sky survey. The X-ray spectrum of V405 Peg contains 101 photons. We found that the observed spectrum can be fitted with an almost unabsorbed thermal bremsstrahlung component only. The amount of interstellar absorption is small, cm-2, to make this model work. Should the column density be higher, a soft blackbody-like component is needed to reflect the spectrum. But there is no formal requirement from the data to include such a component in the modelling. Inclusion of a soft component leads to a large degeneracy between column density on the one hand and the blackbody spectral parameters on the other hand.
The one-component fit with the thermal component deteriorates for keV, which we regard as lower limit temperature. Given the soft response of ROSAT it is impossible to constrain the temperature at the high end. The bolometric flux of a 3 keV thermal component is erg cm-2 s-1. Should the temperature be around 15 keV, as one typically finds in accretion columns of magnetic CVs, the bolometric flux becomes erg cm-2 s-1. The implied luminosity for a distance of 150 pc and a geometry factor of is erg s-1.
It is possible to hide a more luminous soft component in the soft X-ray/EUV regime. The minimum temperature (maximum luminosity) of such a component which still fits the X-ray spectrum and does not exceed the observed GALEX flux is 17 eV, which gives erg cm-2 s-1. At 25 eV, which gives a fit to the X-ray spectra of similar quality, the flux drops to erg cm-2 s-1, still higher than the flux in the thermal component. However, the lack of HeII emission lines and the fact that the X-ray spectrum is well explained with just a thermal component makes it unlikely that a luminous soft X-ray component exists in V405 Peg.
The difference between optical high- and low-state spectra give an integrated flux of erg cm-2 s-1. A bolometric correction factor could be of order , but is almost unconstrained. Hence, the accretion-induced optical flux is likely smaller than the X-ray flux although a broader wavelength coverage in the optical and the X-ray ranges is necessary to reach more definite conclusions.
The implied accretion luminosity of optical and X-ray components is poorly constrained, but likely in the range erg s-1 (the implied mass accretion rate is M⊙ yr assuming M and cm). This is too low by a factor 100 at the given binary period for a typical polar system. However, it is also times greater than found for the magnetic pre-cataclysmic systems discovered in the HQS or the SDSS (Reimers et al., 1999; Schmidt et al., 2005; Vogel et al., 2007).
7 What kind of CV is V405 Peg?
Our observations show that V405 Peg is a low-accretion-rate CV with a period well longward of the 2 to 3 hour ‘period gap’. The residual accretion observed at several epochs proves the existence of mass transfer, but its rate is several orders of magnitudes lower than the value of 10-9 M⊙ yr-1 empirically found for long period CVs and implied by magnetic braking (Patterson, 1984). While there is the small probability that V405 Peg is a previously detached white dwarf/M-dwarf binary just establishing contact, it is more likely that it has been a normal CV in the past temporarily accreting at a low rate. One possiblity is that it is in an extended state of hibernation (Shara et al., 1986). Such long-term cyclic changes of the mass transfer rate are believed to be the response of a CV to the effects of a nova explosion and might be the underlying cause for the large observed spread in mass transfer rates of CVs at a given orbital period. However, broader acceptance of this hypothesis still suffers from the difficulty of confirming a decline in the mass-transfer rate in any of the recorded post novae. The discovery of V405 Peg, together with the recent identification of a number of DA-dM binaries with almost-attached secondaries (O’Donoghue et al. 2003, Kawka et al. 2002, Gänsicke et al. 2004) in the period range preferentially occupied by old novae (Warner, 2002) is a first indication that a substantial number of hibernating CVs may exist. In contrast to the DA-dM binaries which show no obvious signs of accretion, V405 Peg would be the first candidate system occasionally accreting at a low rate.
An alternate hypothesis would be that V405 Peg is a CV of the VY Sculptoris sub-class currently stalled in an extended low state444Even in its high state, V405 Peg is much less luminous than typical VY Scl stars in their high state; see, e.g., Table 1 of Townsley & Gänsicke 2009.. In these high-, nova-like CVs, which preferentially cluster at orbital periods between 3 and 4 hr, mass transfer is temporarily interrupted at random intervals. However, the white dwarfs in these systems are very hot with in the range of 40 to 50 kK (Hamilton & Sion, 2008), in contrast to the upper limit of 17 kK for V405 Peg set by the GALEX fluxes. The timescale for cooling the heated envelope of the white dwarf to an effective temperature of 17 kK is yr (Townsley & Gänsicke, 2009), which provides a rough estimate for the time since its last nova erruption or the period spent in a VY Scl type low-state. Because of the long implied cooling time, we conclude that V405 Peg is unlikely to be a long-dormant VY Scl star.
V405 Peg exhibits two features that suggest it is a magnetic CV, namely (1) frequent changes between episodes of residual accretion and complete off states, and (2) a photometric signal unrelated to the orbital period. The latter could be interpreted as a signal of an asynchronously rotating white dwarf. However, the hallmark of such a system would be a truly stable period, which our extensive photometric data fail to show. Either the accretion process is highly unstable in V405 Peg, which would be unusual for such a low accretion rate system, or the sampling of our data is still not sufficient. Also, most magnetic cataclysmics show stronger HeII 4686 than seen here, though in low states all the emission lines can be much reduced (e.g., Mason et al. 2007).
The spectral energy distribution unfortunately does not help to constrain the likely type of CV. If the object is strongly magnetic, i.e. of a polar type, what would be the field strength? In which part of the spectrum would the cyclotron spectrum be located? The absence of a unique spin period equaling the orbital period argues against the polar interpretation. On the other hand, the object also does not fit comfortably as an intermediate polar. Why should it be asynchronous given its low accretion rate?
The low luminosity suggests that V405 Peg might be related to the low accretion rate polar (LARP) systems found in the Sloan Digital Sky Survey sample (Schmidt et al., 2005; Vogel et al., 2007). These appear to be pre-polars that underfill their Roche lobes and are powered by wind accretion via a magnetic siphon from the late type secondary. However, there are significant dissimilarities between V405 Peg and the LARPs: (1) V405 Peg does not show the the narrow cyclotron features seen in LARPs. (2) X-ray luminosity and accretion rate in V405 Peg are at least one order of magnitude higher compared to the pre-polars (Schmidt et al., 2005; Vogel et al., 2007). (3) The transitions between residual accretion and complete cessation of the mass transfer are morphologically similar to the high/low state behavior of AM Her stars, but have not yet been observed in LARPs. (4) The optical modulation from the cyclotron spots in LARPs tends to be very smooth, probably as a consequence of wind accretion. The high-state light curves of V405 Peg, on the other hand, show strong flickering, which arises naturally in disk or an accretion stream, either of which would indicate Roche-lobe overflow.
Many disk-accreting systems in this period range show so-called permanent superhumps, photometric modulations at frequencies somewhat different from the orbital frequency (see, e.g., Patterson et al. 2002 and references therein). However, all these systems are much more luminous than V405 Peg. It appears that this phenomenon arises from disk precession, and the instability which drives the precession requires the disk to occupy a substantial portion of the Roche lobe radius; this in turn requires the disk to be persistently bright. It is therefore very unlikely that the non-orbital photometric modulation is a superhump.
If V405 Peg is not a magnetic system, then it should have an accretion disk. At low inclination, emission lines are generally single-peaked, as observed. However, the disk hypothesis does not fit comfortably with the strong variability of the emission-line spectrum seen in Fig. 3; the line spectra of dwarf novae at minimum light tend to be relatively steady. Also, if V405 Peg were a disk system, it would be expected to undergo dwarf nova eruptions from time to time, but outbursts have not been recorded. Using the Warner (1987) relation between and outburst absolute magnitude , together with our period, distance, and inclination, we estimate that dwarf nova outbursts from this object would reach , so if outbursts occur they would escape notice only if they were very infrequent. Some dwarf novae, such as WZ Sge, do outburst only every few decades, and the high-proper-motion star GD552 (Hessman & Hopp, 1990) resembles a dwarf nova spectroscopically but has never been observed to outburst, implying a still longer outburst interval. These seldom-outbursting systems have orbital periods hr, however, much shorter than V405 Peg. Tappert et al. (2001) suggest that LY UMa (= CW 1045+525), with d, may be a long-period example of a dwarf nova which seldom outbursts, but there is no clear evidence for a disk in that system either.
In sum, we are not able to unambiguously classify V405 Peg as a known type of CV – it is not clear which cage it should occupy in the CV ‘zoo’ – but the magnetic classification fits most comfortably. The cause of the photometric modulation remains an open question.
8 Conclusion
We have shown that V405 Peg is relatively nearby for a CV, but not extraordinarily so. The prominence of its secondary star shows that the accretion rate is very low. It is difficult to classify the system unambiguously, but it is most likely a magnetic CV. The photometric modulation we find remains unexplained.
References
- Baraffe & Kolb (2000) Baraffe, I., & Kolb., U. 2000, MNRAS, 318, 354
- Bessell (1983) Bessell, M. S. 1983, PASP, 95, 480
- Bessell (1990) Bessell, M. S. 1990, PASP, 102, 1181
- Gänsicke et al. (2004) Gänsicke, B. T., Araujo-Betancor, S., Hagen, H.-J., Harlaftis, E. T., Kitsionas, S., Dreizler, S., Engels, D. A&A, 2004, 418, 265
- Beuermann et al. (1998) Beuermann, K., Baraffe, I., Kolb, U., & Weichhold, M. 1998, A&A, 339, 518
- Beuermann et al. (1999) Beuermann, K., Baraffe, I., & Hauschildt, P. 1999, A&A, 348, 524
- Boeshaar (1976) Boeshaar, P. 1976, Ph. D. thesis, Ohio State University
- Hamilton & Sion (2008) Hamilton, R. T. & Sion, E. M. 2008, PASP, 120, 165
- Hessman & Hopp (1990) Hessman, F. V. & Hopp, U. 1990, A&A, 228, 387
- Kawka et al. (2002) Kawka, A., Vennes, S., Koch, R., & Williams, A. 2002, AJ, 124, 2853
- Kato & Yamaoka (2002) Kato, T. & Yamaoka, H. 2002, Informational Bulletin on Variable Stars, 5334, 1
- Kazarovets et al. (2006) Kazarovets, E. V., Samus, N. N., Durlevich, O. V., Kireeva, N. N., & Pastukhova, E. N. 2006, Information Bulletin on Variable Stars, 5721, 1
- Kurtz & Mink (1998) Kurtz, M.J., Mink, D.J., 1998, PASP 110, 934
- Landolt (1983) Landolt, A. U. 1983, AJ, 88, 439
- Landolt (1992) Landolt, A. U. 1992, AJ, 104, 340
- Leggett et al. (2000) Leggett, S. K., Allard, F., Dahn, Conard, Hauschildt, P. H., Kerr, T. H. & Rayner, J. 2000, ApJ, 535, 965
- Marcy, Lindsay, & Wilson (1987) Marcy, G. W., Lindsay, V., & Wilson, K. 1987, PASP, 99, 490
- Mason et al. (2007) Mason, E., Wickramasinghe, D., Howell, S. B., & Szkody, P. 2007, A&A, 467, 277
- Monet et al. (1996) Monet, D. et al. 1996, USNO-A2.0, (U. S. Naval Observatory, Washington, DC)
- O’Donoghue et al. (2003) O’Donoghue, D., Koen, C., Kilkenny, D., et al. 2003, MNRAS, 345, 506
- Patterson (1984) Patterson, J. 1984, ApJS, 54, 443
- Patterson (1998) Patterson, J. 1998, PASP, 110, 1132
- Patterson et al. (2002) Patterson, J. et al. 2002, PASP, 114, 1364
- Patterson et al. (1995) Patterson, J., Skillman, D. R., Thorstensen, J., & Hellier, C. 1995, PASP, 107, 307
- Reimers et al. (1999) Reimers, D., Hagen, H.-J., & Hopp, U. 1999, A&A, 343, 157
- Schmidt et al. (2005) Schmidt, G. D., et al. 2005, ApJ, 630, 1037
- Schneider & Young (1980) Schneider, D. and Young, P. 1980, ApJ, 238, 946
- Schwarzenberg-Czerny (1989) Schwarzenberg-Czerny, A. 1989, MNRAS, 241, 153
- Schwope et al. (2002) Schwope, A. D., Brunner, H., Buckley, D., Greiner, J., Heyden, K. v. d., Neizvestny, S., Potter, S., & Schwarz, R. 2002, A&A, 396, 895
- Shara et al. (1986) Shara, M. M., Livio, M., Moffat, A. F. J., & Orio, M. 1986, ApJ, 311, 163
- Stauffer & Hartmann (1986) Stauffer, J. R., & Hartmann, L. W. 1986, ApJS, 61, 531
- Stockman, Schmidt, & Lamb (1988) Stockman, H. S., Schmidt, G. D., & Lamb, D. Q. 1988, ApJ, 332, 282
- Tappert et al. (2001) Tappert, C., Thorstensen, J. R., Fenton, W. H., Bennert, N., Schmidtobreick, L., & Bianchini, A. 2001, A&A, 380, 533
- Thorstensen (2003) Thorstensen, J. R. 2003, AJ, 126, 3017
- Thorstensen et al. (1998) Thorstensen, J. R., Taylor, C. J., & Kemp, J. 1998, PASP, 110, 1405
- Townsley & Gänsicke (2009) Townsley, D. M., Gänsicke, B. T. 2009, ApJ, 693, 1007
- Vogel et al. (2007) Vogel, J., Schwope, A. D., Gänsicke, B. T. 2007, A&A, 464, 647
- Warner (1987) Warner, B. 1987, MNRAS, 227, 23
- Warner (1995) Warner, B. 1995, Cataclysmic Variables (Cambridge University Press)
- Warner (2002) Warner, B. 2002, in AIP Conf. Proc. 637: Classical Nova Explosions, 3–15
| UT Date | InstrumentaaD and S refer to direct and spectroscopic observations, respectively. | HA start | HA end | |
|---|---|---|---|---|
| 2002 Oct 24 | D | 9 | ||
| 2002 Oct 25 | D | 14 | ||
| 2002 Oct 26 | S | 49 | ||
| 2002 Oct 27 | S | 16 | ||
| 2002 Oct 29 | S | 19 | ||
| 2002 Oct 30 | S | 7 | ||
| 2002 Oct 31 | S | 9 | ||
| 2002 Dec 12 | S | 3 | ||
| 2002 Dec 13 | S | 2 | ||
| 2002 Dec 14 | S | 4 | ||
| 2002 Dec 15 | S | 1 | ||
| 2003 Feb 01 | S | 1 | ||
| 2003 Feb 02 | S | 2 | ||
| 2003 Jun 17 | D | 7 | ||
| 2003 Jun 19 | D | 11 | ||
| 2003 Jun 22 | S | 1 | ||
| 2003 Jun 25 | S | 1 | ||
| 2003 Oct 09 | D | 11 | ||
| 2003 Oct 12 | S | 1 | ||
| 2004 Jan 13 | S | 1 | ||
| 2004 Jan 16 | S | 1 | ||
| 2004 Jun 20 | D | 6 | ||
| 2004 Jun 21 | D | 6 | ||
| 2004 Jun 25 | S | 1 | ||
| 2004 Nov 12 | D | 5 | ||
| 2005 Jun 26 | D | 3 | ||
| 2005 Jun 27 | D | 5 | ||
| 2005 Jun 30 | S | 1 | ||
| 2005 Sep 08 | S | 3 | ||
| 2005 Sep 13 | D | 10 | ||
| 2005 Sep 14 | D | 6 | ||
| 2005 Sep 15 | D | 7 | ||
| 2005 Nov 18 | D | 12 |
| UT Date | Site | Exposure (sec) | Duration (h) | |
|---|---|---|---|---|
| 2002 Oct 22 | CA 1.23m | 60 | 223 | 4.38 |
| 2002 Oct 23 | CA 1.23m | 60 | 81 | 1.58 |
| 2002 Oct 25 | CA 1.23m | 60 | 136 | 2.68 |
| 2002 Nov 18 | CA 1.23m | 60 | 114 | 3.95 |
| 2002 Nov 25 | CA 1.23m | 60 | 64 | 1.24 |
| 2003 Oct 26 | SAAO 1m | 60 | 256 | 4.37 |
| 2003 Oct 27 | SAAO 1m | 60 | 273 | 4.60 |
| 2003 Dec 03 | IAC 80cm | 150 | 36 | 1.83 |
| 2003 Dec 05 | IAC 80cm | 90 | 159 | 4.74 |
| 2003 Dec 07 | IAC 80cm | 50 | 148 | 5.02 |
| 2003 Dec 08 | IAC 80cm | 50 | 111 | 4.16 |
| 2005 Aug 30 | AIP 70cm | 120 | 224 | 7.93 |
| 2005 Aug 31 | AIP 70cm | 120 | 191 | 6.63 |
| 2005 Sep 05 | AIP 70cm | 120 | 140 | 7.71 |
| 2005 Sep 01 | AIP 70cm | 120 | 221 | 7.88 |
| 2005 Sep 06 | AIP 70cm | 120 | 490 | 8.66 |
| 2005 Sep 07 | AIP 70cm | 120 | 234 | 8.42 |
| 2005 Sep 08 | AIP 70cm | 120 | 240 | 8.18 |
| 2005 Sep 19 | AIP 70cm | 120 | 241 | 8.73 |
| 2005 Oct 04 | IAC 80cm | 40 | 385 | 5.53 |
| 2005 Oct 05 | IAC 80cm | 40 | 469 | 7.30 |
| 2005 Oct 05 | AIP 70cm | 120 | 78 | 2.73 |
| 2005 Oct 08 | IAC 80cm | 40 | 297 | 4.08 |
| 2005 Oct 09 | IAC 80cm | 40 | 356 | 4.90 |
| 2005 Oct 09 | AIP 70cm | 120 | 101 | 4.07 |
| 2005 Oct 10 | IAC 80cm | 40 | 385 | 5.24 |
| 2005 Oct 11 | AIP 70cm | 120 | 417 | 7.51 |
| 2005 Oct 13 | IAC 80cm | 40 | 563 | 7.75 |
| 2005 Oct 13 | AIP 70cm | 120 | 47 | 1.61 |
| 2005 Oct 19 | AIP 70cm | 120 | 90 | 3.26 |
| 2005 Oct 27 | AIP 70cm | 120 | 126 | 4.51 |
| 2006 Sep 01 | IAC 80cm | 60 | 388 | 7.44 |
| 2006 Sep 02 | IAC 80cm | 60 | 146 | 3.59 |
| 2006 Sep 04 | IAC 80cm | 60 | 374 | 7.65 |
| 2006 Sep 05 | IAC 80cm | 60 | 282 | 5.39 |
| 2006 Sep 06 | IAC 80cm | 60 | 225 | 6.16 |
| 2006 Sep 08 | IAC 80cm | 60 | 135 | 2.60 |
| 2006 Sep 09 | IAC 80cm | 60 | 109 | 2.08 |
| 2006 Sep 11 | AIP 70cm | 90 | 328 | 8.81 |
| 2006 Sep 20 | AIP 70cm | 90 | 340 | 9.27 |
| 2006 Sep 21 | AIP 70cm | 90 | 791 | 6.87 |
| 2006 Sep 22 | AIP 70cm | 90 | 347 | 9.50 |
| 2006 Sep 24 | AIP 70cm | 90 | 261 | 7.24 |
| 2006 Nov 21 | IAC 80cm | 60 | 85 | 1.68 |
| 2006 Nov 22 | IAC 80cm | 90 | 159 | 4.37 |
| 2006 Nov 23 | IAC 80cm | 90 | 99 | 2.67 |
| 2006 Nov 25 | IAC 80cm | 90 | 199 | 5.42 |
| 2006 Nov 26 | IAC 80cm | 90 | 187 | 5.09 |
| 2006 Nov 27 | IAC 80cm | 90 | 190 | 5.16 |
| 2006 Nov 28 | IAC 80cm | 90 | 104 | 2.83 |
| V405 Peg: | |||||
| 23:09:49.15 | +21:35:17.2 | 15.727(5) | 1.096(5) | 0.193(6) | 1.759(9) |
| Field stars: | |||||
| 23:09:35.27 | +21:38:51.1 | 16.352(10) | 0.161(15) | 0.812(12) | 0.920(19) |
| 23:09:36.76 | +21:37:16.5 | 16.469(6) | 0.653(19) | 0.996(8) | 1.144(8) |
| 23:09:42.12 | +21:36:16.7 | 16.301(6) | 0.038(13) | 0.576(7) | 0.787(9) |
| 23:09:44.82 | +21:35:37.5 | 17.220(7) | 0.30(2) | 0.825(10) | 0.938(12) |
| 23:09:45.10 | +21:32:06.2 | 17.254(7) | 1.08(4) | 1.101(11) | 1.261(13) |
| 23:09:46.47 | +21:38:01.5 | 17.478(8) | 0.91(4) | 1.058(11) | 1.193(10) |
| 23:09:48.83 | +21:31:50.6 | 17.178(8) | 0.54(2) | 0.919(11) | 1.084(15) |
| 23:09:53.93 | +21:32:03.8 | 16.920(8) | 0.120(17) | 0.725(11) | 0.862(15) |
| 23:09:56.02 | +21:32:43.1 | 16.803(6) | 0.173(16) | 0.737(8) | 0.874(12) |
| 23:09:56.60 | +21:35:27.9 | 17.717(8) | 0.65(4) | 0.987(13) | 1.200(11) |
| 23:09:56.79 | +21:36:18.9 | 17.480(7) | 1.35(8) | 1.325(12) | 1.447(10) |
| 23:09:57.34 | +21:33:57.0 | 14.486(2) | 0.508(7) | 0.907(4) | 0.969(5) |
| 23:09:57.40 | +21:35:17.1 | 17.656(7) | 0.22(2) | 0.767(11) | 0.848(11) |
| 23:09:57.61 | +21:35:41.4 | 17.897(8) | 0.91(6) | 1.069(14) | 1.144(12) |
| 23:09:58.90 | +21:38:16.2 | 17.497(8) | 1.34(11) | 1.470(14) | 1.625(11) |
| 23:10:00.42 | +21:33:10.6 | 16.924(8) | 0.114(17) | 0.737(10) | 0.896(14) |
| 23:10:03.70 | +21:35:28.5 | 17.026(17) | 1.11(5) | 1.34(2) | 1.74(4) |
| 23:10:05.13 | +21:36:06.1 | 14.838(6) | 0.198(8) | 0.831(8) | 0.925(9) |
| Feature | E.W.aaEmission equivalent widths are counted as positive. | FluxbbAbsolute line fluxes in units of erg cm-2 s-1. These are are uncertain by about 30 per cent, but relative fluxes of strong lines should be accurate to per cent. | FWHM ccFrom Gaussian fits. |
|---|---|---|---|
| (Å) | (Å) | ||
| 2002 October | |||
| H | 15 | ||
| HeI | 14 | ||
| HeI | 17 | ||
| HeII | 15 | ||
| HeI | 20 | ||
| H | 16 | ||
| HeI | 17 | ||
| HeI | 14 | ||
| Fe | 15 | ||
| HeI | 18 | ||
| H | 17 | ||
| HeI | 19 | ||
| 2002 December | |||
| H | 11 | ||
| H | 9 | ||
| Data set | aaBlue-to-red crossing, HJD . | |||||
|---|---|---|---|---|---|---|
| (d) | (km s-1) | (km s-1) | (km s-1) | |||
| Absorption | 52623.6767(10) | 0.1776472(10) | 92(3) | 106 | 16 | |
| H emission | 52671.5669(9) | 0.1776467(9) | 73(2) | 113 | 12 | |
| Combined: | 0.1776469(7) |