The End of Nucleosynthesis: Production of Lead and Thorium in the Early Galaxy
Abstract
We examine the Pb and Th abundances in 27 metal-poor stars ( [Fe/H] ) whose very heavy metal () enrichment was produced only by the rapid (-) nucleosynthesis process. New abundances are derived from HST/STIS, Keck/HIRES, and VLT/UVES spectra and combined with other measurements from the literature to form a more complete picture of nucleosynthesis of the heaviest elements produced in the -process. In all cases, the abundance ratios among the rare earth elements and the 3rd -process peak elements considered (La, Eu, Er, Hf, and Ir) are constant and equivalent to the scaled solar system -process abundance distribution. We compare the stellar observations with -process calculations within the classical “waiting-point” approximation. In these computations a superposition of 15 weighted neutron-density components in the range 23 log nn 30 is fit to the -process abundance peaks to successfully reproduce both the stable solar system isotopic distribution and the stable heavy element abundance pattern between Ba and U in low-metallicity stars. Under these astrophysical conditions, which are typical of the “main” -process, we find very good agreement between the stellar Pb -process abundances and those predicted by our model. For stars with anomalously high Th/Eu ratios (the so-called actinide boost), our observations demonstrate that any nucleosynthetic deviations from the main -process affect—at most—only the elements beyond the 3rd -process peak, namely Pb, Th, and U. Our theoretical calculations also indicate that possible -process abundance “losses” by nuclear fission are negligible for isotopes along the -process path between Pb and the long-lived radioactive isotopes of Th and U.
Subject headings:
Galaxy: halo — nuclear reactions, nucleosynthesis, abundances — stars: abundances — stars: Population II1. Introduction
Nucleosynthesis of the heaviest elements in the Universe is accomplished by successive additions of neutrons to existing iron (Fe) group nuclei in stars. Two factors restrict a star’s ability to produce very heavy nuclei through standard fusion reactions: the endothermic nature of fusion reactions for species heavier than 56Fe and the increased Coulomb barriers that discourage charged particle reactions in isotopes with sufficiently high . Isotopes heavier than those of the Fe group are therefore overwhelmingly produced by neutron- (-) capture processes. Either a single neutron can be added on timescales longer than the mean time to decay (the slow [] -capture reaction) or many neutrons will be added before multiple and decays return the isotope to stability (the rapid [] -capture reaction). The rate of neutron captures and the resulting abundance patterns are strongly regulated by the physical conditions and neutron densities at the time of nucleosynthesis.
Understanding the production of the heaviest elements in the Universe provides crucial insight into the nature of these processes. An exact site for the location of the -process has not been conclusively identified, although the appearance of -process material in stars of very low metallicity ([Fe/H] )111 We adopt the standard spectroscopic notations that [A/B] log10(NA/NB)⋆ – log10(NA/NB)⊙ and log (A) log10(NA/NH) 12.00 for elements A and B. argues against possible astrophysical sites (e.g., neutron-star mergers) that require long evolutionary timescales (e.g., Argast et al., 2004), and implies instead that some association with Type II core collapse supernovae (SNe) is likely (e.g., Cowan & Thielemann, 2004; Cowan & Sneden, 2006; Farouqi et al., 2009). The lack of a precise identification of the -process site, however, has complicated efforts to model it, necessitating vast amounts of input nuclear data and increasingly more sophisticated model approaches (e.g., Cowan et al., 1991a; Kratz et al., 1993; Chen et al., 1995; Freiburghaus et al., 1999; Pfeiffer et al., 2001; Kratz et al., 2007b; Arnould et al., 2007). Nevertheless, encouraging progress has been made in recent years to experimentally determine the half-lives, nuclear masses, and -capture cross-sections for nuclei along the -process path (Kratz et al., 1993; Rauscher & Thielemann, 2000; Pfeiffer et al., 2001; Kratz et al., 2007b; Schatz, 2008), and some astrophysically-motivated models of the -process have been able to reproduce the robust -process pattern between 120 and the actinide region (e.g., Kratz et al., 2007a; Farouqi et al., 2009). Low- and intermediate-mass stars (–3.0) that pass through the asymptotic giant branch phase of evolution are the primary source of -process material (e.g., Busso et al., 1999; Lattanzio & Lugaro, 2005; Straniero et al., 2006), and investigators have had great success in matching model predictions to observed -process abundance patterns (e.g., Sneden et al. 2008 and references therein). Understanding these processes then permits the study of additional astrophysics, such as the use of radioactive isotopes to determine the ages of individual stars and stellar systems (e.g., Cowan et al., 1991; Truran et al., 2002).
Lead (Pb) and bismuth (Bi) are the two heaviest nucleosynthesis products of the -process. Pb has four naturally-occurring isotopes: 204Pb, 206Pb, 207Pb, and 208Pb; Bi has one, 209Bi. The 204Pb isotope is blocked from -process production by the stable nucleus 204Hg and will not be considered further here. 208Pb is a double-magic nucleus ( 126 and 82, closing both its neutron and proton shells), which significantly lowers its cross section to further -capture. One subsequent neutron capture (and decay) produces the stable atom 209Bi and another produces 210Bi, which may either (in its isomeric state) decay or (in its unstable but relatively long-lived ground state, yr) decay. Both processes produce 206Pb. Thus, a Pb-Bi terminating cycle forms (Burbidge et al., 1957; Clayton & Rassbach, 1967; Ratzel et al., 2004).
In low metallicity stars the ratio of free neutrons to Fe-peak seeds is higher, and on average more neutrons are captured per seed nucleus (Malaney, 1986; Clayton, 1988). This results in a high fraction of heavy -process nuclei being produced (Gallino et al., 1998; Busso et al., 1999, 2001; Goriely & Siess, 2001; Travaglio et al., 2001; Van Eck et al., 2001; Cristallo et al., 2009). Alternatively, an extended period of -process nucleosynthesis in a given star could also produce a large number of heavy nuclei. These properties of -process nucleosynthesis have led to spectacular Pb enhancements in several metal-poor stars, such as CS 29526–110 ([Pb/Fe] , Aoki et al. 2002), HD 187861 ([Pb/Fe] , Van Eck et al. 2003), HE 0024–2523 ([Pb/Fe] , Lucatello et al. 2003), SDSS 0126+06 ([Pb/Fe] , Aoki et al. 2008), and CS 29497-030 ([Pb/Fe] , Ivans et al. 2005).
The termination of the -process occurs very differently. Nuclei along the -process path with will undergo (spontaneous, neutron-induced and -delayed) fission and repopulate the -process chain at lower nuclear masses (Panov et al. 2008). Neutron-rich nuclei produced in the -process that have closed neutron shells at 126 (at the time of the termination of the -process) will rapidly decay to atoms of elements at the 3rd -process peak—osmium (Os), iridium (Ir), and platinum (Pt), but not Pb. The nuclei that form with 206–208 nucleons in the -process (i.e., those that will decay to the Pb isotopes) have neither a magic number of neutrons or protons, so they are produced in smaller relative amounts. Even in the metal-poor stars with the most extreme -process overabundances, the [Pb/Fe] ratios are extremely depressed. Pb produced exclusively in the -process has been detected previously in only three stars with [Fe/H] (HD 214925, [Fe/H] , Aoki & Honda 2008; HD 221170, [Fe/H] , Ivans et al. 2006; CS 31082–001, [Fe/H] , Plez et al. 2004). This overall lack of observational data concerning Pb abundances in very metal-poor, -process enriched stars serves as one motive for our present study.
There is an additional nucleosynthesis path for three of the Pb isotopes. All nuclei heavier than 209Bi are ultimately unstable to or decay and will follow decay chains that leave them as either Pb or Bi. In this way, the Pb and Bi abundances in a star enriched by -process material will increase with time as these heavier nuclei gradually decay. Only two isotopes of thorium (Th) and uranium (U), 232Th and 238U, have halflives longer than 1 Gyr (0.06 Gyr and 0.003 Gyr; Audi et al. 2003 and references therein). In old, metal-poor stars, these are the only heavier atoms that we have any hope of observing today. Only one detection of Bi has ever been made in a metal-poor star, in the strongly -process-enriched star CS 29497-030 (Ivans et al., 2005). This transition of Bi i (3067 Å) lies very near the atmospheric transmission cutoff in a very crowded spectral region. Similarly, U is very difficult to detect in metal-poor stars owing to its relatively small abundance and the fact that the one useful transition of U ii in the visible spectrum (3859 Å) is severely blended with CN molecular features and lies on the wing of a very strong Fe i line. Measurements of the U abundance have only been reported for three metal-poor stars.
Rather than focus on Bi or U, we investigate Pb and Th to better understand the heaviest long-lived products of -process nucleosynthesis. In this study we examine the Pb and Th abundances in a sample of 47 stars, deriving new abundances for 14 stars and adopting literature values for the others. We compare our results with -process nucleosynthesis model predictions and discuss their implications for stellar ages and the chemical enrichment of the Galaxy.
2. Observational Data
For 12 stars in our sample, we employ the same spectra used by Cowan et al. (2005). These data were collected with the Space Telescope Imaging Spectrograph (STIS) on the Hubble Space Telescope (HST) and the High Resolution Echelle Spectrograph (HIRES; Vogt et al. 1994) on the Keck I Telescope. Most, but not all, of these 12 stars are covered in both sets of observations; Table The End of Nucleosynthesis: Production of Lead and Thorium in the Early Galaxy indicates which stars were observed with these two facilities. The STIS spectra cover the wavelength range 2410 3070 Å at a resolving power 30,000 and S/N 50/1. The HIRES spectra cover the wavelength range 3160 4600 Å at a resolving power 45,000 and 30/1 S/N 200/1.
We also derive abundances from two stars observed with UVES on the VLT, analyzed previously by Hayek et al. (2009). These spectra cover 3300 4500 Å at resolving powers of 57,000 (CS 29491–069) and 71,000 (HE 1219–0312).
We supplement our sample with measurements from the literature. We include 5 stars from Johnson & Bolte (2001) and Johnson (2002), 11 stars from Aoki & Honda (2008), and one star each from Hill et al. (2002) and Plez et al. (2004), Honda et al. (2004), Christlieb et al. (2004), Ivans et al. (2006), Frebel et al. (2007), and Lai et al. (2008). We also include recent Pb or Th abundances for the globular clusters M5 (2 stars; Yong et al. 2008a, b), M13 (4 stars; Yong et al. 2006), M15 (3 stars; Sneden et al. 2000), and M92 (1 star; Johnson & Bolte 2001 and Johnson 2002). Th has also been measured in one star in one dwarf spheroidal (dSph) galaxy, Ursa Minor (UMi; Aoki et al. 2007). Including these additional stars increases our sample to 47 stars.
3. Abundance Analysis
For the 14 stars whose abundances are reexamined here, we adopt the model atmospheres derived by Cowan et al. (2002), Sneden et al. (2003), Simmerer et al. (2004), Cowan et al. (2005), and Hayek et al. (2009). These parameters are listed in Table The End of Nucleosynthesis: Production of Lead and Thorium in the Early Galaxy. We perform our abundance analysis using the most recent version of the 1D LTE spectral analysis code MOOG (Sneden, 1973). We compute model atmospheres without convective overshooting from the Kurucz (1993) grid, using interpolation software developed by A. McWilliam and I. Ivans (2003, private communication).
In addition to Pb and Th, we also derive abundances of lanthanum (La), europium (Eu), erbium (Er), hafnium (Hf), and Ir. Our goal is to sample the -capture abundance ratios at regular intervals in (or ) using species that can be relatively easily and reliably derived from ground-based blue and near-UV spectra. Abundances derived from individual transitions are listed in Tables The End of Nucleosynthesis: Production of Lead and Thorium in the Early Galaxy and The End of Nucleosynthesis: Production of Lead and Thorium in the Early Galaxy, along with the relevant atomic data. Some studies predate the most recent laboratory measurements of -capture transition probabilities, so we update the abundances from those studies. We adopt the latest values for the -capture species from a number of recent studies: La (Lawler et al., 2001a), Eu (Lawler et al., 2001b), Er (Lawler et al., 2008), Hf (Lawler et al., 2007), Ir (Ivarsson et al., 2003), Pb (Biémont et al., 2000), and Th (Nilsson et al., 2002). Final abundances for all elements, including updates of the literature values, are listed in Table The End of Nucleosynthesis: Production of Lead and Thorium in the Early Galaxy.
3.1. Lead
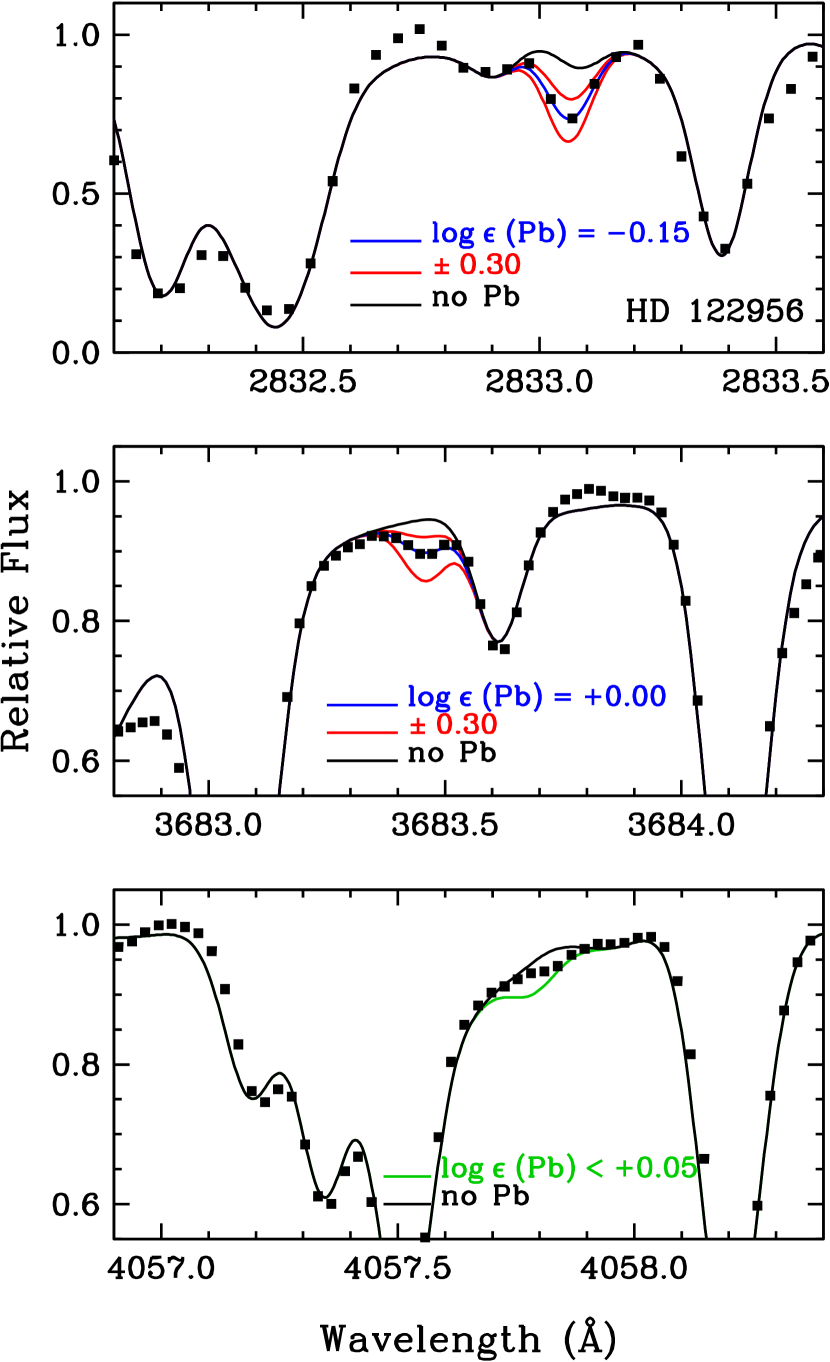
We examine three Pb i lines in each of our 14 stars: 2833, 3683, and 4057 Å. The 2833 Å resonance line is the strongest transition in stellar spectra, which demands use of the STIS UV spectra; all other transitions are accessible from spectra obtained with ground-based facilities.
Only one of the naturally-occurring Pb isotopes, 207Pb, exhibits hyperfine structure due to its non-zero nuclear spin. Simons et al. (1989) measured the isotope energy shifts and relative hyperfine splittings from FTS spectra. We adopt their measurements and the Solar System (S.S.) isotopic fractions (Lodders, 2003) in our syntheses. The -process produced the majority of the Pb in the S.S. In our stellar sample, where the -process is the dominant contributor to the -capture material, one might expect that a very different isotopic mix could affect our derived Pb abundances. We find, however, that no sensible variations in the isotopic fractions can be detected in any of our Pb lines due to the relatively small isotope shifts ( 0.02–0.03 Å) and overall weakness of the lines.
The 2833.053 Å Pb i line is blended with an Fe ii line at 2833.086 Å. A value for this line is listed in the critical compilation of Fuhr & Wiese (2006), who quote a “C” accuracy in ; i.e., 25% or about 0.1 dex. Another unidentified line at 2832.91 Å mildly blends with the blue wing of the Pb line, but this has little effect on the derived Pb abundance. Both of these blending features are weak in stars with [Fe/H] 2.0 and are negligible in the most metal-poor stars of our sample. The 3683.464 Å Pb i line sits on the wing of a Balmer series transition. We empirically adjust the strength of this Balmer line to reproduce the continuous opacity at the location of the Pb line. An Fe i line at 3683.61 Å only slightly blends the red wing of the Pb line; we derive a value of 1.95 for this line from an inverted solar analysis. The 4057.807 Å Pb i line is heavily blended with CH features. In typical -process enriched stars (with solar or subsolar C/Fe and approximately solar Pb/Fe), the Pb may be marginally detectable; if a star has supersolar C it is nearly impossible to identify absorption from Pb.
We measure the Pb abundance in five stars in our sample, all from either the 2833 or 3683 Å lines. For all non-detections we report upper limits on the Pb abundance. These individual measurements are listed in Tables The End of Nucleosynthesis: Production of Lead and Thorium in the Early Galaxy and The End of Nucleosynthesis: Production of Lead and Thorium in the Early Galaxy. In Figure 1 we display these three Pb lines in HD 122956, where we derive an abundance from the 2833 and 3683 Å lines and an upper limit from the 4057 Å line. Our choice of continuum normalization most affects the abundance of the 2833 Å line due to the relative lack of line-free continuum regions nearby. Our stated uncertainties account for uncertainties in the continuum placement.
3.2. Thorium
We examine four Th ii lines in each of our 14 stars: 3539, 4019, 4086, and 4094 Å. All of these transitions arise from the ground state. The 4019.129 Å Th ii line is relatively strong but suffers from a number of blends. Extensive reviews of the blending features have been made previously (e.g., Lawler et al. 1990; Morell et al. 1992; Sneden et al. 1996; Norris et al. 1997; Johnson & Bolte 2001). We provide only minor updates to these analyses. An Fe i line sits at 4019.04 Å; Fuhr & Wiese (2006) report a for this line, scaled from May et al. (1974). They report an “E” accuracy for this line; i.e., % or 0.2–0.3 dex. We allow the strength of this line to vary within these amounts to match the observed spectrum just blueward of the Th line. Lawler et al. (1990) determined the for a Co i line at 4019.126 Å, though this line was not found to contribute significantly in the very metal-poor stars examined here. The strength of the hyperfine split Co i line at 4019.3 Å can be treated as a free parameter to match the observed spectrum just redward of the Th line. Sneden et al. (1996) identified a Ce ii blend at 4019.06 Å in CS 22892–052 that may explain extra absorption in the blue wing of the Th line. We adopt an empirical for this line, which matches the observed spectrum in BD17 3248. The Nd ii line at 4018.82 Å, for which Den Hartog et al. (2003) report an experimental value, can be used to estimate the Nd abundance. We then set the Ce abundance from the typical Nd/Ce ratio in -process enriched metal poor stars, [Nd/Ce] 0.25. In stars with an extreme overabundance of -capture material, such as CS 22892–052, Sneden et al. (1996) note that exclusion of the Ce blend would only increase the Th abundance by 0.05 dex. This would almost certainly decrease in stars with less severe -capture overabundances.
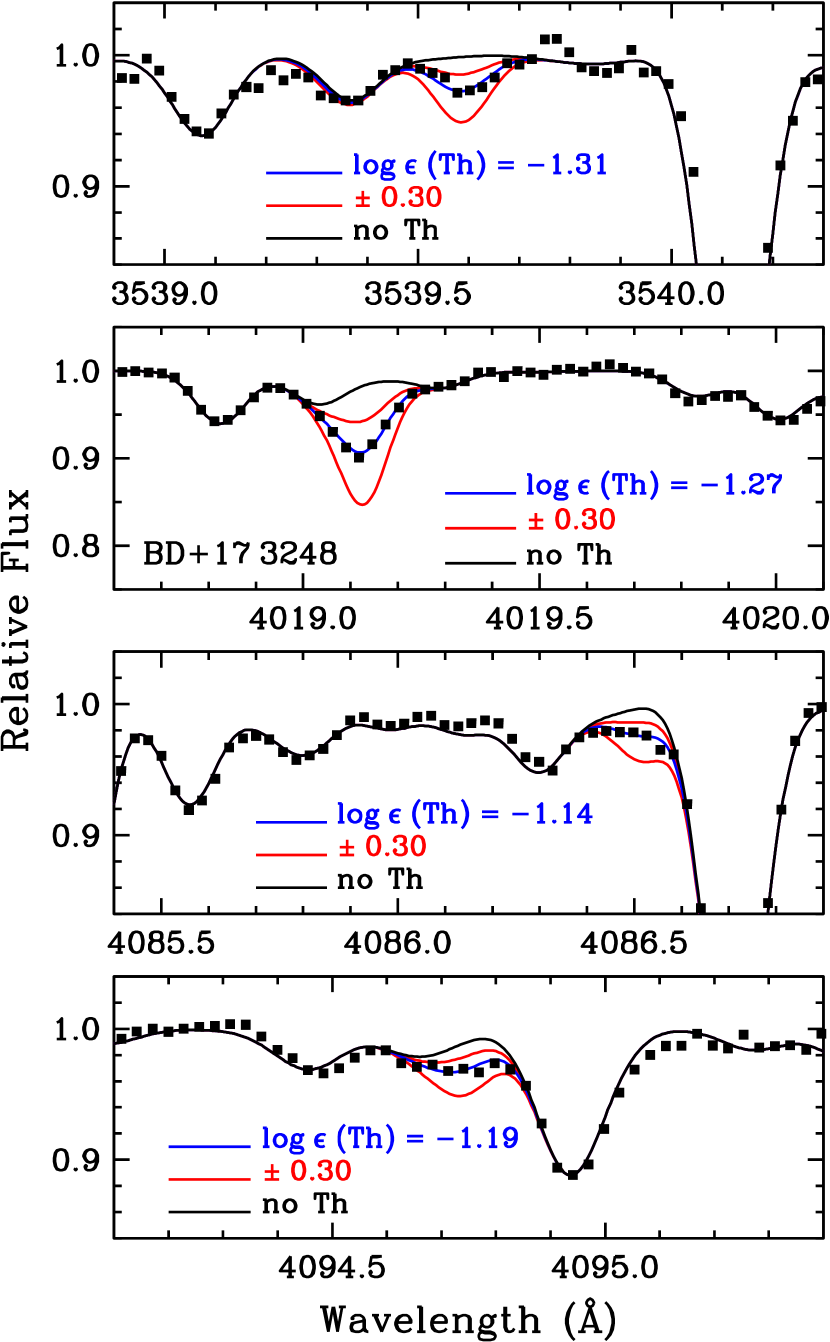
The final serious contaminant to the 4019 Å Th line is the (0–0) 13CH transition doublet (P and P; Kȩpa et al. 1996), which was first discussed by Norris et al. (1997). It is thus necessary to estimate the C abundance and the 12C/13C ratio in each of our stars. The corresponding 12CH doublet lies approximately 1 Å redward of the 13CH doublet. Norris et al. (1997) have noted that the wavelengths of these features may be incorrect in the Kurucz lists by 0.15–0.25Å. We determine the absolute position of each of these lines from the 12CH absorption lines, but we do not change the isotope shift between the 12CH and 13CH features. We empirically set the overall strength from the 12CH doublet, adjusting the values for the 12CH transitions and the 13CH transitions together. We then employ these same steps with the 13CH and 12CH doublets at 4006 and 4007 Å, respectively (P and P). The 13CH doublet is relatively unblended here, permitting measurement of the 12C/13C ratio. The overall strength of the contaminating 4019 Å 13CH feature can then be reduced by the 12C/13C ratio. Results derived from this method agree well with results derived from the CH linelist of B. Plez (2007, private communication). Our measurements of 12C/13C are listed in Table 5.
The 3539.587 Å Th ii line is relatively weak but unblended. The red wing of the 4086.521 Å Th ii line marginally blends with the blue wing of a strong La ii feature at 4086.71 Å. The blue wing of the 4094.747 Å Th ii line blends with several features, including a Nd ii line at 4094.63 Å, an Er ii line at 4094.67 Å, and a 12CH line at 4094.70 Å. Reliable values are not known for any of these features. The strength of these blends can be adjusted empirically in most stars; in other cases we instead measure an upper limit for the Th abundance. A Ca i line at 4094.93 Å also mildly blends the red wing of the Th line, but this line can be easily accounted for in our syntheses. Syntheses for these four lines are shown in Figure 2.
3.3. Uncertainties and Comparisons to Previous Studies
Pb is one of several -capture species observed in the optical regime in the neutral state in metal-poor stellar atmospheres, due to its relatively high first ionization potential (I.P.), 7.42 eV. The first I.P. of atoms of the 3rd -process peak (e.g., Os, Ir, Pt) is even higher (8.35, 8.97, and 8.96 eV, respectively), and these species, too, are observed in the neutral state in metal-poor stars. Th, with a lower I.P. of 6.31 eV, is observed in its singly-ionized state, as are all of the rare earth species. The singly-ionized states of these atoms are the dominant species in typical metal-poor stellar atmospheres—even for Pb and the 3rd -process peak elements—but less so than Th or the rare earth elements. Thus the abundances derived for Th and the rare earth elements are determined from the majority species, but we caution that this is not the case for Pb, where most of the atoms are not in the neutral state. Further exploration of this issue is beyond the scope of the present work, but we would welcome more detailed atomic model calculations of the Pb ionization balance.
Species in different ionization states clearly respond differently to conditions in the stellar atmosphere. Cowan et al. (2005) present an extended discussion of the uncertainties between ratios of elements with differing ionization states. To summarize those results, for atmospheric uncertainties of K, dex, and km s-1, the total uncertainties in ratios between neutral and singly-ionized species (e.g., Pb/Eu or Th/Pb) are typically dex. Uncertainties in ratios between species of the same ionization state (e.g., Th/Eu) are much smaller, typically dex. When considering ratios between species of different ionization states, we add an additional 0.20 dex uncertainty in quadrature with the individual measurement uncertainties.
Uncertainties in the abundance ratios resulting from neglect of the electron scattering contribution to the continuous opacity should be small since these ratios are derived from transitions in the same spectral region. While the continuous opacity may be affected more strongly by electron scattering at the Pb i transition in the ultraviolet, the abundances derived from this line generally agree with those derived from the redder lines in individual stars in our sample.
We compare our derived Pb, Th, and 12C/13C for four stars with previous high-resolution analyses in Table 6. Pb abundances have been derived previously for only two of the five stars in which we derived a Pb abundance, and in both cases we agree within the uncertainties. Our Th abundances in BD17 3248, CS 22892–052, CS 29491–069, and HE 1219–0312 are in good agreement with previous studies. The previously reported Th abundances in HD 6268, HD 115444, and HD 186478 exhibit a great degree of scatter, but our abundances are consistent with these measurements.
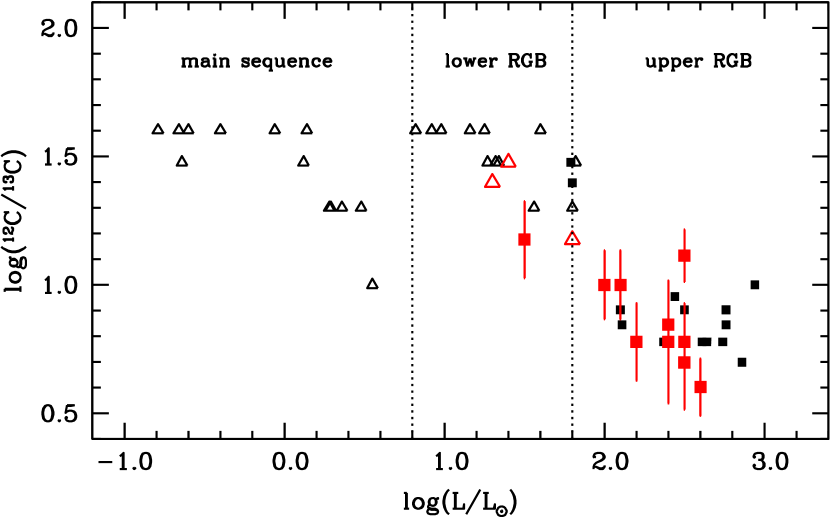
Figure 3 compares our 12C/13C ratios with those derived in Gratton et al. (2000) for metal-poor stars on the main sequence, lower red giant branch (RGB), and upper RGB. The individual luminosities for stars in our sample are also shown in Table 5. The majority of stars in our sample lie on the upper RGB and all have 12C/13C in good agreement with the Gratton et al. (2000) stars at similar luminosities. The dredge-up processes that moderate the decreasing 12C/13C ratio with increasing luminosity have no effect on the -capture abundances in these stars.
To explore the systematic uncertainties present when mixing abundances from different studies, we have compared the log (Eu) abundance and log (La/Eu) ratio derived in the present study to Honda et al. (2004) (5 stars in common), Sneden et al. (2009) (3 stars), Aoki & Honda (2008) (2 stars), and Hayek et al. (2009) (2 stars). Sneden et al. (2009) used the same spectra, model atmosphere grid and parameters, and analysis code to derive abundances as we have, differing only in the list of lines and the “human element” present when different investigators make the same measurement. Hayek et al. (2009) used the same spectra and model atmosphere parameters as we have, differing in all other components. Honda et al. (2004) and Aoki & Honda (2008) have used the same grid of model atmospheres as we have, but we have no other components of our analysis in common. All five of these studies employed spectral synthesis techniques to derive the abundances of La and Eu.
We find negligible offsets with respect to Sneden et al. (2009), log (Eu) and log (La/Eu) . We find moderate and significant offsets with respect to Honda et al. (2004), Aoki & Honda (2008), and Hayek et al. (2009) in log (Eu), , , and dex, respectively. This is not unexpected given all of the different components that enter into the derivation of an elemental abundance. What is surprising, perhaps, is that significant differences are also found when comparing the log (La/Eu) ratio, which should be largely insensitive to differences in the model atmosphere grid and parameters. The differences are largest with respect to Honda et al. (2004) and Aoki & Honda (2008), and , respectively; a smaller difference is found when comparing with Hayek et al. (2009), . This suggests, perhaps, that a significant source of the difference arises from the lines used and the algorithm for reduction and continuum normalization of the stellar spectrum, although one should be somewhat cautious about over-interpreting these differences with only two stars in common between our study and each of Aoki & Honda (2008) and Hayek et al. (2009).
4. The -Process Nature of Our Sample
In order to correctly interpret the Th/Pb ratios in these stars, it is important to demonstrate that the -process has been the only source of their -capture material. Even small contributions from the -process will very easily bias the derived Pb abundances in -process enriched stars. At low metallicity, an increase in the Pb abundance is one of the earliest signatures of -process nucleosynthesis. Th can only be produced in the -process and is unaffected by -process contributions.
The equivalence between the relative distributions of abundances for 56 79 and the predicted -process contribution to these species’ abundances in S.S. material, seen in a growing number of metal-poor stars, is clear evidence that the -process has been the only significant source of -capture material in these stars (Sneden et al., 2008, 2009). These stars include BD17 3248 (Cowan et al., 2002), CS 22892–052 (Sneden et al., 1996, 2003), CS 31082–001 (Hill et al., 2002), HD 115444 (Westin et al., 2000), HD 221170 (Ivans et al., 2006), and HE 1523–0901 (Frebel et al., 2007). Sneden et al. (2009) have recently remeasured and/or updated the rare earth (i.e., 57 72) abundances in five of these stars. Since the Th and U abundances of CS 31082–001 are enhanced relative to the rare earths, for now we will exclude this star from the set of standards. A complete chemical analysis of HE 1523–0901 is underway (A. Frebel et al., in preparation). We accept the remaining four stars as the template for “standard” -process enrichment.
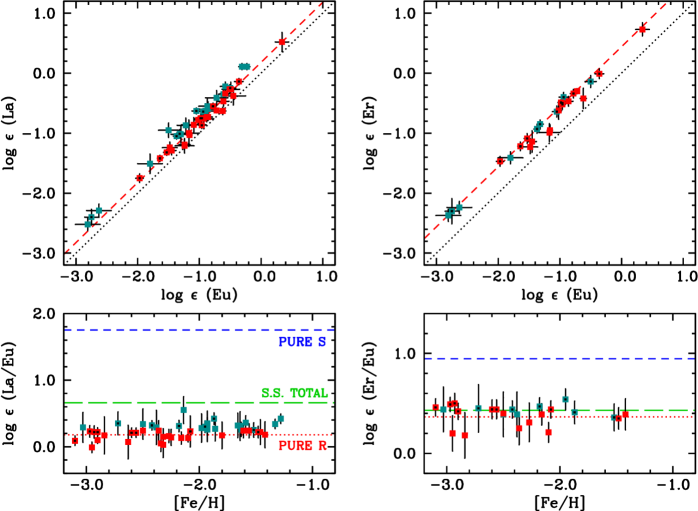
In the -process, the La/Eu ratio is 1.5, whereas in the -process the La/Eu ratio is 56. In S.S. material, about 69% of the La originated in the -process, whereas only about 5% of the Eu originated in the -process (Sneden et al. 2008, with updates from Gallino). Furthermore, La and Eu are two elements with multiple absorption features in the spectra of metal-poor stars, and the values for these transitions are well-known, so their abundances can be derived with minimal line-to-line scatter. The La/Eu ratio is an excellent discriminant of the relative amounts of - and -process material present in these stars. In Figure 4 we show the La/Eu ratios as a function of [Fe/H] for our entire sample. For comparison, the pure -process and pure -process nucleosynthesis predictions for the La/Eu ratio and the S.S. ratio are also shown.
It is clear that the measured La/Eu ratios in these stars lie close to the pure -process predictions—but how close? The mean log (La/Eu) ratio for the four standard stars is (), ranging from 0.09 (CS 22892–052) to 0.23 (BD17 3248). We conservatively estimate that any star with log (La/Eu) has a non-negligible amount of -process material present. Assuming log (La/Eu) and log (La/Eu), this limit identifies stars with no more than 0.5–1.0% of their -capture material originating in the -process. This explicitly assumes that the four -process standard stars contain no amount of -process material. The range and uncertainties of the La/Eu ratios in these stars set the limit of our ability to determine this percentage. Even if the actual pure -process La/Eu ratio was 0.1 dex lower than our mean—roughly equivalent to the La/Eu ratio in CS 22892–052, which has the lowest La/Eu ratio of any of our standard stars—this limit would still represent only a 1.1% contribution from the -process. According to this definition, 27 stars in our sample have been enriched by only the -process, which we refer to as the “-process-only” sample for the remainder of this paper.
Elemental abundances for -capture elements are usually sums over multiple naturally-occurring isotopes of these species. Sneden et al. (2002), Aoki et al. (2003), Lundqvist et al. (2007), and Roederer et al. (2008) have shown that several of the stars in our -process-only sample have samarium and Eu isotopic mixes consistent with -process nucleosynthesis. This lends further credibility to our assertion that the -capture material in stars in our sample originated only in the -process.
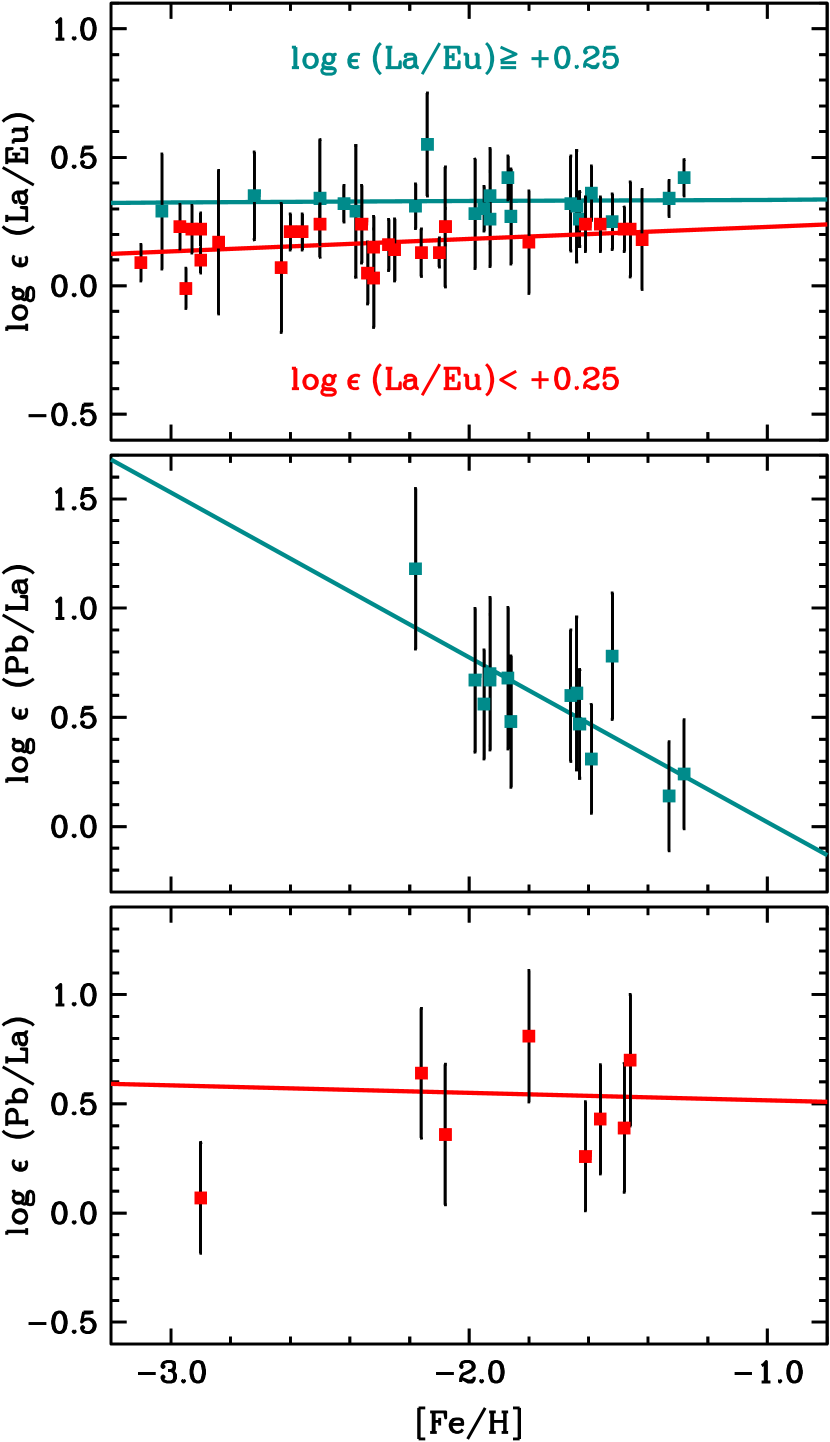
Now consider the stars in our sample with just a small amount of -process material, those with log (La/Eu) . The La/Eu, Pb/Eu, and Pb/La abundances for these stars are shown in Figure 5. While the La/Eu ratio shows no evolution with [Fe/H], the Pb/La ratio displays a marked increase with decreasing metallicity. This demonstrates that when the -process operates at low metallicity a relatively large amount of material accumulates at the 3rd -process peak due to the higher neutron-to-seed ratio. Furthermore, this effect is noticeable in stars where only 2.0% of the -capture material originated in the -process (as determined from the La/Eu ratios of the stars with Pb/La ratios displayed in the middle panel of Figure 5). In contrast, in stars with log (La/Eu) the Pb/La ratio displays no trend with metallicity. The combination of these two facts reinforces our assertion that by choosing log (La/Eu) we have identified a sample of stars that are free of any detectable traces of -process enrichment.
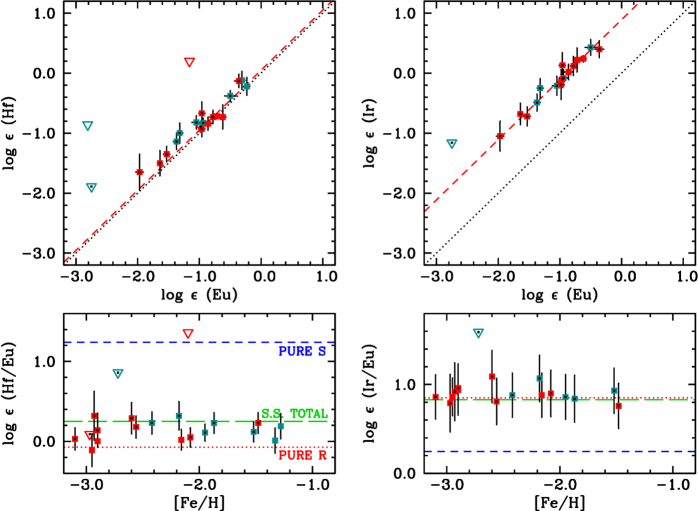
In Figures 4 and 6 we examine the Er/Eu, Hf/Eu, and Ir/Eu ratios. By comparing these abundance ratios to those found in the four -process standard stars—whose compositions have been analyzed in excruciating detail for all of the -capture species with accessible transitions—we can further characterize and establish the -process-only nature of our sample. Stars with a hint of -process material (identified by their La/Eu ratios) are marked in blue, and stars with only -process material are marked in red. The /Eu ratios in stars with an -process-only signature are consistent with a single value. The mean stellar Hf/Eu ratio differs somewhat from the predicted -process-only ratio, suggesting that the predicted S.S. breakdown for Hf may need minor revisions (Lawler et al. 2007, Sneden et al. 2009; see further discussion in § 6). The mean ratios for the -process-only stars are listed in Table 7. The /Eu ratios are constant for La ( 139), Er ( 162–170), Hf ( 174–180), and Ir ( 191–193), extending through the entirety of the rare earths and to the 3rd -process peak.
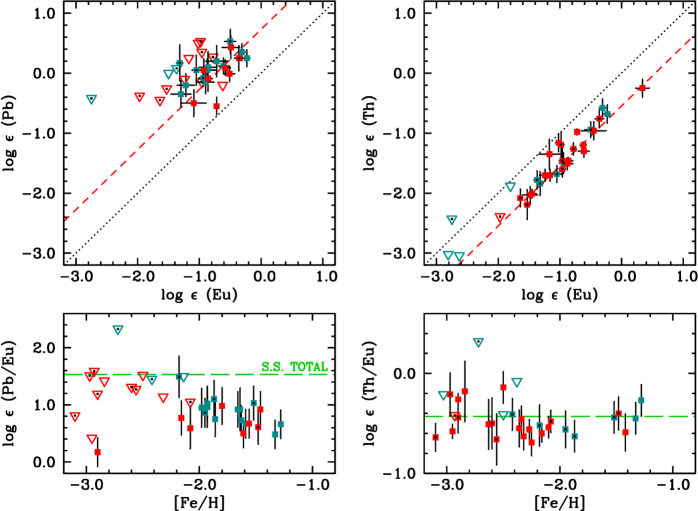
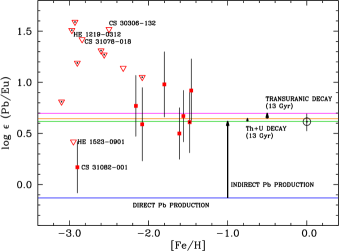
Figure 7 displays the Pb/Eu and Th/Eu ratios. The Th/Eu ratio for nearly all stars is consistent with a single value over the entire metallicity range of the measurements. This remarkable correlation is not just seen in the field stars, but also in globular clusters and one star in a dSph system. Despite our efforts to detect Pb in low-metallicity stars enriched by the -process, only one convincing detection exists below [Fe/H] , CS 31082–001 ([Fe/H] , Plez et al. 2004). HE 1523–0901 ([Fe/H] , Frebel et al. 2007) has a Th/Eu ratio consistent with the standard -process-only stars, yet the Pb upper limit derived by Frebel et al. (2007) indicates that the Pb in this star lies at least 0.3 dex below the -process value seen in the -process-enriched stars with [Fe/H] . CS 22892–052 ([Fe/H] , Sneden et al. 2003) has a Pb upper limit that is nearly identical to the Pb abundance found in the stars with [Fe/H] . These three stars have approximately the same metallicity and high levels of -process enrichment ([Eu/Fe] , 1.8, and 1.6, respectively). For the majority of metal-poor stars with known Pb and Th abundances, the -process pattern appears to continue to the actinides as well. A few notable exceptions are discussed in Section 5.
5. Nucleosynthesis of Pb and Th in the -process
Four stars in the -process-only sample have Th/Eu ratios elevated by 0.3–0.4 dex relative to the other stars in the -process-only sample: CS 30306–132, CS 31078–018, CS 31082–001, and HE 1219–0312. This “actinide boost” (Schatz et al., 2002) describes the enhanced Th (and, in CS 31082–001, U) abundance ratio(s) relative to the rare earth elements. All four stars have metallicities in the range [Fe/H] and have high levels of -process enrichment ([Eu/Fe] , including three with [Eu/Fe] ), but several other stars with no actinide boost also have similar levels of -process enrichment (e.g., CS 22892–052 and HE 1523–0901). The distinction between these four stars and the remainder of the -process sample is rather clean, with no stars having log (Th/Eu) .
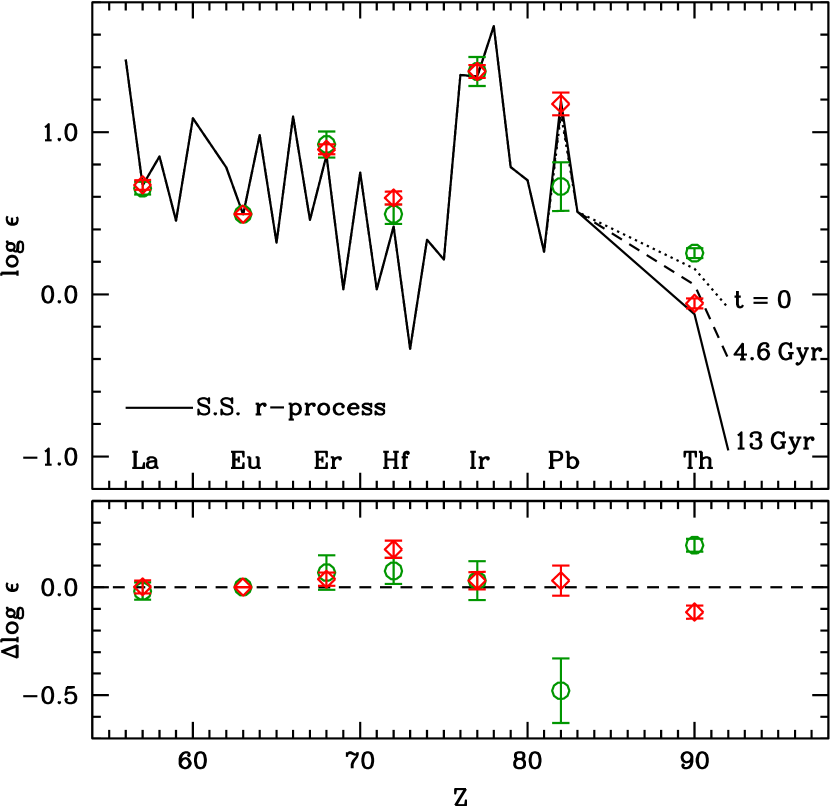
In Figure 8 we compare the mean abundances of these four stars to those of the other -process-only stars (also see Table 7). The S.S. -process pattern is shown for reference. The abundances are normalized to the S.S. Eu abundance. The mean La, Er, and Ir abundances between the two groups are identical; the mean Hf abundance in stars with the actinide boost is determined from only one star, so we do not regard the 0.10 dex discrepancy as significant. The mean Pb abundance in stars with the actinide boost is also derived from only one star, but it differs from the mean of the standard -process-only stars by 0.51 dex. The abundances of the stars with the actinide boost are identical to the abundances of the stars without an actinide boost from the rare earth domain to the 3rd -process peak; any differences in the nucleosynthetic process(es) that produced their -capture material affect—at most—only the region beyond the 3rd -process peak.
In Figure 9 we show Pb/Eu ratios for the -process-only sample. These stellar ratios are compared with our predictions, made using the classical waiting-point assumption—defined as an equilibrium condition between neutron captures and photodisintegrations—for the -process, employing the Extended Thomas-Fermi nuclear mass model with quenched shell effects far from stability (i.e., ETFSI-Q, Pearson et al. 1996). Although this approach makes the simplifying assumptions of constant neutron number density and temperature as well as instantaneous nuclear freezout, the equilibrium model calculations reproduce the S.S. abundances well; see, e.g., Kratz et al. (1993), Cowan et al. (1999), Freiburghaus et al. (1999), Pfeiffer et al. (2001), and Kratz et al. (2007a). These calculations are model-independent and look only at the astrophysical conditions that lead to the -process and reproduce the S.S. -process abundances. These waiting point calculations have been confirmed by more detailed dynamic (i.e., non-equilibrium) network calculations (Farouqi et al., 2009). Our approach can be considered reliable only if we achieve a “consistent” picture—meaning that the abundances are solar—with logical astrophysical assumptions for the three heaviest -process “observables;” i.e., the 3rd peak, the Pb-Bi spike and the Th, U abundances.
The specific calculations employed here assume a weighted range of neutron number densities (from 1023 to 1030 cm-3) and are designed to reproduce the total -process isotopic S.S. abundance pattern (see Kratz et al. 2007a for more details). The best agreement with this abundance pattern, as well as with the elemental abundances in metal-poor halo stars, is obtained by employing the nuclear mass predictions—many of the nuclei involved in this process are too short-lived to be experimentally measured at this time—of the ETFSI-Q nuclear mass model. We employed the -decay properties from quasi-particle random-phase approximation calculations for the Gamow-Teller transitions (see Möller & Randrup 1990; Möller et al. 1997) and the first-forbidden strength contributions from the Gross theory of -decay (Möller et al. 2003). We find that a small number of individual neutron density components (in the current calculations, 15 components) is necessary to fit the predicted -process abundances to the S.S. values, and we also assume a varying -process path related to contour lines of constant neutron separation energies in the range of 4–2 MeV. (This path is determined by the variations of the neutron number density and the temperature).
The nuclear data for these calculations have been improved by incorporating recent experimental results and improved theoretical predictions. Analyses of the differences between measured and predicted nuclear parameters (e.g., -decay properties) indicate considerable improvements over earlier attempts. This gives us confidence in the reliability of our nuclear physics input to the -process calculations of the heavy element region between the rare earth elements, via the 3rd-peak elements (Os, Ir, Pt), the Pb and Bi isotopes, and up to Th and U. In addition the excellent agreement between these calculations and the S.S. isotopic and elemental abundances suggests that this approach can reproduce the astrophysical and nuclear conditions appropriate for the -process despite not knowing the astrophysical site for this process (Kratz et al., 2007a). For this paper the theoretical predictions have been normalized to the -process component (95%) of the S.S. Eu abundance (Lodders, 2003).
The predicted Pb abundance shown in Figure 9 is broken into four components corresponding to its origin within the -process. “Direct production” refers to Pb that is produced in the -process as nuclei with 206, 207, or 208, each of which will decay directly to one of the stable Pb isotopes. “Indirect production” refers to Pb that is produced from the and decay of nuclei with and 234 shortly after the termination of the -process (i.e., within a few years). “Th and U decay” refers to Pb that originates from the decay of nuclei that were produced in the -process with 232, 235, or 238, which quickly decayed to 232Th, 235U, and 238U, which have since decayed to the stable Pb isotopes. In Figure 9 we show the Pb abundance after 13 Gyr. “Transuranic decay” refers to Pb that is produced from the decay of 232Th, 235U, and 238U, but now considering the fractions of the abundances of these three isotopes that were formed in the -process as nuclei with 236 and , which followed and decay chains to the long-lived Th and U isotopes.
The abundance predictions for Pb, Th, and U, computed at time “zero” after all of the and decays are complete ( years after the -process event) are listed in Table 8. According to these predictions, the majority of the -process Pb abundance derives from indirect production of short-lived nuclei between Pb and Th (82% at time “zero”). Only a small amount of the present-day Pb originated from the decay of the long-lived Th and U isotopes. The predicted total Pb/Eu ratio, based upon our waiting-point -process calculations as described above, is in agreement with the derived Pb/Eu ratios in all of the stars with [Fe/H] , independent of the amount of time since the -process nucleosynthesis event. This implies that fission losses from nuclei with and 234 are not significant, otherwise the predicted total Pb abundance would be noticeably lower. These results, based upon detailed fits that reproduce the total S.S. isotopic abundance distribution, are supported by recent dynamic calculations (see, e.g., Farouqi et al. 2009), which also indicate that the total amount of fission material in this mass range will be insignificant and not affect the Pb to Th and U region. An additional argument regarding the lack of any appreciable effects of fission comes from recent fission barrier height calculations of Möller (2009, private communication), who finds that any fissioning isotopes in the mass region 206 232–238—if they exist at all—lie well beyond the -process path in our model predictions (i.e., in isotopes more neutron-rich than the -process path and closer to the neutron drip line). Any fissioning isotopes would not normally contribute to the abundances in the Pb region (even if they did not fission). Our results also indicate that any fissioning nuclei in the mass region 232–238 250–256 make no significant contributions to the stable heavy isotopes.
We emphasize here that our approach has been to fit the observed S.S. isotopic (and elemental) abundance distribution with the superposition of the neutron number density exposures that occur in the -process. These calculations are further strengthened by utilizing the most comprehensive set of nuclear data currently available—including experimentally measured and theoretically determined (published and unpublished ETFSI-Q) masses, -decay half-lives, and -capture rates. Our normal procedure has been to globally fit the S.S. abundances, particularly normalizing the fit to the 2nd and 3rd process peaks. In addition to employing these global fits we have also fine-tuned our theoretical calculations to reproduce the complete S.S. 3rd abundance peak in the mass range of Os ( 186) to Hg ( 204). It has long been argued that the production of the radioactive elements extending upwards from Pb to Th and U and the heaviest stable elements in the 3rd -process peak are correlated (Cowan et al., 1991; Thielemann et al., 1993; Cowan et al., 1999; Kratz et al., 2004, 2007a). Only the correct reproduction of the 195 abundance peak with its 126 (nuclear) bottle-neck behavior will guarantee that the extrapolated abundances into the experimentally (completely) unknown -process trans-Pb region, including exotic isotopes about 30–40 units away from the known “valley of the isobaric mass parabolae,” will be reliable.
The excellent agreement between the -process Pb abundances in stars with [Fe/H] and our predictions is encouraging. Assuming the stellar Pb abundances are not seriously in error, we currently lack a complete, self-consistent understanding of -process nucleosynthesis and enrichment for all low metallicity stars. Both CS 31082–001 and HE 1523–0901 have similar metallicities and levels of -process enrichment. Their U/Th ratios are similar, and their Pb abundances may be similar to one another (yet different from more metal-rich -process-enriched stars). Their Th/Eu ratios are different from one another, yet the Th/Eu ratio in HE 1523–0901 agrees with most other metal-poor stars, while CS 31082–001 does not. (See further discussion in Frebel & Kratz 2009.) A still larger set of -process-enriched stars with [Fe/H] will be necessary to characterize the abundance patterns of Pb, Th, and U at low metallicity, and until that time (at least) our understanding of the nucleosynthesis of the heaviest products of the -process will remain incomplete.
6. Stellar Ages
When deriving stellar ages through nuclear chronometry, the measured ages reflect the ages of the actinides in these stars but not necessarily the ages of the stars themselves. In addition, a few -process events may have seeded the ISM from which these stars formed. Presumably the stars formed shortly after the -process material was created and so the derived age represents an upper limit to—but also a realistic estimate of—the stellar age.
U/ ratios (where denotes a stable element produced in the same -process event as the U) have the strongest predictive power (0.068 dex per Gyr), followed by U/Th (0.046 dex per Gyr), and Th/ (0.021 dex per Gyr). These rates are only governed by the nuclear half-lives of the radioactive isotopes, which have been measured to exquisite precision as far as stellar nuclear chronometry is concerned. Strictly speaking, the Pb/ (or U/Pb, or Th/Pb) ratio is also a chronometer, since the Pb abundance increases with time as the Th and U decay, but it loses sensitivity as time passes and most of the Th and U nuclei decay. According to our model, 90% of the total increase in the Pb abundance has already occurred in the first 5 Gyr after the -process event, and the total (i.e., ) Pb abundance is only 0.10 dex higher than its time “zero” abundance.
Stellar abundance ratios are rarely known to better than 0.05–0.10 dex, limiting relative age determinations from one star to another using a single Th/ pair to a precision of 3–5 Gyr. To some degree this can be mitigated by employing multiple Th/ pairs, but uncertainties in the production ratios and uncertainties arising from systematic effects (e.g., determination of effective temperature) will limit the measurement of an absolute age to no better than 2–3 Gyr (see, e.g., Sneden et al. 2000 or Frebel et al. 2007).
Figure 10 illustrates these points by showing the ages derived for our -process-only sample from Th/Eu, Th/Hf, Pb/Th, and U/Th chronometers.222 The element Hf has recently been suggested as a promising, stable -process reference element. Lundqvist et al. (2006) and Lawler et al. (2007) have made new laboratory evaluations of Hf ii transition probabilities, and there are indications that Hf may be formed at similar neutron densities to the 3rd -process peak elements Os, Ir, and Pt (Kratz et al., 2007a). These elements are difficult to reliably measure in stellar spectra obtained from ground-based facilities (except for Ir) and can only be observed in their neutral states. In other words, Hf may be the heaviest stable singly-ionized element whose production is closely linked to that of the actinides and may be reliably and easily measured in metal-poor stars. Our model predicts an -process Hf abundance of 0.0436 (26% of the S.S. value of 0.1699 for 174–180, Lodders 2003). The isotopic and elemental Hf -process abundance predictions by our model are consistently smaller than those inferred from the S.S. -process residual method. We caution that knowledge of the nuclear structure of atoms is incomplete for isotopes near 180, in the transition from the deformed rare earth isotopes to the spherical 126 magic shell. The offset between the scaled S.S. and stellar -process Hf abundances noticed by Lawler et al. (2007) and Sneden et al. (2009) suggests that a larger fraction of the S.S. Hf abundance might be attributed to the -process. That study adopted the S.S. Hf -process fraction (44%) from Arlandini et al. (1999), implying that the S.S. -process fraction is even higher than 44%. If we reverse the problem and assume that the stellar Hf/Eu -process ratio from Sneden et al. (2009) should match the S.S. Hf/Eu -process ratio, we estimate the -process fraction of Hf in the S.S. is 7010%. Our results are consistent with the assertion that -process enrichment began extremely early, within the first few Gyr after the big bang. The horizontal lines indicating ages are determined based on the production ratios given in Kratz et al. (2007a). Using a different set of production ratios (e.g., Cowan et al. 1999, Schatz et al. 2002, or those predicted by our stellar sample) would only change the absolute scale of these age determinations by small amounts ( 2–4 Gyr; see Frebel et al. 2007).
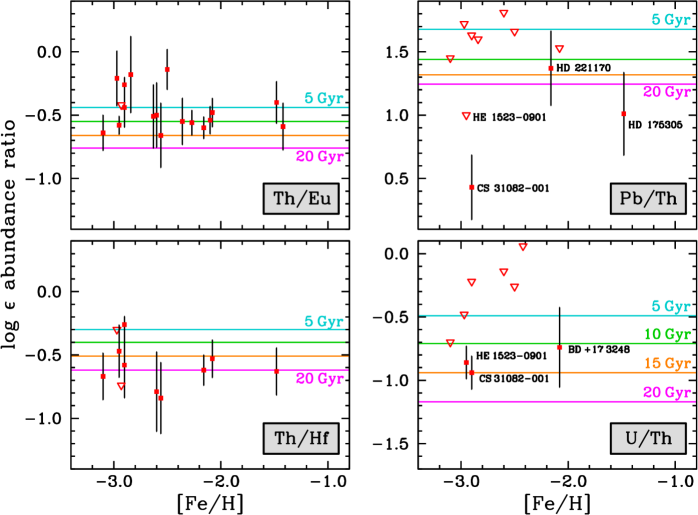
This is the largest sample of Th/Eu ratios yet compiled for metal-poor halo stars. The chronometer pairs in an individual star have limited ability to predict its age, but the combined measurements from an ensemble of stars hold greater promise. The majority of our sample suggests an old population (the exception being the four stars with an actinide boost), and no trends with metallicity are apparent. This is in agreement with model predictions for the age-metallicity relationship in metal-poor halo stars, where a rapid increase is found in the mean metallicity to [Fe/H] 2.0 within the first 2 Gyr (e.g., Argast et al. 2000). If we divide the sample into two groups of stars—those with an actinide boost and those without—and assume a single age for each group, we can derive reasonable estimates for the age of the -process-only standard stars, as shown in Table 9. Assuming that the observed stellar ratios are independent (which they clearly are not since all rely on Th),333 A change in the Th abundance by 0.05 dex will uniformly change the derived age by 2.3 Gyr. The uncertainty on the age derived from each chronometer pair is computed by combining in quadrature the error of the mean stellar ratio, an assumed 20% uncertainty in the production ratio, and the uncertainty in the abundances arising from uncertainties in the stellar parameters. For this final source of error, we consider the uncertainties derived by Frebel et al. (2007) for HE 1523–0901 to be representative of the uncertainties for an individual star in our sample, and we reduce each of their uncertainties by the amount expected when increasing the sample size from one star to several. We derive an age for the ensemble of standard -process-only stars of 15.22.1 (=4.6) Gyr. Two ratios predict ages significantly greater than the age of the Universe, Th/La (20.44.2 Gyr) and Th/Hf (19.74.7 Gyr). If we adopt the higher S.S. -process “residual” abundances for La and Hf (e.g., Sneden et al. 2008, with updates from Gallino), the Th/La and Th/Hf ages decrease by 13 and 3 Gyr, respectively.
The four stars with an actinide boost reflect a very different age, 1.32.1 (=4.6) Gyr. In CS 31082–001, where abundances of both Th and U have been derived (Cayrel et al., 2001; Hill et al., 2002), the U/Th ratio implies a reasonable age of 14.22.4 (sys) Gyr (Hill et al., 2002). If we use the 238U/232Th production ratio computed from the data in Table 8 and assume a 20% uncertainty in this value, we derive an age of 15.14.3 Gyr in CS 31082–001. The low Pb abundance and high Th/ ratios in this star cannot be accounted for simply by assuming a very young age; increasing the current Pb abundance in this star by the maximum expected from the complete decay of the actinides (0.10 dex) would still leave it about 0.4 dex lower than the mean of the more metal-rich -process enriched stars. U has also been detected in two -process enhanced stars that do not have an actinide boost, BD17 3248 (Cowan et al., 2002) and HE 1523–0901 (Frebel et al., 2007), and the U/Th ages in these two stars are consistent with the U/Th age in CS 31082–001 (see Figure 10).
6.1. Comparison to Globular Cluster and dSph Age Estimates from Other Methods
Several stars in our sample are located in globular clusters or dSph systems, whose ages and star formation histories can be estimated based on other methods. M15 is an old (13.21.5 Gyr, McNamara et al. 2004), metal-poor ([Fe/H] ; Gratton et al. 2004) globular cluster. Sneden et al. (2000) derived abundances of several -capture elements in three giants in this cluster. The mean Th/Eu ratio for these three stars implies an age of 12.03.7 Gyr using our production ratio. M92 is also an old (14.83 Gyr, Carretta et al. 2000; 14.21.2 Gyr, Paust et al. 2007), metal-poor ([Fe/H] ; Gratton et al. 2004) globular cluster. Using the Th/Eu ratio derived by Johnson & Bolte (2001) for one star in this cluster, we find and age of 10.64.7 Gyr. Aoki et al. (2007) derived the Th/Eu ratio in one star in UMi, which implies an age of 12.06.5 Gyr. This result is consistent with the earlier finding that this system experienced only one significant episode of star formation at early times ( 11 Gyr ago; Dolphin 2002). In all three cases, the ages for these systems derived from nuclear chronometry and other independent methods agree within the uncertainties.
7. Implications for Nucleosynthesis in the Early Galaxy
One of the more remarkable aspects of the abundance ratios for -process-only stars in Figures 4, 6, and 7 is the wide range of Eu and Fe abundances covered by these correlations. The /Eu ratios are constant over a very wide range of absolute -process enrichment, roughly 2.4 dex or a factor of 250. All of the [/Eu] abundance ratios in these figures (with the noted exception of the [Pb/Eu] and [Th/Eu] ratios in the stars with an actinide boost) are unchanged over the metallicity range [Fe/H] . For these stars, the [Eu/Fe] ratios are always supersolar, but they vary widely, from 0.31 (M92 VII-18) to 1.82 (HE 1523–0901). This wide dispersion in -capture abundances at low metallicities has been previously noted by many investigators, including Gilroy et al. (1988) and Burris et al. (2000). Several stars with [Eu/Fe] exhibit an -process-only signature, which reveals—as might be expected—that a pure -process pattern can be found even in small amounts of -process enrichment. Furthermore, this same pattern is observed in stars in the Galactic halo, several globular clusters, and one dSph system. Taken together, these facts are strong evidence for the universal nature of the main -process for species with (as constrained by observations), since stars with log (Eu) dex certainly are comprised of the remnants of many more supernovae than stars with log (Eu) .
From an analysis of the La/Eu ratio in a sample of 159 stars with [Fe/H] , Simmerer et al. (2004) found stars with [Fe/H] exhibiting signatures of the -process, while other stars as metal-rich as [Fe/H] showed little evidence of any -process material. By the definition we adopt in Section 4, log (La/Eu), processes other than the -process (e.g., the so-called weak -process) must be responsible for some -capture material at even lower metallicity. Simmerer et al. (2004) also found incomplete mixing of both -process and -process material in stars with [Fe/H] . We find that the gas from which these stars formed was inhomogeneous at metallicities as high as [Fe/H] , the metal-rich limit of our sample; here, several stars show no evidence of any contributions from the -process. Furthermore, Roederer (2009) found no preferred kinematic signature for stars with pure -process or -process enrichment patterns, with these patterns extending over a wide metallicity range of [Fe/H] . This reinforces the notion that -capture enrichment at low metallicity is likely a very localized phenomenon that results in a large distribution of -capture abundances.
The range of absolute -process enrichment noted above includes 18 stars in M15. (Three stars from Sneden et al. 2000 are shown in Figure 4; additional stars from Sneden et al. 1997 and Otsuki et al. 2006, who did not report Th abundances, are not shown.) These 18 stars in a single globular cluster show no change in their Ba/Eu or La/Eu ratios despite a change in the absolute Eu enrichment level by 0.9 dex, a factor of 8; their Fe abundances differ by less than 0.2 dex, a factor of 1.5. Sneden et al. (1997) found no correlation between these -capture enrichment patterns in M15 and the signatures of deep mixing commonly observed in globular cluster stars, indicating a primordial origin. This enrichment pattern resembles that of the Galactic halo, but it is not obvious why other clusters enriched by -process material (with or without significant contributions from the -process) fail to show similar star-to-star dispersion.
8. Conclusions
We have identified a sample of 27 stars with [Fe/H] that have been enriched by the -process and show no evidence of -process enrichment. We confront -process nucleosynthesis predictions for Pb and Th with measurements (or upper limits) in our stellar sample. We use these very heavy isotopes located near the termination points of - and -process nucleosynthesis to better understand the physical nature of the -process and the onset of nucleosynthesis in the early Galaxy. Our major results can be summarized as follows.
Stars with log (La/Eu) (our “-process-only” sample, where more than 99% of the -capture material originated in the -process) show no evolution in their Pb/La ratio over the metallicity range [Fe/H] . In contrast, stars with log (La/Eu) (those with just a dusting of -process material on top of -process enrichment) show a significant increase in Pb/La with decreasing metallicity. This emphasizes the effect of the higher neutron-to-seed ratio that occurs in low metallicity -process environments and overproduces nuclei at the termination of the -process chain relative to lighter -process nuclei. This effect is noticeable in stars where only 2.0% of the -capture material originated in the -process.
All stars in our -process-only sample have constant abundance ratios among elements surveyed in the rare earth domain and the 3rd -process peak (La, Eu, Er, Hf, and Ir), and these abundance ratios are equivalent to the scaled S.S. -process distribution. These ratios are identical in stars with a so-called actinide boost and stars without. For stars with an actinide boost, our observations demonstrate that any nucleosynthetic deviations from the main -process affect—at most—only the elements beyond the 3rd -process peak (Pb, Th, and U).
We find very good agreement between the Pb abundances in our -process-only stars and the Pb abundances predicted by our classical “waiting-point” -process model. In these computations a superposition of 15 weighted neutron-density components in the range 23 log nn 30 is used to successfully reproduce both the S.S. isotopic distribution and the heavy element abundance pattern between Ba and U in the low-metallicity halo stars. Our calculations indicate that fission losses are negligible for nuclei along the -process path between Pb and the radioactive isotopes of Th and U. In light of this agreement, we currently have no viable theoretical explanation for the low Pb abundance in CS 31082–001.
With the exception of the Pb and Th in stars with an actinide boost, the /Eu ratios in our -process-only sample are constant over a wide range of metallicity ( [Fe/H] ) and -process enrichment ( log (Eu) or [Eu/Fe] ). This pattern is observed in field stars, several globular clusters, and one dSph system. As multiple supernovae will have contributed to the material in stars at the highest metallicities and/or -process enrichments surveyed, we regard this as strong evidence for the universal nature of the -process.
We have derived an age of 15.22.1 Gyr ( Gyr) from several Th/ chronometer pairs for an ensemble of 16 stars. This is the largest set of Th/ ratios yet compiled for metal-poor halo stars. Excluding the four stars with an actinide boost, there is no relationship between age and metallicity over the range [Fe/H] . While each stellar chronometer pair ratio argues for a single common age for the ensemble of stars, the observations call for further refinement of some production ratios, and the outlook for improving the precision of the age measurement for a single star in the field is not hopeful. For two globular clusters and one dSph system, we do find good agreement (within uncertainties 3.5–5 Gyr) between ages derived from the Th/Eu nuclear chronometer and ages derived from other methods.
References
- Aoki et al. (2002) Aoki, W., Ryan, S. G., Norris, J. E., Beers, T. C., Ando, H., & Tsangarides, S. 2002, ApJ, 580, 1149
- Aoki et al. (2003) Aoki, W., Honda, S., Beers, T. C., & Sneden, C. 2003, ApJ, 586, 506
- Aoki et al. (2007) Aoki, W., Honda, S., Sadakane, K., & Arimoto, N. 2007, PASJ, 59, L15
- Aoki et al. (2008) Aoki, W., et al. 2008, ApJ, 678, 1351
- Aoki & Honda (2008) Aoki, W., & Honda, S. 2008, PASJ, 60, L7
- Argast et al. (2000) Argast, D., Samland, M., Gerhard, O. E., & Thielemann, F.-K. 2000, A&A, 356, 873
- Argast et al. (2004) Argast, D., Samland, M., Thielemann, F.-K., & Qian, Y.-Z. 2004, A&A, 416, 997
- Arlandini et al. (1999) Arlandini, C., Käppeler, F., Wisshak, K., Gallino, R., Lugaro, M., Busso, M., & Straniero, O. 1999, ApJ, 525, 886
- Arnould et al. (2007) Arnould, M., Goriely, S., & Takahashi, K. 2007, Phys. Rep., 450, 97
- Audi et al. (2003) Audi, G., Bersillon, O., Blachot, J., & Wapstra, A. H. 2003, Nucl. Phys. A, 729, 3
- Beer et al. (2001) Beer, H., et al. 2001, Hadrons, Nuclei, and Applications. World Scientific, Singapore, 372
- Biémont et al. (2000) Biémont, E., Garnir, H. P., Palmeri, P., Li, Z. S., & Svanberg, S. 2000, MNRAS, 312, 116
- Burbidge et al. (1957) Burbidge, E. M., Burbidge, G. R., Fowler, W. A., & Hoyle, F. 1957, Reviews of Modern Physics, 29, 547
- Burris et al. (2000) Burris, D. L., Pilachowski, C. A., Armandroff, T. E., Sneden, C., Cowan, J. J., & Roe, H. 2000, ApJ, 544, 302
- Busso et al. (1999) Busso, M., Gallino, R., & Wasserburg, G. J. 1999, ARA&A, 37, 239
- Busso et al. (2001) Busso, M., Gallino, R., Lambert, D. L., Travaglio, C., & Smith, V. V. 2001, ApJ, 557, 802
- Carretta et al. (2000) Carretta, E., Gratton, R. G., Clementini, G., & Fusi Pecci, F. 2000, ApJ, 533, 215
- Cayrel et al. (2001) Cayrel, R., et al. 2001, Nature, 409, 691
- Chen et al. (1995) Chen, B., et al. 1995, Phys. Lett. B., 355, 37
- Christlieb et al. (2004) Christlieb, N., et al. 2004, A&A, 428, 1027
- Clayton & Rassbach (1967) Clayton, D. D., & Rassbach, M. E. 1967, ApJ, 148, 69
- Clayton (1988) Clayton, D. D. 1988, MNRAS, 234, 1
- Cowan et al. (1991) Cowan, J. J., Thielemann, F.-K., & Truran, J. W. 1991, ARA&A, 29, 447
- Cowan et al. (1991a) Cowan, J. J., Thielemann, F.-K., & Truran, J. W. 1991a, Phys. Rep., 208, 267
- Cowan et al. (1999) Cowan, J. J., Pfeiffer, B., Kratz, K.-L., Thielemann, F.-K., Sneden, C., Burles, S., Tytler, D., & Beers, T. C. 1999, ApJ, 521, 194
- Cowan et al. (2002) Cowan, J. J., et al. 2002, ApJ, 572, 861
- Cowan & Thielemann (2004) Cowan, J. J., & Thielemann, F.-K. 2004, Physics Today, 57, 47
- Cowan et al. (2005) Cowan, J. J., et al. 2005, ApJ, 627, 238
- Cowan & Sneden (2006) Cowan, J. J., & Sneden, C. 2006, Nature, 440, 1151
- Cristallo et al. (2009) Cristallo, S., Straniero, O., Gallino, R., Piersanti, L., Dominguez, I., & Lederer, M. T. 2009, ApJ, in press, arXiv:astro-ph/0902.0243
- Den Hartog et al. (2003) Den Hartog, E. A., Lawler, J. E., Sneden, C., & Cowan, J. J. 2003, ApJS, 148, 543
- Dolphin (2002) Dolphin, A. E. 2002, MNRAS, 332, 91
- Farouqi et al. (2009) Farouqi, K., Kratz, K.-L., Mashonkina, L. I., Pfeiffer, B., Cowan, J. J., Thielemann, F.-K., & Truran, J. W. 2009, ApJ, 694, L49
- Frebel et al. (2007) Frebel, A., Christlieb, N., Norris, J. E., Thom, C., Beers, T. C., & Rhee, J. 2007, ApJ, 660, L117
- Frebel & Kratz (2009) Frebel, A. & Kratz, K.-L. 2009, IAU Symposium 258: The Ages of Stars, submitted
- Freiburghaus et al. (1999) Freiburghaus, C. et al. 1999, ApJ, 516, 381
- Fuhr & Wiese (2006) Fuhr, J. R., & Wiese, W. L. 2006, J. Phys. Chem. Ref. Data, 35, 1669
- Gallino et al. (1998) Gallino, R., Arlandini, C., Busso, M., Lugaro, M., Travaglio, C., Straniero, O., Chieffi, A., & Limongi, M. 1998, ApJ, 497, 388
- Gilroy et al. (1988) Gilroy, K. K., Sneden, C., Pilachowski, C. A., & Cowan, J. J. 1988, ApJ, 327, 298
- Goriely & Siess (2001) Goriely, S., & Siess, L. 2001, A&A, 378, L25
- Gratton et al. (2000) Gratton, R. G., Sneden, C., Carretta, E., & Bragaglia, A. 2000, A&A, 354, 169
- Gratton et al. (2004) Gratton, R., Sneden, C., & Carretta, E. 2004, ARA&A, 42, 385
- Hayek et al. (2009) Hayek, W., Wiesendahl, U., Christlieb, N., Eriksson, K., Korn, A. J., Barklem, P. S., Hill, V., Beers, T. C., Ryan, S. G., Kratz, K.-L., Pfeiffer, B., & Farouqi, K. 2009, A&A, submitted
- Hill et al. (2002) Hill, V., et al. 2002, A&A, 387, 560
- Honda et al. (2004) Honda, S., Aoki, W., Kajino, T., Ando, H., Beers, T. C., Izumiura, H., Sadakane, K., & Takada-Hidai, M. 2004, ApJ, 607, 474
- Ivans et al. (2005) Ivans, I. I., Sneden, C., Gallino, R., Cowan, J. J., & Preston, G. W. 2005, ApJ, 627, L145
- Ivans et al. (2006) Ivans, I. I., Simmerer, J., Sneden, C., Lawler, J. E., Cowan, J. J., Gallino, R., & Bisterzo, S. 2006, ApJ, 645, 613
- Ivarsson et al. (2003) Ivarsson, S., et al. 2003, A&A, 409, 1141
- Johnson & Bolte (2001) Johnson, J. A., & Bolte, M. 2001, ApJ, 554, 888
- Johnson (2002) Johnson, J. A. 2002, ApJS, 139, 219
- Jonsell et al. (2006) Jonsell, K., Barklem, P. S., Gustafsson, B., Christlieb, N., Hill, V., Beers, T. C., & Holmberg, J. 2006, A&A, 451, 651
- Kȩpa et al. (1996) Kȩpa, R., Para, A., Mytel, M., & Zachwieja, M. 1996, J. Mol. Spectrosc., 178, 189
- Kratz et al. (1993) Kratz, K.-L., Bitouzet, J.-P., Thielemann, F.-K., Moeller, P., & Pfeiffer, B. 1993, ApJ, 403, 216
- Kratz et al. (2004) Kratz, K.-L., Pfeiffer, B., Cowan, J. J., & Sneden, C. 2004, New Astronomy Review, 48, 105
- Kratz et al. (2007a) Kratz, K.-L., Farouqi, K., Pfeiffer, B., Truran, J. W., Sneden, C., & Cowan, J. J. 2007a, ApJ, 662, 39
- Kratz et al. (2007b) Kratz, K.-L. et al. 2007b, Prog. Particle and Nucl. Physics, 59, 147
- Kurucz (1993) Kurucz, R. L. 1993, Kurucz CD-ROM 13, ATLAS9 Stellar Atmosphere Programs and 2 km/s Grid (Cambridge: SAO)
- Lai et al. (2008) Lai, D. K., Bolte, M., Johnson, J. A., Lucatello, S., Heger, A., & Woosley, S. E. 2008, ApJ, 681, 1524
- Lattanzio & Lugaro (2005) Lattanzio, J. C., & Lugaro, M. A. 2005, Nuclear Physics A, 758, 477
- Lawler et al. (1990) Lawler, J. E., Whaling, W., & Grevesse, N. 1990, Nature, 346, 635
- Lawler et al. (2001a) Lawler, J. E., Bonvallet, G., & Sneden, C. 2001a, ApJ, 556, 452
- Lawler et al. (2001b) Lawler, J. E., Wickliffe, M. E., den Hartog, E. A., & Sneden, C. 2001b, ApJ, 563, 1075
- Lawler et al. (2007) Lawler, J. E., Hartog, E. A. D., Labby, Z. E., Sneden, C., Cowan, J. J., & Ivans, I. I. 2007, ApJS, 169, 120
- Lawler et al. (2008) Lawler, J. E., Sneden, C., Cowan, J. J., Wyart, J.-F., Ivans, I. I., Sobeck, J. S., Stockett, M. H., & Den Hartog, E. A. 2008, ApJS, 178, 71
- Lodders (2003) Lodders, K. 2003, ApJ, 591, 1220
- Lucatello et al. (2003) Lucatello, S., Gratton, R., Cohen, J. G., Beers, T. C., Christlieb, N., Carretta, E., & Ramírez, S. 2003, AJ, 125, 875
- Lundqvist et al. (2006) Lundqvist, M., Nilsson, H., Wahlgren, G. M., Lundberg, H., Xu, H. L., Jang, Z.-K., & Leckrone, D. S. 2006, A&A, 450, 407
- Lundqvist et al. (2007) Lundqvist, M., Wahlgren, G. M., & Hill, V. 2007, A&A, 463, 693
- Malaney (1986) Malaney, R. A. 1986, MNRAS, 223, 683
- May et al. (1974) May, M., Richter, J., & Wichelmann, J. 1974, A&AS, 18, 405
- McNamara et al. (2004) McNamara, B. J., Harrison, T. E., & Baumgardt, H. 2004, ApJ, 602, 264
- Möller & Randrup (1990) Möller, P., & Randrup, J. 1990, Nucl. Phys. A, 514, 1
- Möller et al. (1997) Möller, P., Nix, J. R., & Kratz, K.-L. 1997, At. Data Nucl. Data Tables, 66, 131
- Möller et al. (2003) Möller, P., Pfeiffer, B., & Kratz, K.-L. 2003, Phys. Rev. C, 67, 055802
- Morell et al. (1992) Morell, O., Kallander, D., & Butcher, H. R. 1992, A&A, 259, 543
- Nilsson et al. (2002) Nilsson, H., Zhang, Z. G., Lundberg, H., Johansson, S., & Nordström, B. 2002, A&A, 382, 368
- Norris et al. (1997) Norris, J. E., Ryan, S. G., & Beers, T. C. 1997, ApJ, 489, L169
- Otsuki et al. (2006) Otsuki, K., Honda, S., Aoki, W., Kajino, T., & Mathews, G. J. 2006, ApJ, 641, L117
- Paust et al. (2007) Paust, N. E. Q., Chaboyer, B., & Sarajedini, A. 2007, AJ, 133, 2787
- Pearson et al. (1996) Pearson, J. M., Nayak, R. C., & Goriely, S. 1996, Phys. Lett., B387, 455
- Pfeiffer et al. (2001) Pfeiffer, B., Kratz, K.-L., Thielemann, F.-K., & Walters, W. B. 2001, Nucl. Phys. A, 693, 282
- Plez et al. (2004) Plez, B., et al. 2004, A&A, 428, L9
- Ratzel et al. (2004) Ratzel, U., et al. 2004, Phys. Rev. C, 70, 065803
- Rauscher & Thielemann (2000) Rauscher, T. & Thielemann, F.-K. 2000, Atom. Data Nucl. Data Tables, 75, 1
- Roederer et al. (2008) Roederer, I. U., Lawler, J. E., Sneden, C., Cowan, J. J., Sobeck, J. S., & Pilachowski, C. A. 2008, ApJ, 675, 723
- Roederer (2009) Roederer, I. U. 2009, AJ, 137, 272
- Schatz et al. (2002) Schatz, H., Toenjes, R., Pfeiffer, B., Beers, T. C., Cowan, J. J., Hill, V., & Kratz, K.-L. 2002, ApJ, 579, 626
- Schatz (2008) Schatz, H. 2008, Physics Today, 61, 40
- Simmerer et al. (2004) Simmerer, J., Sneden, C., Cowan, J. J., Collier, J., Woolf, V. M., & Lawler, J. E. 2004, ApJ, 617, 1091
- Simons et al. (1989) Simons, J. W., Palmer, B. A., Hof, D. E., & Oldenborg, R. C. 1989, J. Opt. Soc. Am. B, 6, 1097
- Sneden (1973) Sneden, C. A. 1973, Ph.D. Thesis, Univ. of Texas at Austin
- Sneden et al. (1996) Sneden, C., McWilliam, A., Preston, G. W., Cowan, J. J., Burris, D. L., & Armosky, B. J. 1996, ApJ, 467, 819
- Sneden et al. (1997) Sneden, C., Kraft, R. P., Shetrone, M. D., Smith, G. H., Langer, G. E., & Prosser, C. F. 1997, AJ, 114, 1964
- Sneden et al. (2000) Sneden, C., Johnson, J., Kraft, R. P., Smith, G. H., Cowan, J. J., & Bolte, M. S. 2000, ApJ, 536, L85
- Sneden et al. (2002) Sneden, C., Cowan, J. J., Lawler, J. E., Burles, S., Beers, T. C., & Fuller, G. M. 2002, ApJ, 566, L25
- Sneden et al. (2003) Sneden, C., et al. 2003, ApJ, 591, 936
- Sneden et al. (2008) Sneden, C., Cowan, J. J., & Gallino, R. 2008, ARA&A, 46, 241
- Sneden et al. (2009) Sneden, C., Lawler, J. E., Cowan, J. J., Ivans, I. I., & Den Hartog, E. A. 2009, ApJS, 182, 80
- Straniero et al. (2006) Straniero, O., Gallino, R., & Cristallo, S. 2006, Nuclear Physics A, 777, 311
- Thielemann et al. (1993) Thielemann, F.-K., Bitouzet, J.-P., Kratz, K.-L., Möller, P., Cowan, J. J., & Truran, J. W. 1993, Phys. Rep., 227, 269
- Travaglio et al. (2001) Travaglio, C., Gallino, R., Busso, M., & Gratton, R. 2001, ApJ, 549, 346
- Truran et al. (2002) Truran, J. W., Cowan, J. J., Pilachowski, C. A., & Sneden, C. 2002, PASP, 114, 1293
- Van Eck et al. (2001) Van Eck, S., Goriely, S., Jorissen, A., & Plez, B. 2001, Nature, 412, 793
- Van Eck et al. (2003) Van Eck, S., Goriely, S., Jorissen, A., & Plez, B. 2003, A&A, 404, 291
- Vogt et al. (1994) Vogt, S. S., et al. 1994, Proc. SPIE, 2198, 362
- Westin et al. (2000) Westin, J., Sneden, C., Gustafsson, B., & Cowan, J. J. 2000, ApJ, 530, 783
- Wood & Andrew (1968) Wood, D. R. & Andrew, K. L. 1968, J. Opt. Soc. Am., 58, 818
- Yong et al. (2006) Yong, D., Aoki, W., Lambert, D. L., & Paulson, D. B. 2006, ApJ, 639, 918
- Yong et al. (2008a) Yong, D., Lambert, D. L., Paulson, D. B., & Carney, B. W. 2008, ApJ, 673, 854
- Yong et al. (2008b) Yong, D., Karakas, A. I., Lambert, D. L., Chieffi, A., & Limongi, M. 2008, 689, 1031
| Star | log | [Fe/H] | Reference | HST | Keck | VLT | ||
|---|---|---|---|---|---|---|---|---|
| (K) | (km s-1) | STIS | HIRES | UVES | ||||
| BD17 3248 | 5200 | 1.80 | 1.90 | 2.08 | 1 | Y | Y | N |
| CS 22892–052 | 4800 | 1.50 | 1.95 | 3.10 | 2 | Y | Y | N |
| CS 29491–069 | 5300 | 2.80 | 1.60 | 2.60 | 3 | N | N | Y |
| HD 6268 | 4685 | 1.50 | 2.00 | 2.42 | 4 | Y | Y | N |
| HD 74462 | 4700 | 2.00 | 1.90 | 1.52 | 5 | N | Y | N |
| HD 108317 | 5234 | 2.68 | 2.00 | 2.18 | 5 | N | Y | N |
| HD 115444 | 4720 | 1.75 | 2.00 | 2.90 | 5 | Y | Y | N |
| HD 122563 | 4570 | 1.35 | 2.90 | 2.72 | 5 | Y | Y | N |
| HD 122956 | 4510 | 1.55 | 1.60 | 1.95 | 5 | Y | Y | N |
| HD 126587 | 4795 | 1.95 | 2.00 | 2.93 | 4 | Y | Y | N |
| HD 175305 | 5040 | 2.85 | 2.00 | 1.48 | 4 | Y | Y | N |
| HD 186478 | 4600 | 1.45 | 2.00 | 2.56 | 5 | Y | Y | N |
| HD 204543 | 4672 | 1.49 | 2.00 | 1.87 | 5 | N | Y | N |
| HE 1219–0312 | 5060 | 2.30 | 1.60 | 2.97 | 3 | N | N | Y |
| (Å) | species | E.P. (eV) | log() | Ref. | BD17 3248 | CS 22892–052 | CS 29491–069 | HD 6268 | HD 74462 | HD 108317 | HD 115444 |
|---|---|---|---|---|---|---|---|---|---|---|---|
| 3794.77 | La ii | 0.24 | 0.21 | 1 | 0.580.15 | 0.910.10 | 0.750.15 | 1.080.15 | 0.960.20 | 1.380.10 | |
| 3988.51 | La ii | 0.40 | 0.21 | 1 | 0.570.10 | 0.880.10 | 0.800.15 | 1.080.10 | 0.240.10 | 1.040.15 | 1.480.10 |
| 3995.74 | La ii | 0.17 | 0.06 | 1 | 0.540.10 | 0.860.10 | 0.730.15 | 1.050.10 | 0.240.10 | 0.970.15 | 1.430.10 |
| 4086.71 | La ii | 0.00 | 0.07 | 1 | 0.520.10 | 0.830.10 | 0.700.10 | 0.970.10 | 0.300.20 | 0.960.20 | 1.360.10 |
| 4123.22 | La ii | 0.32 | 0.13 | 1 | 0.590.15 | 0.900.15 | 0.790.10 | 1.120.15 | 0.300.20 | 1.070.15 | 1.480.15 |
| 3724.93 | Eu ii | 0.00 | 0.09 | 2 | 0.750.20 | 0.940.20 | 0.980.20 | 1.310.15 | 0.490.25 | 1.300.15 | 1.610.15 |
| 3819.67 | Eu ii | 0.00 | 0.51 | 2 | 0.810.15 | 0.940.15 | 0.970.10 | 1.410.15 | 1.350.15 | 1.680.10 | |
| 3907.11 | Eu ii | 0.21 | 0.17 | 2 | 0.810.10 | 0.960.10 | 0.950.10 | 1.390.10 | 0.530.25 | 1.310.10 | 1.640.10 |
| 3930.50 | Eu ii | 0.21 | 0.27 | 2 | 0.770.20 | 0.970.20 | 0.970.20 | 1.300.20 | 1.280.20 | 1.630.20 | |
| 3971.97 | Eu ii | 0.21 | 0.27 | 2 | 0.810.20 | 0.990.20 | 0.970.20 | 1.400.20 | 1.360.20 | 1.640.20 | |
| 4129.72 | Eu ii | 0.00 | 0.22 | 2 | 0.770.10 | 0.980.10 | 0.950.10 | 1.390.10 | 0.490.15 | 1.320.10 | 1.630.10 |
| 4205.04 | Eu ii | 0.00 | 0.21 | 2 | 0.770.15 | 0.970.20 | 0.970.15 | 1.360.15 | 0.520.20 | 1.620.10 | |
| 4435.58 | Eu ii | 0.21 | 0.11 | 2 | 0.730.20 | 0.960.15 | 0.500.20 | 1.660.15 | |||
| 3230.58 | Er ii | 0.06 | 0.24 | 3 | 0.430.20 | 0.620.30 | 0.980.15 | 0.160.30 | 0.920.20 | 1.290.20 | |
| 3312.43 | Er ii | 0.06 | 0.03 | 3 | 0.320.20 | 0.560.25 | 0.850.20 | 0.760.25 | 1.200.15 | ||
| 3729.52 | Er ii | 0.00 | 0.59 | 3 | 0.270.15 | 0.440.15 | 0.540.15 | 0.850.15 | 0.050.15 | 0.820.15 | 1.140.15 |
| 3830.48 | Er ii | 0.00 | 0.22 | 3 | 0.360.15 | 0.510.15 | 0.500.15 | 0.960.15 | 0.240.20 | 0.770.15 | 1.230.15 |
| 3896.23 | Er ii | 0.06 | 0.12 | 3 | 0.340.15 | 0.500.15 | 0.550.15 | 1.010.20 | 0.260.30 | 0.920.15 | 1.290.15 |
| 3906.31 | Er ii | 0.00 | 0.12 | 3 | 0.380.20 | 0.520.20 | 0.470.20 | 0.880.20 | 1.210.20 | ||
| 3193.53 | Hf ii | 0.38 | 0.89 | 4 | 0.850.25 | 0.290.30 | 0.80 | ||||
| 3505.22 | Hf ii | 1.04 | 0.14 | 4 | 0.750.20 | 1.070.30 | 1.090.25 | 1.000.20 | 1.520.30 | ||
| 3918.09 | Hf ii | 0.45 | 1.14 | 4 | 0.810.20 | 0.570.25 | 1.040.25 | ||||
| 4093.15 | Hf ii | 0.45 | 1.15 | 4 | 0.680.15 | 0.890.15 | 0.810.30 | 1.240.20 | 0.390.10 | 1.000.30 | 1.470.30 |
| 3513.65 | Ir i | 0.00 | 1.21 | 5 | 0.190.25 | 0.070.20 | 0.210.30 | 0.410.20 | 0.590.25 | 0.220.25 | 0.490.25 |
| 3800.12 | Ir i | 0.00 | 1.44 | 5 | 0.080.20 | 0.140.20 | 0.060.30 | 0.570.20 | 0.370.15 | 0.270.20 | 0.860.25 |
| 2833.03 | Pb i | 0.00 | 0.50 | 6, 7 | 0.27 | 0.15 | 0.45 | ||||
| 3683.46 | Pb i | 0.97 | 0.54 | 6, 7 | 0.42 | 0.20 | 0.35 | 0.18 | 0.530.20 | 0.170.30 | 0.05 |
| 4057.81 | Pb i | 1.32 | 0.22 | 6, 7 | 0.72 | 0.35 | 0.50 | 0.08 | 0.48 | 0.37 | 0.30 |
| 3539.59 | Th ii | 0.00 | 0.54 | 8 | 1.310.20 | 1.550.25 | 1.58 | 1.170.30 | 1.44 | 1.86 | |
| 4019.13 | Th ii | 0.00 | 0.23 | 8 | 1.270.15 | 1.680.20 | 1.460.25 | 1.780.15 | 0.880.20 | 1.840.20 | 2.080.15 |
| 4086.52 | Th ii | 0.00 | 0.93 | 8 | 1.140.30 | 1.480.30 | 1.06 | 1.33 | 0.900.20 | 1.19 | 1.71 |
| 4094.75 | Th ii | 0.00 | 0.88 | 8 | 1.190.30 | 1.600.30 | 1.16 | 1.43 | 0.88 | 1.04 | 1.81 |
| (Å) | species | E.P. (eV) | log() | Ref. | HD 122563 | HD 122956 | HD 126587 | HD 175305 | HD 186478 | HD 204543 | HE 1219–0312 |
|---|---|---|---|---|---|---|---|---|---|---|---|
| 3794.77 | La ii | 0.24 | 0.21 | 1 | 0.780.25 | 1.750.15 | 0.160.20 | 1.340.20 | 0.750.20 | ||
| 3988.51 | La ii | 0.40 | 0.21 | 1 | 2.500.30 | 0.630.10 | 1.830.25 | 0.140.10 | 1.330.10 | 0.630.10 | 0.800.20 |
| 3995.74 | La ii | 0.17 | 0.06 | 1 | 2.320.30 | 0.630.10 | 1.820.15 | 0.120.10 | 1.340.10 | 0.620.10 | 0.730.15 |
| 4086.71 | La ii | 0.00 | 0.07 | 1 | 2.340.20 | 0.660.10 | 1.590.10 | 0.170.10 | 1.280.10 | 0.630.10 | 0.720.10 |
| 4123.22 | La ii | 0.32 | 0.13 | 1 | 2.480.25 | 0.580.20 | 1.810.20 | 0.130.15 | 1.350.15 | 0.650.15 | 0.880.20 |
| 3724.93 | Eu ii | 0.00 | 0.09 | 2 | 2.770.25 | 0.850.25 | 1.900.20 | 0.310.15 | 1.490.15 | 1.030.15 | 0.970.20 |
| 3819.67 | Eu ii | 0.00 | 0.51 | 2 | 2.910.30 | 2.040.15 | 1.560.10 | 1.000.10 | |||
| 3907.11 | Eu ii | 0.21 | 0.17 | 2 | 2.740.25 | 0.980.15 | 1.970.15 | 0.380.20 | 1.550.10 | 1.140.15 | 0.990.10 |
| 3930.50 | Eu ii | 0.21 | 0.27 | 2 | 2.01 | 1.960.20 | 1.030.20 | ||||
| 3971.97 | Eu ii | 0.21 | 0.27 | 2 | 2.51 | 1.030.20 | 1.950.20 | 1.530.20 | 1.040.20 | ||
| 4129.72 | Eu ii | 0.00 | 0.22 | 2 | 2.710.20 | 0.930.15 | 1.950.10 | 0.370.10 | 1.510.10 | 1.040.15 | 0.970.10 |
| 4205.04 | Eu ii | 0.00 | 0.21 | 2 | 2.680.30 | 0.930.20 | 2.020.20 | 0.380.25 | 1.530.15 | 1.050.15 | 0.950.15 |
| 4435.58 | Eu ii | 0.21 | 0.11 | 2 | 2.21 | 0.880.20 | 1.82 | 0.400.25 | 1.550.20 | 0.990.15 | 0.910.20 |
| 3230.58 | Er ii | 0.06 | 0.24 | 3 | 2.380.30 | 0.310.20 | 1.470.25 | 0.060.20 | 1.100.20 | 0.680.25 | |
| 3312.43 | Er ii | 0.06 | 0.03 | 3 | 2.11 | 0.240.20 | 1.470.30 | 0.020.30 | 1.060.25 | 0.480.25 | |
| 3729.52 | Er ii | 0.00 | 0.59 | 3 | 1.76 | 0.450.15 | 1.430.20 | 0.030.15 | 1.030.15 | 0.630.15 | 0.490.15 |
| 3830.48 | Er ii | 0.00 | 0.22 | 3 | 2.230.30 | 0.460.15 | 1.460.15 | 0.030.15 | 1.130.15 | 0.750.20 | 0.520.15 |
| 3896.23 | Er ii | 0.06 | 0.12 | 3 | 2.16 | 0.490.25 | 1.560.20 | 0.000.20 | 1.160.20 | 0.580.25 | 0.500.15 |
| 3906.31 | Er ii | 0.00 | 0.12 | 3 | 1.460.20 | 1.030.25 | 0.450.20 | ||||
| 3193.53 | Hf ii | 0.38 | 0.89 | 4 | 0.250.30 | 0.890.30 | |||||
| 3505.22 | Hf ii | 1.04 | 0.14 | 4 | 1.64 | 0.690.25 | 1.40 | 0.220.20 | 1.230.25 | 0.770.20 | |
| 3918.09 | Hf ii | 0.45 | 1.14 | 4 | 0.480.15 | 1.05 | 0.54 | ||||
| 4093.15 | Hf ii | 0.45 | 1.15 | 4 | 1.89 | 0.770.15 | 1.650.30 | 0.050.15 | 1.400.15 | 0.830.15 | 0.39 |
| 3513.65 | Ir i | 0.00 | 1.21 | 5 | 0.51 | 0.080.20 | 0.47 | 0.400.20 | 0.620.25 | 0.130.25 | |
| 3800.12 | Ir i | 0.00 | 1.44 | 5 | 1.16 | 0.090.20 | 1.050.25 | 0.410.20 | 0.790.20 | 0.270.20 | 0.190.25 |
| 2833.03 | Pb i | 0.00 | 0.50 | 6, 7 | 0.42 | 0.150.20 | 0.38 | 0.070.30 | |||
| 3683.46 | Pb i | 0.97 | 0.54 | 6, 7 | 0.02 | 0.000.20 | 0.07 | 0.220.30 | 0.01 | 0.050.25 | 0.63 |
| 4057.81 | Pb i | 1.32 | 0.22 | 6, 7 | 0.27 | 0.05 | 0.28 | 0.42 | 0.26 | 0.13 | 0.53 |
| 3539.59 | Th ii | 0.00 | 0.54 | 8 | 1.88 | 1.760.30 | 1.84 | 0.840.30 | 1.92 | 1.960.30 | 0.48 |
| 4019.13 | Th ii | 0.00 | 0.23 | 8 | 2.43 | 1.380.20 | 2.39 | 0.740.20 | 2.190.25 | 1.530.25 | 1.250.25 |
| 4086.52 | Th ii | 0.00 | 0.93 | 8 | 2.08 | 1.66 | 1.79 | 0.64 | 2.02 | 1.710.30 | 1.030.40 |
| 4094.75 | Th ii | 0.00 | 0.88 | 8 | 1.93 | 1.41 | 1.79 | 0.710.30 | 1.92 | 1.600.30 | 0.88 |
| Star | [Fe/H] | Ref. | log (La) | log (Eu) | log (Er) | log (Hf) | log (Ir) | log (Pb) | log (Th) | Ref. | -only?aaDefined by log (La/Eu) |
|---|---|---|---|---|---|---|---|---|---|---|---|
| BD18 5550 | 3.05 | 1 | 2.520.10 | 2.810.20 | 2.370.10 | 0.86 | 3.02 | 1, 2 | |||
| BD01 2916 | 1.93 | 3 | 0.870.12 | 1.220.14 | 0.200.19 | 3 | |||||
| BD04 2621 | 2.52 | 1 | 2.290.11 | 2.630.20 | 2.240.10 | 3.04 | 1, 2 | ||||
| BD06 0648 | 2.14 | 3 | 0.950.12 | 1.500.16 | 0.00 | 3 | |||||
| BD08 2856 | 2.12 | 1 | 1.030.04 | 1.160.04 | 0.950.09 | 0.20 | 1.700.10 | 1, 2 | Y | ||
| BD17 3248 | 2.08 | 4 | 0.550.05 | 0.780.05 | 0.340.07 | 0.730.11 | 0.120.16 | 0.27 | 1.260.10 | 5 | Y |
| BD30 2611 | 1.46 | 3 | 0.270.12 | 0.490.14 | 0.430.19 | 3 | Y | ||||
| CS 22892–052 | 3.10 | 6 | 0.870.05 | 0.960.05 | 0.500.07 | 0.930.13 | 0.100.14 | 0.15 | 1.600.13 | 5 | Y |
| CS 29491–069 | 2.60 | 7 | 0.750.05 | 0.960.05 | 0.520.08 | 0.670.19 | 0.130.21 | 0.35 | 1.460.25 | 5 | Y |
| CS 29497–004 | 2.63 | 8 | 0.380.15 | 0.450.20 | 0.960.15 | 8, 9 | Y | ||||
| CS 30306–132 | 2.50 | 10 | 0.780.06 | 1.020.05 | 0.620.15 | 0.50 | 1.160.15 | 10 | Y | ||
| CS 31078–018 | 2.84 | 11 | 1.000.22 | 1.170.17 | 0.990.15 | 0.25 | 1.350.25 | 12 | Y | ||
| CS 31082–001 | 2.90 | 12 | 0.620.04 | 0.720.03 | 0.300.04 | 0.720.04 | 0.220.20 | 0.550.15 | 0.980.05 | 12, 13, 14 | Y |
| HD 3008 | 1.98 | 3 | 1.020.14 | 1.300.16 | 0.350.22 | 3 | |||||
| HD 6268 | 2.42 | 15 | 1.050.05 | 1.370.05 | 0.930.07 | 1.140.13 | 0.490.14 | 0.08 | 1.780.15 | 5 | |
| HD 29574 | 1.86 | 3 | 0.630.12 | 0.900.14 | 0.150.19 | 3 | |||||
| HD 74462 | 1.52 | 16 | 0.250.06 | 0.500.09 | 0.140.10 | 0.380.09 | 0.430.13 | 0.530.20 | 0.940.13 | 5 | |
| HD 108317 | 2.18 | 16 | 1.010.07 | 1.320.05 | 0.850.07 | 1.000.17 | 0.250.16 | 0.170.30 | 1.840.20 | 5 | |
| HD 108577 | 2.38 | 1 | 1.240.09 | 1.480.12 | 1.230.11 | 2.030.14 | 1, 2 | Y | |||
| HD 115444 | 2.90 | 16 | 1.420.05 | 1.640.04 | 1.220.07 | 1.500.21 | 0.680.18 | 0.45 | 2.080.15 | 5 | Y |
| HD 122563 | 2.72 | 16 | 2.400.13 | 2.750.11 | 2.300.21 | 0.42 | 2.43 | 5 | |||
| HD 122956 | 1.95 | 16 | 0.640.05 | 0.940.07 | 0.400.08 | 0.830.08 | 0.080.14 | 0.080.14 | 1.500.17 | 5 | |
| HD 126587 | 2.93 | 15 | 1.750.07 | 1.970.06 | 1.470.08 | 1.650.30 | 1.050.25 | 0.38 | 2.39 | 5 | Y |
| HD 128279 | 2.40 | 1 | 1.510.16 | 1.800.20 | 1.410.10 | 1.88 | 1, 2 | ||||
| HD 141531 | 1.66 | 3 | 0.550.12 | 0.870.14 | 0.050.19 | 3 | |||||
| HD 175305 | 1.48 | 15 | 0.140.05 | 0.360.07 | 0.010.08 | 0.130.11 | 0.400.14 | 0.250.21 | 0.760.15 | 5 | Y |
| HD 186478 | 2.56 | 16 | 1.320.05 | 1.530.05 | 1.090.08 | 1.350.13 | 0.720.16 | 0.26 | 2.190.25 | 5 | Y |
| HD 204543 | 1.87 | 16 | 0.630.05 | 1.050.07 | 0.640.09 | 0.820.11 | 0.210.16 | 0.050.25 | 1.680.14 | 5 | |
| HD 206739 | 1.64 | 3 | 0.410.12 | 0.720.18 | 0.200.26 | 3 | |||||
| HD 214925 | 2.08 | 3 | 0.860.12 | 1.090.20 | 0.500.22 | 3 | Y | ||||
| HD 216143 | 2.32 | 3 | 1.210.12 | 1.240.15 | 0.10 | 3 | Y | ||||
| HD 220838 | 1.80 | 3 | 0.760.12 | 0.930.16 | 0.050.19 | 3 | Y | ||||
| HD 221170 | 2.16 | 17 | 0.730.06 | 0.860.07 | 0.470.08 | 0.840.11 | 0.020.13 | 0.090.21 | 1.460.05 | 17 | Y |
| HD 235766 | 1.93 | 3 | 0.600.12 | 0.860.14 | 0.100.26 | 3 | |||||
| HE 1219–0312 | 2.97 | 7 | 0.750.07 | 0.980.05 | 0.490.05 | 0.190.25 | 0.53 | 1.190.21 | 5 | Y | |
| HE 1523–0901 | 2.95 | 18 | 0.630.06 | 0.620.05 | 0.420.17 | 0.730.20 | 0.240.05 | 0.20 | 1.200.05 | 18 | Y |
| M5 IV-81 | 1.28 | 19 | 0.110.05 | 0.310.05 | 0.120.15 | 0.350.14 | 0.580.15 | 19, 20 | |||
| M5 IV-82 | 1.33 | 19 | 0.110.05 | 0.230.05 | 0.220.15 | 0.250.14 | 0.680.15 | 19, 20 | |||
| M13 L598 | 1.56 | 21 | 0.340.07 | 0.580.08 | 0.090.13 | 20, 21 | Y | ||||
| M13 L629 | 1.63 | 21 | 0.350.07 | 0.610.08 | 0.120.13 | 20, 21 | |||||
| M13 L70 | 1.59 | 21 | 0.230.07 | 0.580.08 | 0.090.13 | 20, 21 | |||||
| M13 L973 | 1.61 | 21 | 0.270.07 | 0.510.08 | 0.010.13 | 20, 21 | Y | ||||
| M15 K341 | 2.32 | 22 | 0.730.08 | 0.880.09 | 1.510.10 | 22 | Y | ||||
| M15 K462 | 2.25 | 22 | 0.470.08 | 0.610.09 | 1.300.10 | 22 | Y | ||||
| M15 K583 | 2.34 | 22 | 1.190.08 | 1.240.09 | 1.700.10 | 22 | Y | ||||
| M92 VII-18 | 2.29 | 1 | 1.290.07 | 1.450.07 | 1.140.18 | 2.010.07 | 1, 2 | Y | |||
| UMi COS82 | 1.42 | 23 | 0.520.16 | 0.340.11 | 0.730.11 | 0.250.15 | 23 | Y |
References. — (1) Johnson 2002; (2) Johnson & Bolte 2001; (3) Aoki & Honda 2008; (4) Cowan et al. 2002; (5) this study; (6) Sneden et al. 2003; (7) Hayek et al. 2009; (8) Christlieb et al. 2004; (9) Jonsell et al. 2006; (10) Honda et al. 2004; (11) Lai et al. 2008; (12) Hill et al. 2002; (13) Plez et al. 2004; (14) Sneden et al. 2009; (15) Cowan et al. 2005; (16) Simmerer et al. 2004; (17) Ivans et al. 2006; (18) Frebel et al. 2007; (19) Yong et al. 2008a; (20) Yong et al. 2008b; (21) Yong et al. 2006; (22) Sneden et al. 2000; (23) Aoki et al. 2007
| Star | 12C/13C | log() |
|---|---|---|
| BD17 3248 | 63 | 2.4 |
| CS 22892–052 | 133 | 2.5 |
| CS 29491–069 | 30 | 1.4 |
| HD 6268 | 62 | 2.5 |
| HD 74462 | 103 | 2.0 |
| HD 108317 | 155 | 1.5 |
| HD 115444 | 62 | 2.2 |
| HD 122563 | 41 | 2.6 |
| HD 122956 | 72 | 2.4 |
| HD 126587 | 103 | 2.1 |
| HD 175305 | 25 | 1.3 |
| HD 186478 | 52 | 2.5 |
| HD 204543 | 52 | 2.5 |
| HE 1219–0312 | 15 | 1.8 |
| Star | Reference | log (Pb) | log (Th) | 12C/13C |
|---|---|---|---|---|
| BD17 3248 | this study | 0.27 | 1.260.10 | 63 |
| Cowan et al. (2002) | 0.3 | 1.220.10 | ||
| CS 22892–052 | this study | 0.15 | 1.600.13 | 133 |
| Sneden et al. (2003) | 0.2 | 1.590.10 | 152 | |
| Honda et al. (2004) | 1.460.15 | 20 | ||
| CS 29491–069 | this study | 0.35 | 1.460.25 | 30 |
| Hayek et al. (2009) | 1.430.22 | 90 | ||
| HD 6268 | this study | 0.08 | 1.780.15 | 62 |
| Honda et al. (2004) | 1.970.10 | 4 | ||
| HD 74462 | this study | 0.530.20 | 0.940.13 | 103 |
| Aoki & Honda (2008) | 0.350.26 | |||
| HD 115444 | this study | 0.45 | 2.080.15 | 62 |
| Westin et al. (2000) | 2.270.11 | 61.5 | ||
| Johnson & Bolte (2001) | 2.400.09 | 6 | ||
| Honda et al. (2004) | 2.010.15 | 7 | ||
| HD 186478 | this study | 0.26 | 2.190.25 | 52 |
| Johnson & Bolte (2001) | 2.300.11 | 6 | ||
| Honda et al. (2004) | 1.890.15 | 6 | ||
| HD 204543 | this study | 0.050.25 | 1.680.14 | 52 |
| Aoki & Honda (2008) | 0.000.22 | |||
| HE 1219–0312 | this study | 0.53 | 1.190.21 | 15 |
| Hayek et al. (2009) | 1.290.14 | 90 |
| S.S. -only | “standard” stars with | four “standard” | four stars with an | |||||||||
|---|---|---|---|---|---|---|---|---|---|---|---|---|
| predictionsaaLodders (2003) S.S. meteoritic and Sneden et al. (2008), with updates from Gallino | log (La/Eu) | -only starsbbBD17 3248, CS 22892–052, HD 115444, HD 221170 | “actinide boost”ccCS 30306–132, CS 31078–018, CS 31082–001, HE 1219–0312 | |||||||||
| Ratio | () | No. | No. | No. | ||||||||
| La/Eu | 0.179 | … | 0.18 | 0.03 | 4 | 0.16 | 0.04 | 4 | ||||
| Er/Eu | 0.364 | 0.40 | 0.03 | 13 | 0.44 | 0.03 | 4 | 0.43 | 0.08 | 4 | ||
| Hf/Eu | 0.075 | 0.10 | 0.04 | 9 | 0.05 | 0.04 | 4 | 0.00 | 0.06 | 1 | ||
| Ir/Eu | 0.850 | 0.88 | 0.04 | 9 | 0.89 | 0.05 | 4 | 0.88 | 0.09 | 2 | ||
| Pb/Eu | 0.68 | 0.07 | 7 | 0.77 | 0.22 | 1 | 0.17 | 0.15 | 1 | |||
| Th/Eu | 0.56 | 0.03 | 16 | 0.55 | 0.05 | 4 | 0.24 | 0.03 | 4 | |||
| 206Pb | 207Pb | 208Pb | Pb | 232Th | 235U | 238U | Th, U | |
|---|---|---|---|---|---|---|---|---|
| S.S. total (Lodders, 2003) | 0.601 | 0.665 | 1.903 | 3.169 | 0.0440 | 0.0059 | 0.0187 | 0.0686 |
| calculated -process: | ||||||||
| ETFSI-Q: | ||||||||
| Direct (isobaric) production | 0.0209 | 0.0178 | 0.0283 | 0.0670 | 0.0184 | 0.0091 | 0.0076 | 0.0351 |
| Direct indirect production | 0.1439 | 0.1068 | 0.1242 | 0.3749 | 0.0415 | 0.0343 | 0.0234 | 0.0992 |
| Cowan et al. (1999) | 0.158 | 0.146 | 0.135 | 0.439 | ||||
| Kratz et al. (2004) (Fe-seed) | 0.163 | 0.151 | 0.138 | 0.452 | ||||
| -residuals: | ||||||||
| Cowan et al. (1999) | 0.240 | 0.254 | 0.158 | 0.652 | ||||
| Beer et al. (2001) | 0.178 | 0.171 | 0.133 | 0.482 |
Note. — The -residuals are calculated as .
| “standard” stars with log (La/Eu) | stars with actinide boost | ||||||||||
|---|---|---|---|---|---|---|---|---|---|---|---|
| Chronometer | P.R. at | log(P.R.) | Observed | No. | Age | Age spread | Observed | No. | Age | Age spread | |
| pair | time “zero” | mean (dex) | stars | (Gyr) | (Gyr) | mean (dex) | stars | (Gyr) | (Gyr) | ||
| Th/La | 0.585 | 0.233 | 0.670.03 (=0.10) | 16 | 20.44.1 | 4.7 | 0.370.03 (=0.05) | 4 | 6.44.3 | 2.3 | |
| Th/Eu | 0.463 | 0.334 | 0.560.03 (=0.08) | 16 | 10.64.1 | 3.7 | 0.240.03 (=0.06) | 4 | 4.44.3 | 2.8 | |
| Th/Er | 0.236 | 0.627 | 0.910.04 (=0.11) | 12 | 13.24.3 | 5.1 | 0.660.08 (=0.17) | 4 | 1.55.5 | 7.9 | |
| Th/Hf | 0.648 | 0.188 | 0.610.05 (=0.13) | 8 | 19.74.5 | 6.1 | 0.260.06 | 1 | 3.45.7 | ||
| Th/Ir | 0.0677 | 1.169 | 1.420.06 (=0.15) | 8 | 11.74.8 | 7.0 | 1.120.16 (=0.18) | 2 | 2.38.8 | 8.4 | |
| Th/Pb | 0.111 | 0.955 | 1.210.23 (=0.32) | 2 | 9.9 | 11. | 0.430.25 | 1 | |||
Note. — No age is derived from the Th/Pb chronometer for the stars with an actinide boost because the decay of all actinide material present could never produce the observed Th/Pb ratio in CS 31082–001.