Barred Galaxies in the Abell 901/2 Supercluster with STAGES
Abstract
We present a study of bar and host disk evolution in a dense cluster environment, based on a sample of 800 bright () galaxies in the Abell 901/2 supercluster at 0.165. We use ACS F606W imaging from the STAGES survey, and data from , , and COMBO-17. We identify and characterize bars through ellipse-fitting, and other morphological features through visual classification. We find the following results: (1) To define the optical fraction of barred disk galaxies, we explore three commonly used methods for selecting disk galaxies. We find 625, 485, and 353 disk galaxies, respectively, via visual classification, a single component Sérsic cut (), and a blue-cloud cut. In cluster environments, the latter two methods suffer from serious limitations, and miss 31% and 51%, respectively, of visually-identified disks, particularly the many red, bulge-dominated disk galaxies in clusters. (2) For moderately inclined disks, the three methods of disk selection, however, yield a similar global optical bar fraction () of 34% (115/340), 31% (58/189), and 30% (72/241), respectively. (3) We explore as a function of host galaxy properties and find that it rises in brighter galaxies and those which appear to have no significant bulge component. Within a given absolute magnitude bin, is higher in visually-selected disk galaxies that have no bulge as opposed to those with bulges. Conversely, for a given visual morphological class, rises at higher luminosities. Both results are similar to trends found in the field. (4) For bright early-types, as well as faint late-type systems with no evident bulge, the optical bar fraction in the Abell 901/2 clusters is comparable within a factor of 1.1 to 1.4 to that of field galaxies at lower redshifts (). (5) Between the core and the virial radius of the cluster ( 0.25 to 1.2 Mpc) at intermediate environmental densities (log() 1.7 to 2.3), the optical bar fraction does not appear to depend strongly on the local environment density tracers (, , and ICM density), and varies at most by a factor of 1.3. Inside the cluster core, we are limited by number statistics, projection effects, and different trends from different indicators, but overall does not show evidence for a variation larger than a factor of 1.5. We discuss the implications of our results for the evolution of bars and disks in dense environments.
1 Introduction
Stellar bars are one of the most important internal drivers of disk galaxy evolution. For field galaxies in the local universe, bars are known to be the most efficient way to redistribute material in the galaxy disk (Combes & Sanders 1981; Weinberg 1985; Debattista & Sellwood 1998, 2000; Athanassoula 2002). Bars channel gas into the central regions of galaxies, where powerful starbursts can ignite (Schwarz 1981; Shlosman, Frank, & Begelman 1989; Kormendy & Kennicutt 2004; Jogee 1999; Jogee, Scoville, & Kenney 2005; Sheth et al. 2005), building central disky structures known as ‘pseudobulges’ (Kormendy 1982; Kormendy 1993; Jogee 1999; Jogee, Scoville, & Kenney 2005; Fisher 2006; Weinzirl et al. 2009). Peanut/boxy bulges in inclined galaxies are thought to be associated with bending instabilities and vertical resonances in bars (e.g., Combes & Sanders 1981; Combes et al. 1990; Pfenniger & Norman 1990; Athanassoula 2005; Martinez-Valpuesta et al. 2006).
As early as 1963, de Vaucouleurs used visual classification on photographic plates to find that approximately 30% of nearby galaxies appear strongly barred in the optical band, with the fraction increasing to approximately 60% if very weak bars are considered. Quantitative studies for the optical bar fraction at 0 yield a mean value of 45% to 52% with a typical uncertainty of from ellipse-fits (Marinova & Jogee 2007, hereafter MJ07; Barazza, Jogee, & Marinova 2008; hereafter BJM08; Aguerri et al. 2009, hereafter A09) and 47% from bulge-disk-bar decomposition (Reese et al. 2007). The lower value from these quantitative methods compared to the 60% value from de Vaucouleurs (1963) stems from the fact that many weak bars (with RC3 class ‘AB’) are obscured by dust and star formation (SF), caused by the presence of curved shocks/dust lanes (e.g., Athanassoula 1992) on the leading edges of the bar. Many such bars may fail to meet rigorous quantitative criteria for characterizing bars via ellipse-fit or bulge-disk-bar decomposition, but their presence can sometimes be guessed via visual inspection (see MJ07 for detailed discussion). In the near infra-red (NIR), where obscuration by dust and SF is minimized, different quantitative methods, such as ellipse-fit (Menendez-Delmestre et al. 2007; MJ07), bulge-disk-bar decomposition (Weinzirl et al. 2009) and Fourier decomposition (Laurikainen et al. 2004) all yield a NIR bar fraction of 60% for bright nearby samples.
The above values of the bar fraction at 0 refer to the globally-averaged value over a wide range of Hubble types and luminosities. Several studies have performed more detailed explorations to look at how bars relate to the properties of the host spiral galaxies. Recent studies based on SDSS (BJM08; A09) using ellipse-fits report that the optical bar fraction rises in spiral galaxies which appear to be disk-dominated, quasi-bulgeless, or have a morphology suggestive of a low bulge-to-disk ratio. A similar trend was observed by Odewahn (1996) using visual classes: he found that the optical fraction of strong bars in disk galaxies rises from Sc galaxies towards later types. Similar results are found in the near-infrared by Weinzirl et al. (2008) using 2D bulge-disk-bar decomposition on nearby bright spiral galaxies.
Recently, studies performed at intermediate redshifts with the Advanced Camera for Surveys (ACS) on the Hubble Space Telescope (HST) have allowed bars to be probed at earlier epochs. Several studies have shown that the optical fraction of strong () or prominent bars is 30% on average over 0.2–1 (Elmegreen et al. 2004; Jogee et al. 2004; Zheng et al. 2005). In particular, Jogee et al. (2004) find that the optical fraction of strong bars does not show an order of magnitude decline, but only varies from 36%6% over 0.2–0.7 to 24%4% over 0.7 to 1.0. A much larger study finds a variation in the optical fraction of strong bars from 27%1% to 12%1% for 0.2–0.84 (Sheth et al. 2008). Interpretations differ on whether the observed decline is simply due to systematic effects, such as loss of resolution and rising obscuration with redshift (Jogee et al. 2004; MJ07; BJM08), or whether it reflects an intrinsic decline (Sheth et al. 2008) in the true bar fraction.
While bars have been studied extensively in the field, little is known about the fraction of bars and their properties in dense environments. The presence of bars is particularly useful to identify galaxies with disks in clusters ( 4.1), where other disk signatures, such as spiral arms, may be absent due to ram pressure stripping. Furthermore, we can use galaxy clusters as a lab to test our theories of bar formation and evolution. The fraction of barred galaxies in a cluster depends on the epoch of bar formation, the robustness of bars, the interplay between cluster environmental processes (harassment, tidal interactions, ram pressure stripping), and the evolutionary history of clusters.
The detailed process of bar formation is not yet known, but simulations suggest that a cold disk, with low velocity dispersion, , favors the formation of spontaneous disk instabilities (e.g., Toomre 1964; Jog & Solomon 1984). External triggers, such as tidal interactions, can also induce bars in a dynamically cold disk (e.g., Noguchi 1987; Elmegreen et al. 1990; Elmegreen et al. 1991; Hernquist & Mihos 1995). Thus, cluster processes can have competing effects on bar formation. While frequent tidal interactions can induce stellar bars, they may also heat the disks and thereby make them less susceptible to bar formation. Dubinski et al. (2008) explored these effects by modeling the interaction of a hundred DM satellites on M31. They found that while the satellites did not have a large heating effect on the disk, encounters close to the galaxy center could produce strong non-axisymmetric instabilities such as stellar bars. However, in dense clusters, disk galaxies that are deprived of their cold gas through ram-pressure stripping may be too dynamically hot to form bars. Recently van den Bosch et al. (2008) have shown that low-mass satellite cluster galaxies may be more affected by gas strangulation, which may in turn make them less favorable to bar formation. It is also important to note that if bars cannot be easily dissolved once formed (see 5), then in scenarios where clusters grow by accretion of field galaxies, existing bars in accreted galaxies may not be much impacted by subsequent cluster processes.
There have been only a handful of observational studies that have explored the impact of environment on barred disks. Recently, A09 studied the effects of environment in field and intermediate density regions on barred galaxies using 3000 galaxies at from SDSS-DR5, and found that the bar fraction and properties were not correlated to galaxy environment. Bars were identified using ellipse fits. However, they excluded interacting galaxies from their study. Barazza et al. (2009) study the impact of environment on bars in disk galaxies using 2000 galaxies at intermediate redshift ( 0.4–1) from the ESO Distant Clusters Survey (EDisCS; White et al. 2005). van den Bergh (2002) found no difference between the bar fraction in the field and in clusters using a uniform sample of 930 galaxies from the Shapley-Ames catalog, in a study where bar classifications were performed through visual inspection of optical images. He therefore concluded that the bar fraction depends solely on host-galaxy properties. It should be noted that for this study, the environment assignments were largely qualitative, made by inspecting the region around the galaxy on the image, and looking at luminosities and radial velocities of surrounding galaxies. Varela et al. (2004) found that the bar fraction is almost twice as high in galaxies that are interacting, compared to isolated galaxies. Their study relied on redshifts from the CfA survey and morphological classifications from LEDA and NED. The results of Varela et al. (2004) confirm previous studies (e.g., Elmegreen et al. 1990), who find a higher number of barred galaxies in binary systems.
We are now in a position to make further progress in this largely unexplored aspect of galaxy evolution with the STAGES panchromatic dataset ( 2), which includes: a 0.5 0.5 square degree HST ACS mosaic in F606W of the A901/2 supercluster, spectrophotometric redshifts from COMBO-17, coverage with , , and , as well as dark matter maps. In 3, we outline the techniques for characterizing bars and disks. It should be noted that traditionally the bar fraction is defined as the fraction of disk galaxies that are barred. Hence calculation of requires disk galaxies to be reliably identified. We use the term ‘disk galaxies’ to describe all galaxies with an outer disk component (e.g., S0-Sm), which may or may not be accompanied by a central bulge. In this paper, we draw attention to the fact that many automated methods commonly used to identify disks in the field may fail in clusters. Motivated by this, we explore different ways of identifying disks (e.g., color cut, Sérsic cut, visual classification) in 4.1, and explore the effect on . We determine the frequency of bars as a function of host disk properties ( 4.3, 4.4, 4.5), and as a function of cluster radius, galaxy number density, ICM density, and DM density ( 4.6). The comparison of our results to those from field studies is given in 4.7. In 5, we discuss the implications of our results for the evolution of bars and disks in dense environments. In 6, we give the summary and conclusions.
2 Data and Sample Selection
The Abell 901/902 supercluster consists of three galaxy clusters and a group at 0.165, with an average separation of 1 Mpc. The properties of this system are described in detail in Gray et al. (2002). The STAGES survey (Gray et al. 2008) covers a 0.5 0.5 square degree field centered on the supercluster, consisting of an 80-tile mosaic with the HST ACS F606W. This ACS filter corresponds closely to the optical band. The ACS point spread function (PSF) of 0.1′′ corresponds to 282 pc at 0.165111We assume in this paper a flat cosmology with and =70 km s-1 Mpc-1.. Spectro-photometric redshifts are available for all galaxies from COMBO-17 (Wolf et al. 2004; 2005) where the photo-z accuracy of the sample used in this paper is 0.01. The multi-wavelength dataset includes X-ray maps of the ICM density from , UV from , 24 coverage, and dark matter maps from weak lensing (Heymans et al. 2008). Total star formation rates (SFRs) derived from UV and 24 luminosities (Bell et al. 2005), as well as stellar masses (Borch et al. 2006) are also available for this field.
Cluster galaxies are selected using photometric redshifts (see Gray et al. 2008 for a detailed description). This provides a sample of 1990 cluster galaxies. For this paper, we focus on galaxies brighter than . We choose this cutoff, because it tends to separate well the regimes where normal and dwarf galaxies dominate on the luminosity functions of clusters (Binggeli, Sandage, & Tammann 1988). We do not consider dwarf galaxies in this study for two reasons. Firstly, our resolution of 282 pc may be insufficient in many cases to reliably identify morphological structures such as bars in smaller dwarf galaxies. Secondly, the contamination of the sample by field galaxies at magnitudes fainter than becomes significant. This leaves us with a sample of 785 bright (), cluster galaxies. The field contamination for this sample is estimated to be 10%, from the space density of field galaxies using the same absolute magnitude cut (Wolf, Gray, Meisenheimer 2005).
3 Methodology
3.1 Methods for Selection of Disk Galaxies
In all studies conducted to date (e.g., deVaucouleurs 1963; Sellwood & Wilkinson 1993; Eskridge et al. 2000; Knapen et al. 2000; Mulchaey & Regan 1997; Jogee et al. 2004; Laurikainen et al. 2004; Elmegreen et al. 2004; Zheng et al. 2005; Buta et al. 2005; MJ07; Menéndez-Delmestre et al. 2007; BJM08; Sheth et al. 2008), the bar fraction, has been defined as the number of barred disk galaxies divided by the total number of disk galaxies:
| (1) |
Note that in the above studies, as well as in this paper, we use the term ‘disk galaxies’ to describe all galaxies with a significant outer disk component (e.g., systems typically labeled as S0-Sm), which may or may not be accompanied by a central bulge. The bar fraction is only quoted with disk galaxies in mind, because bars are believed to be related to an instability in the disk component of galaxies. Furthermore, if the bar fraction were calculated over all galaxies, changes in the morphological distribution between disk and spheroidal (e.g., E) galaxies would influence the bar fraction and make it hard to compare across different samples. In the local universe, for nearby galaxies, catalogs like the RC3 (deVaucouleurs et al. 1991) contain visual classifications of galaxy morphology, making it possible to select a sample of disk galaxies for bar studies. In large surveys such as the SDSS and GEMS, two quantitative methods have been used to pick out disk galaxies: (1) using a blue-cloud color cut in color-magnitude space (Jogee et al. 2004; BJM08) and (2) using a Sérsic index, , from a single component fit to isolate a sample of disk-dominated galaxies (Jogee et al. 2004; Bell et al. 2004; Barden et al. 2005; Ravindranath et al. 2004). In the color cut method, only blue cloud galaxies are selected on a color-magnitude diagram. The Sérsic cut method involves selecting only galaxies with Sérsic index . This is motivated by the fact that a pure disk has a Sérsic index of 1, while a deVaucouleurs profile typically used to describe a spheroid has a Sérsic index of 4. Note that in Bell et al. (2004), Barden et al. (2005) and Ravindranath et al. (2004), the goal was to broadly separate early-type (E/S0/Sa) galaxies, from late-type disk-dominated galaxies (Sb-Sm). However, because bars can occur in all types of disk galaxies from S0-Sm, we would like to explore how well such Sérsic and color cuts work in our cluster sample at separating spheroidal galaxies (Es) from disk galaxies as defined above (e.g., S0-Sm).
Using a blue-cloud or Sérsic cut to pick out disk-dominated galaxies works fairly well at isolating a disk-galaxy sample in the field. However, these methods can grossly fail in a cluster environment, where the galaxy populations are different than those in the field. Gas stripping of spirals could quench their star formation and make them look redder. These galaxies might then be missed by a color cut. On the other hand, the prevalence of bulge-dominated S0-type disk galaxies in clusters (Dressler 1980) could be missed by a Sérsic cut. For this reason, we use a third method to pick out disk galaxies: visual classification.
We visually classify the whole sample and put galaxies into different groups according to the galaxy morphology ( 3.3). A galaxy is identified as a disk galaxy if it exhibits the dynamical signatures of disk instabilities such as a stellar bar and spiral arms. In the absence of such structure, disks are picked by an identifiable break between the bulge and disk component either in the image itself and/or looking for a break between a steep inner profile and a slowly declining outer profile in an estimation of the brightness profile with the Smithsonian Astrophysical Observatory visualization tool . Three classifiers (I.M., A.H., S.J.) completed a training set of several hundred galaxies, and two classifiers (A.H. & I.M.) classified the full cluster sample, with the third classifier performing random checks. Subsequently, uncertain cases were reviewed by all three classifiers. In our bright cluster galaxy sample of 785 galaxies, 750 of them could be classified into visual classes as described above. The remaining galaxies were either too messy to classify, too compact to classify, or unclassifiable for other reasons, such as noise or edge effects. We could not reach agreement on 4% of cases regarding whether a galaxy was a pure bulge or contained a disk component.
From the three different methods of disk selection (visual, Sérsic cut, blue-cloud cut) we obtain 625, 485, and 353 disk galaxies, respectively. Detailed results from the different methods of disk selection are presented in 4.1.
3.2 Characterization of Bars
We use the standard IRAF task ‘ellipse’ to fit ellipses to the galaxy isophotes out to , where is the radius at which the surface brightness reaches sky level. This method of ellipse fitting has been widely used to identify and characterize bars (e.g., Wozniak et al. 1995; Friedli et al. 1996; Regan et al. 1997; Jogee et al. 1999, 2002a, 2002b, 2004; Knapen et al. 2000; Laine et al. 2002; Sheth et al. 2003; Elmegreen et al. 2004; MJ07; Menéndez-Delmestre et al. 2007). We employ an iterative adaptive wrapper, developed by Jogee et al. (2004), which runs the task ‘ellipse’ up to a maximum number of iterations. Each iteration uses the previous fit to produce an improved guess for the isophote parameters. is typically set to 300, but for most objects we obtain a good fit in only a few iterations. A good fit is one where an ellipse is able to be fitted at every radial increment out to . As described in detail in Jedrzejewski (1987), the goodness of the ellipse fits is characterized by the harmonic amplitudes A3, B3, A4, and B4. The amplitudes of these components signify how well the shape of the actual isophote is approximated by the fitted ellipses (e.g., Jedrzejewski 1987). For this sample, we find typical amplitudes of 0–15% in the bar region. The advantages and limitations of the ellipse-fitting method are further discussed in detail in MJ07, where the statistical effects of deprojection are also addressed. We were able to successfully fit 97% of the visually identified disk sample of 625 galaxies. The galaxies where ‘ellipse’ fails generally do not have a regularly decreasing surface brightness profile, which is necessary to define the center for the fitting routine.
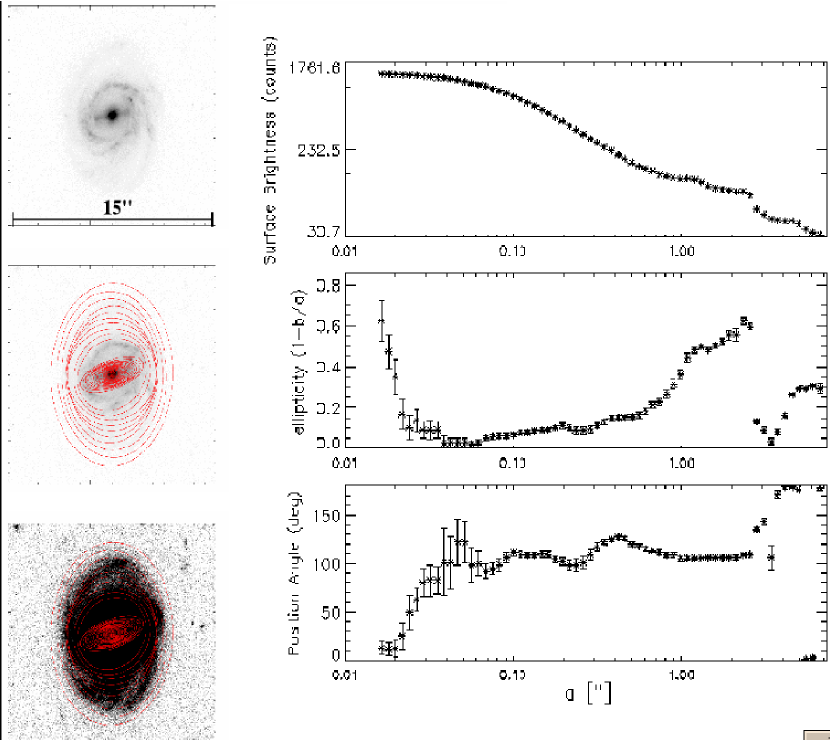
We overlay the fitted ellipses onto the galaxy images and plot the radial profiles of surface brightness (SB), ellipticity (), and position angle (PA). We use both the overlays and radial profiles to classify the disk galaxies as ‘inclined’, ‘barred’ or ‘unbarred’ using an interactive classification tool and quantitative criteria (Jogee et al. 2004). The three classes are described below. We also extract quantitative parameters from the radial profiles, such as the size, ellipticity, and PA of both the disk and bar.
Disk galaxies classified as ‘inclined’ have an outermost isophote with , corresponding to . Because it is difficult to identify morphological structures in such highly inclined disk galaxies, we do not attempt to classify them as ‘barred’ or ‘unbarred’. After discarding highly inclined disk galaxies (226 or 36%) and those with visually-identified poor fits (32 or 5%), we are left with 350 moderately inclined (), bright (), cluster disk galaxies. The luminosity and color distributions of the total sample of 785 bright, cluster galaxies, the visually-identified disk galaxy sample (N), and the moderately-inclined, ellipse-fitted sample of 350 disk galaxies are over-plotted in Figure 1a and b. The figure shows that no significant bias is introduced on and color by restricting the sample to moderately inclined disk galaxies.
For galaxies with moderate inclinations (), we classify a galaxy as barred if: (1) the rises smoothly to a global maximum, , while the PA remains relatively constant (within ), and (2) the then drops by at least 0.1 and the PA changes at the transition between the bar and disk region. These criteria have been shown to work well in identifying barred galaxies (e.g., Knapen et al. 2000; Jogee et al. 2002a,b, 2004; Laine et al. 2002). An example of the overlays and radial profiles of a barred cluster galaxy are shown in Figure 2. The semi-major axis of the bar is taken as the radius where the ellipticity reaches a global maximum (). The disk semi-major axis length and ellipticity are measured from the radius of the last fitted isophote.
The moderately inclined galaxies, which do not satisfy the bar criteria are classified as unbarred. This category includes clearly unbarred cases, as well as cases, which we denote as ‘PA twist’. The latter are systems where all the bar criteria are satisfied, except for the criterion of constant PA in the bar region: rather than being constant within , the PA of the high ellipticity feature may twist slightly more than this limit. Some of these ‘PA twist’ systems may actually be barred galaxies where the effects of dust and SF can cause the PA to vary more than it would in a near-IR image. This effect is more likely to happen with weak bars, where the dust lanes along the leading edges of the bar are curved, producing a ‘twisting’ in the PA radial profile (Athanassoula 1992b). Such weak bars are also associated with SF along their leading edge. Among the unbarred galaxies, we have 36 cases of ’PA twist’. We use this number as an estimate of the number of barred galaxies we might be classifying as unbarred in the optical images, and fold it into the error bar (upper limit) for the optical bar fraction.
Another effect we have to address is whether we can detect bars in the smaller/fainter disk systems. We consider in the following analysis only disk galaxies, which we define as galaxies with an outer disk component (e.g., S0-Sm) that may or may not be accompanied by a central bulge (see 3.1). As discussed in 2, our resolution is 280 pc. With ellipse-fitting, at least 2.5 PSF elements are necessary to detect a bar. This means that the lower limit on the bar radius () that we can reliably detect is 700 pc. It was already noted by Kormendy (1979) that the sizes of bars correlate with galaxy luminosity, and late-type, fainter galaxies host smaller bars. Erwin (2004; 2005) found that primary bars in galaxies later than Sbc can have radius as small as 500 pc. Thus, in order to avoid missing small bars in late-type, faint galaxies, we make a cut in galaxy semi-major axis kpc in addition to our magnitude cut of . We choose the value of kpc as a conservative cut, according to the following analysis. In our cluster sample, for visually identified disk galaxies ( 3.1), we find that and correlate with a mean ratio of / (Fig. 3a), where is calculated for the cluster sample from the absolute magnitude according to
| (2) |
from Schneider (2006). In MJ07 we find that most bars have ratios /0.2–0.4, where is the isophotal radius at which the -band surface brightness reaches 25 mag arcsec-2. Assuming a median / 0.3, it follows that in order to ensure that we are looking at galaxies that host bars larger than 700 pc, we need to select galaxies with pc, or pc. Using the mean / for our sample, this yields a galaxy semi-major axis of 2.7 kpc. There are only 10 disk galaxies that are eliminated by this cut. Figures 3b and 3c show the correlation of and with , showing only galaxies visually classified as disks. The dashed line in panel 3b at 0.7 kpc represents the limit in at which we can reliably identify all bars. The dashed line in panel 3c at 3 kpc indicates the cut in .
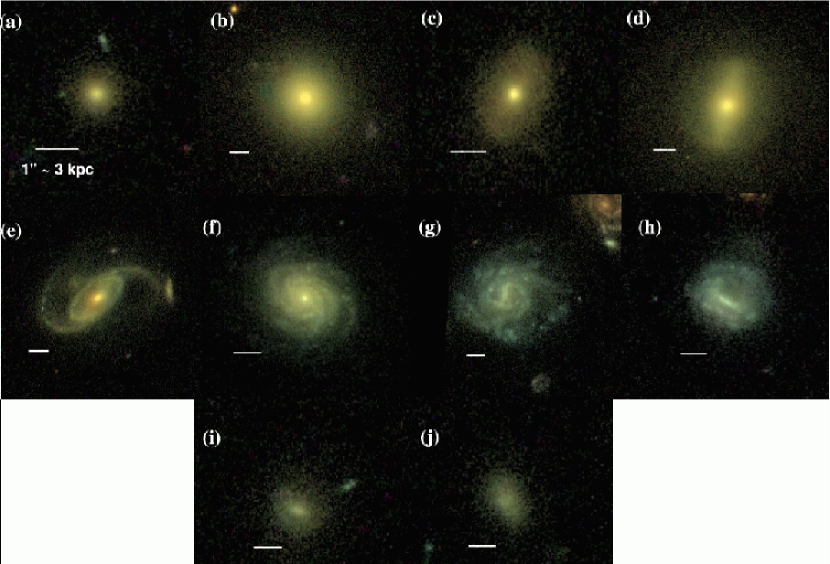
In addition to quantitatively identifying and characterizing bars using ellipse fitting, we also visually classify all galaxies in the sample. The identification of bars through visual inspection provides an independent check for the detection of bars through ellipse-fits. The visual bar classification agrees with the ellipse fits for over 90% of cases. For the cases where a bar is found through visual classification, but not through ellipse-fitting, it is because dust and gas mask the bar signature, making the PA twist. We conservatively take the upper error bar in the optical bar fraction as the sum in quadrature of the binomial term and the error of caused by isophotal twists. Note that the error from missed bars due to isophotal twisting can only make the bar fraction higher. Representative barred galaxies from the cluster sample are shown in Figure 4.
3.3 Visual Classification of Secondary Morphological Parameters
For our cluster sample, we visually classify secondary morphological parameters such as the prominence of the bulge and the presence of gas and dust.
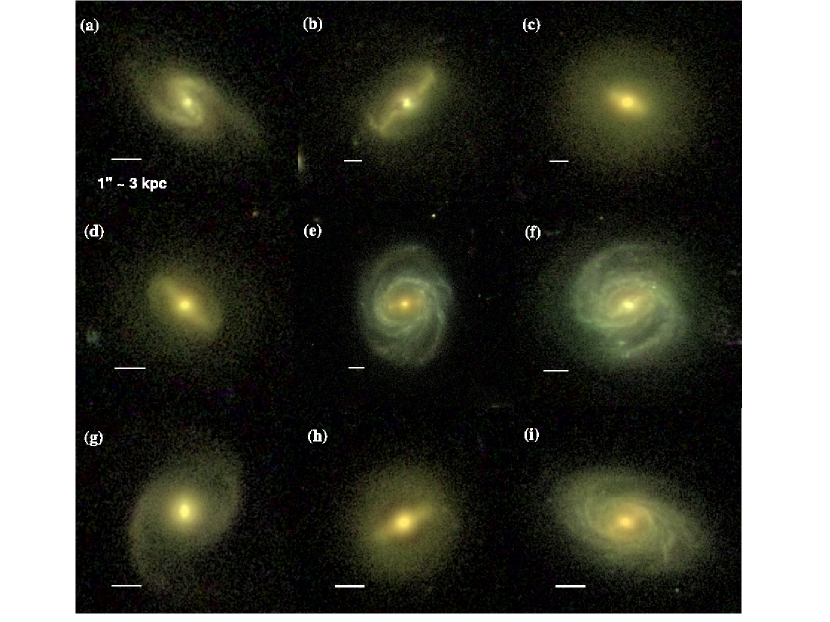
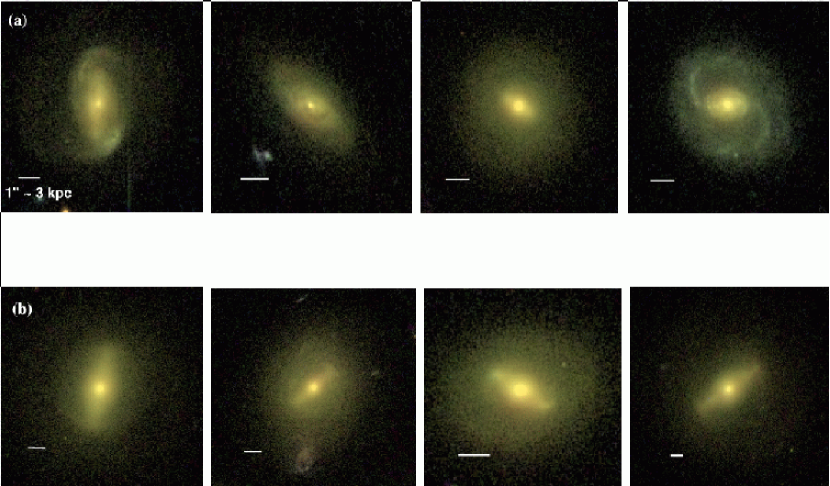
Since we are only interested in studying large-scale bars that extend well beyond the bulge region of the galaxy, the prominence of the bulge is not key for determining the bar fraction. It is interesting, however, for studying and interpreting correlations between bar and host disk properties (see 4.3–4.5). Our goal is not to finely measure the bulge-to-total light () ratio in galaxies, but to identify galaxies with extreme , such as systems that appear nearly bulgeless and likely have very low , and those with prominent bulges, suggestive of high . We thus classify galaxies into three broad groups: ‘pure bulge’ (Fig. 5a,b), ‘pure disk’ (Fig. 5g–j), and ‘bulge+disk’ (Fig. 5c–f). ‘Pure disk’ galaxies are those where no central spheroidal component is seen. Conversely, a galaxy is classified as a ‘pure bulge’ if its morphology is spheroidal and there is no break in the brightness profile, indicative of the transition between the bulge-dominated and disk-dominated region. In addition, ‘pure bulge’ galaxies do not exhibit disk features such as spiral arms or stellar bars. In our cluster sample of bright galaxies, we find that 23%12% of galaxies are visually classified as ‘pure disk’, 60%10% are classified as ‘bulge+disk’, and 17%1% were classified as ‘pure bulge.’ The values quoted are from the classifications of I.M. and the percent errors indicate the sum in quadrature of the dispersion between classifiers and the binomial term of the statistical error. The disagreement is due to the inherent difficulty in separating ellipticals from disk galaxies, when the disk is smooth and has no unambiguous disk signature, such as a bar or a spiral arm.
Seven members of the STAGES team performed an independent visual classification of the sample using the standard Hubble Type system. The agreement between our classifications and theirs on whether a particular galaxy is a disk galaxy was 70%. If their sample of visually selected disks is used for the analysis in 4, our results on the optical bar fraction do not change. Note that the standard Hubble type system is not optimal for our study. Principally, this is because Hubble types assume a correlation between the prominence of the bulge and the smoothness of the galaxy disk/spiral arms. While this correlation holds fairly well for field galaxies, it can break down in clusters, where there can be galaxies with large bulge-to-disk ratios but fairly smooth disks (Koopmann & Kenney 1998). We discuss this in more detail below.
In Table 1, we show the breakdown of morphological classes as a function of projected distance to the nearest cluster center for galaxies with . We take the core radius to be at 0.25 Mpc, because the number density of galaxies shows a sharp break at this radius (Heiderman et al. 2008). The outer region is defined as lying between the core radius at R = 0.25 Mpc and the virial radius of the cluster, R Mpc (Heymans et al. 2008). Beyond the virial radius is the outskirt region.
We also visually classify galaxies into those with a clumpy or smooth disk, motivated by the following considerations. Firstly, the presence of gas, dust, and star formation along the bar can prevent its detection in optical images, particularly for weak bars. In weak bars, the dust lanes are curved because of weaker shocks (Athanassoula 1992). In addition, weaker shocks can induce star formation along the bar, while strong shocks are accompanied by straight dust lanes and tend to suppress star formation along the bar (e.g., Elmegreen 1979; Das & Jog 1995; Laine et al. 1999; Jogee, Scoville, & Kenney 2005). The curved dust lanes and star formation regions in weak bars produce a pattern that causes fitted ellipses to have varying PA along the bar, and to sometimes fail to satisfy the criterion of a flat PA plateau along the bar ( 3.2). In very gas/dust-rich galaxies, even strong bars can be masked by dust and star formation. These effects make it more difficult to identify bars at optical wavelengths (e.g., Block et al. 1994). Several studies (Eskridge et al. 2000; Laurikainen et al. 2004; MJ07) show that, because of obscuration by gas, dust, and star formation regions in the optical, the bar fraction is higher in the infrared (IR) band by a factor of 1.3 for galaxies at 0. In cluster environments, the correction factor for bar obscuration is unknown.
Secondly, it is useful to explore the relationship between clumpiness, the visual prominence of the bulge, and bars in cluster environments, where the situation might well differ from the field. In the field, along the traditional Hubble Sequence, on average the visual prominence of bulge and the tightness of the spiral arms increase from Sd to Sa, while the clumpiness of the spiral arms decreases. In field galaxies, there is a wide range of for each Hubble type, with low galaxies being present across S0 to Sc (Laurikainen et al. 2007; Weinzirl et al. 2009; Graham & Worley 2008), but the average tends to fall in later Hubble types (Laurikainen 2007; Weinzirl et al. 2009; Graham & Worley 2008). In clusters, where a number of processes, such as ram-pressure stripping or galaxy harassment can alter the gas content of galaxies, the relationship between and gas/SF content or clumpiness of the disk may break down. For example, in the Virgo cluster, the central concentration of galaxies does not correlate with their star formation properties, as it does in the field (Koopmann & Kenney 1998). Wolf et al. (2008) discuss the effect of these issues with respect to the Hubble type classifications performed by the STAGES team.
Motivated by these considerations, we attempt to visually characterize the presence of gas and dust in galaxies. The degree of ‘clumpiness’ in a galaxy is used as a rough proxy for estimation of the presence of gas and dust. We allocate galaxies into two broad classes: (1) ‘smooth’ galaxies that show no patchy obscuration by gas and dust or (2) ‘clumpy’ galaxies that have a lot of patchiness indicative of the presence of gas and dust. We find that 73%2% (551/750) of the bright galaxies in our supercluster sample appear mostly smooth (contain little or no gas and dust), while 27%2% (199/750) of the bright galaxies appear clumpy (contain some gas and dust). The fractions quoted are from the classifications of I.M. and the percent errors indicate the sum in quadrature of the dispersion between classifiers and the binomial term of the statistical error. Examples of ‘smooth’ galaxies are shown in Fig. 5, panels a–d and i–j. ‘Clumpy’ galaxies are shown in panels e–h of Figure 5.
4 Results
4.1 Selection of Disk Galaxies in Clusters
How well do the Sérsic and blue-cloud cut methods pick out disk galaxies when compared to visual classification? Out of the 762 ellipse-fitted galaxies, 608 are visually classified as disks. This number is reduced to 573 if only galaxies with kpc are considered.
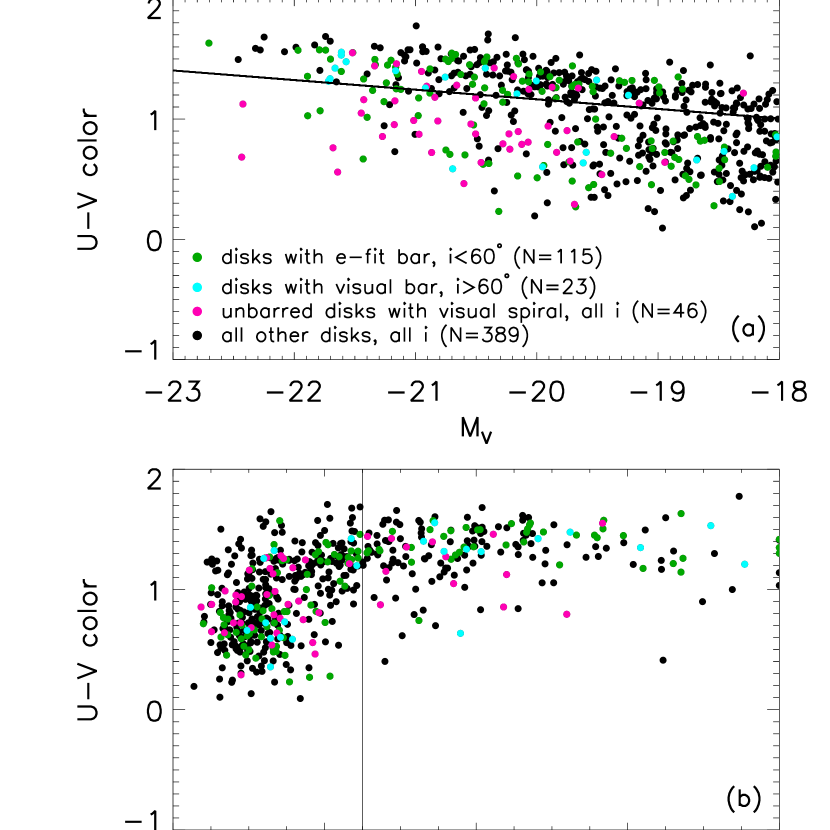
Figure 6 compares the disk galaxies identified through the three different methods: visual classification, blue-cloud color cut, and a Sérsic cut. In this paper, the color cut is made using color. Panel (a) shows where the visually-identified disk galaxies lie in the rest-frame vs. plane. Moderately-inclined, , barred galaxies are shown as green points, where the bars are identified through ellipse-fitting. Even though we did not identify bars with ellipse-fits for highly inclined galaxies with , and do not consider inclined systems in the rest of the study, bars were noted in such systems during the visual classification (cyan points). Unbarred galaxies with visually-identified spiral arms (all inclinations) are shown in pink. The black points show galaxies identified as disks with visual classification for all inclinations, but without a bar or spiral arms. The solid line separates the red sample from the blue cloud galaxies, using the equation
| (3) |
derived for the STAGES sample by Wolf, Gray, & Meisenheimer (2005), where is the absolute magnitude and is the rest-frame color. Panel (b) shows where visually identified disk galaxies lie in the color vs. Sérsic index plane. Symbols are the same as in panel (a). The solid line shows the cutoff of , which is supposed to separate disk galaxies and spheroids.
The technique of identifying disk galaxies as those with a Sérsic index (Fig. 6b) picks out (396/573) of galaxies visually selected as disks. The error bars represent the statistical error. The Sérsic cut method will pick up many of the red disks that the color cut misses, however the Sérsic cut method might miss some early-type disk galaxies with very prominent bulges or very clumpy galaxies with bright star formation regions in their outer disks. In addition, the presence of an AGN will drive the Sérsic index to high values. Figure 7a shows examples of visually-identified disk galaxies missed by the Sérsic cut.
Our analysis suggests that the Sérsic cut misses of visually-identified disks. How robust is this number? We consider the possibility that some galaxies visually classified as disk galaxies (‘pure disk’ or ‘bulge+disk’) may in fact be misclassified ellipticals. This is most likely to happen when the disk is smooth and has no unambiguous disk signature, such as a bar or a spiral arm. As stated in 3.3, it is difficult to separate a ‘pure bulge’ galaxy from an unbarred, smooth ‘bulge+disk’ (e.g., S0) without spiral arms. In addition, unbarred ‘pure disk’ galaxies without spiral arms that appear mostly smooth could also be misclassified ellipticals. As a firm lower limit to the number of visually-identified disk galaxies missed by the Sérsic cut we consider disk galaxies (‘pure disk’ or ‘bulge+disk’) that have a clear disk signature such as a bar and/or spiral arms. This sets a firm lower limit on the number of disk galaxies that are missed by a Sérsic cut. We find that at least 25% (67/267) of the galaxies with display unambiguous disk signatures. Thus, in summary, we estimate that 25% to 31% of visually-identified disk galaxies (e.g., S0-Sm) are missed by taking a Sérsic cut ().
The technique of selecting blue cloud galaxies picks out out (279/573) of the visually-identified disk galaxies. The 294 galaxies missed are in the red sample and the large number of these galaxies is consistent with the high number of red disks in a cluster environment. Figure 7b shows some examples of visually-identified disk galaxies in the red sample, which would be missed if a blue-cloud color cut is used to pick out disks.
It is interesting to look at the composition of the red sample in more detail. The 294 visually-identified disks make up 75% of the total population of 390 red sample galaxies. Galaxies classified as ‘pure bulge’ (e.g., E’s) make up 25% (96/390). Out of the galaxies visually identified as disks in the red sample, 95% (279/294) are classified as ‘bulge+disk’ and only 5% (15/279) are classified as ‘pure disk’ with no visible bulge component.
The large proportion of the red sample consisting of visually identified disk galaxies (e.g., S0-Sm) may seem surprising if one typically thinks of the red sample as made up mostly of ellipticals. However, Wolf et al. (2008) have shown that the red sample in the cluster contains both galaxies on the red sequence and also dusty red disk galaxies which do not lie on the sequence. Again, we set a firm lower limit to the disk galaxies in the red sample, by considering disk galaxies (‘pure disk’ or ‘bulge+disk’) that have a clear disk signature such as a bar and/or spiral arms. This gives a robust lower limit of 22% (84/390) of galaxies in the red sample that are disks. Thus, in summary, our results suggest that 22% to 75% of the red sample is made up of disks, with the large range primarily caused by the difficulty in differentiating red, featureless S0-type galaxies from spheroidals (see Figure 5). A significant fraction of dusty, red disk galaxies in the supercluster sample is also found by Wolf et al. (2008), where the properties of these galaxies are discussed in detail.
In summary, we have explored how three commonly used methods for selecting disk galaxies in the field, namely, visual classification, a single component Sérsic cut (), and a blue-cloud cut, fare in the A901/902 cluster environment. We found that the Sérsic cut and blue-cloud cut methods suffer from serious limitations, and miss 31% and 51% , respectively, of visually-identified disks, particularly the many red, bulge-dominated disk galaxies in clusters. In cluster environments, the latter two methods are not well suited to reliably picking disk galaxies. Thus, unless otherwise stated, we use the visual classifications to define a disk galaxy sample in the remaining analysis.
4.2 Global Optical Bar Fraction
The optical fraction of barred galaxies among all galaxies brighter than , is . However, this number is not very useful as changes in this number can reflect a change in the disk fraction, as well as the fraction of disks that host bars. Furthermore, stellar bars are instabilities that occur only in disks, and insights into their formation and evolution can be best gleaned by inspecting the fraction of disks that are barred at different epochs and in different environments.
As mentioned in 3.1, this has motivated the definition of the bar fraction as the fraction of disks that are barred as given by Equation 1. All studies of bars to date (e.g., deVaucouleurs 1963; Sell wood & Wilkinson 1993; Eskridge et al. 2000; Knapen et al. 2000; Mulchaey & Regan 1997; Jogee et al. 2004; Laurikainen et al. 2004; Elmegreen et al. 2004; Zheng et al. 2005; Buta et al. 2005; MJ07; Menéndez-Delmestre et al. 2007; BJM08; Sheth et al. 2008) have adopted this definition and thus provide complementary comparison points for our studies.
For the STAGES cluster, we use visual classification to define a disk galaxy sample (see 3.1 and 4.1) and calculate the optical bar fraction . We find 34%. This value is similar to the optical bar fraction 25% found for galaxies brighter than in intermediate-redshift ( 0.4–1.0) clusters by Barazza et al. (2009).
For completeness, we also calculate the bar fraction using a blue-cloud color cut and Sérsic cut to select disk galaxies. The results are shown in Table 2 for bright () galaxies, and in Table 3 for galaxies with M∗/M. Although the three disk selection methods pick very different number of disks (Tables 2, 3, and 4.1), they yield a similar optical bar fraction in the range of 29–34%, This result means that the optical bar fraction in blue galaxies picked out by the color cut and that in low Sérsic index galaxies, is similar to the total average bar fraction found through selecting disk galaxies by visual classification (Tables 2 and 3).
4.3 Optical Bar Fraction as a Function of the Prominence of the Bulge
We explore the relationship between the optical bar fraction and host galaxy properties, such as the prominence of the bulge.
While we did not perform a structural bulge+disk+bar decomposition to accurately characterize (e.g., Laurikainen et al. 2007, Weinzirl et al. 2009), we can use the three broad visually-classified groups of galaxies: ‘bulge+disk’, ‘pure disk’, and ‘pure bulge’.
We plot the optical fraction of bars as a function of morphological class in Figure 8a. Here the morphological classes have been grouped by the visual prominence of the bulge. Galaxies with a ‘bulge+disk’ component are in the first bin, while ‘pure disk’ galaxies are in the second bin. We find that increases from 29% in ‘B+D’ galaxies to 49% in ‘pure disk’ galaxies, suggesting that the optical bar fraction rises in spiral galaxies, which are disk-dominated and have very low bulge-to-disk ratios. This result is also shown in Table 4
This result is further suggested by Figure 8b, which shows the optical bar fraction as a function of central concentration in the host galaxy, as characterized by the effective radius normalized to the disk radius, /. The effective radius is calculated from single-component Sérsic fits (Gray et al. 2008). The disk semi-major axis comes from the semi-major axis of the outermost ellipse fitted to each galaxy, where the isophotes reach sky level (see 3.2). The optical bar fraction clearly increases with decreasing central concentration, from 15% in galaxies with high concentration (/=0.15), to 50% in galaxies with low concentration (/=0.75). We note that the optical bar fraction does not show a similar correlation with Sérsic index for this sample, as there is a large scatter of within each morphological class. In addition, the relationship of the optical bar fraction with / in Figure 8b can be compared with previous studies (BJM08), which show a similar trend in the field.
At this point, it is important to ask whether the trend of a higher in disk galaxies with no significant bulge component is real, or due to systematic effects which cause us to miss primary bars in galaxies with prominent bulges. In this paper, we are considering large-scale primary bars, which by definition lie outside the bulge region. If the bar is strong and/or extended well beyond the bulge region, it is unlikely that the ellipse-fit method and quantitative criteria described in 3.2 would miss the bar. On the other hand, if the bar is only slightly larger than the bulge, one may face cases where the ellipse-fit method might miss the bar. Furthermore, if the bar is intrinsically weak (i.e. of low ellipticity), then the dilution effect of the large bulge may cause the measured ellipticity of the weak bar to fall below the cutoff value (0.25) where it would be considered a bar. We tested and assessed these effects in several ways described below.
Firstly, we note that studies using a method different from ellipse fitting, namely 2D bulge-disk-bar decomposition on nearby galaxies, also show that galaxies with a larger bulge-to-total ratio () host a lower proportion of bars than galaxies of lower (Weinzirl et al. 2009). For disk galaxies with , the bar fraction increases from 31%13% in spirals with , to 68%4% in spirals with (see their Table 8 and 5.6). Of course, one could argue that 2D bulge-disk-bar decomposition is also more likely to miss the bar component, when the bar contains a much smaller fraction of the light than the bulge. We therefore performed a second test. In addition to using ellipse-fitting to detect bars, we also visually inspect all galaxies as an extra check. We expect that we would see most short bars in galaxies with large bulges via visual classification. We only find two such cases. This small number is not enough to make up for the large drop in toward bulge-dominated galaxies.
We also performed a third test. If the trend of a lower in bulge-dominated galaxies was due to the fact that a prominent bulge causes us to systematically miss bars with low ellipticity around 0.25, then we would not expect the trend to persist if we only include strong (high ellipticity) bars. We tested this by recomputing the optical bar fraction in pure disks and B+D systems after applying a lower limit cutoff 0.4 and 0.5 on the bar ellipticity. In both cases, we find that the trend of a higher in disk galaxies without prominent bulges remains. We conclude that the latter trend is likely real, and will explore theoretical scenarios that could account for it in 5
We also note that the rise in the optical bar fraction as a function of the prominence of the bulge or central concentration of the host galaxy is in agreement with BJM08, which found that the optical bar fraction in pure disk galaxies is a factor of 2 higher than in disk galaxies with prominent bulges, for an SDSS sample of blue-cloud galaxies and redshift range . This result is confirmed by A09, who find that the optical bar fraction increases from 29% in S0 galaxies, to 54% in late-type (Sc-Sd) systems, using SDSS galaxies at .
4.4 Optical Bar Fraction as a Function of Host Luminosity
In Figure 9a-c we show the optical bar fraction as a function of host galaxy rest-frame magnitude . The optical bar fraction is calculated for all three methods of disk selection (color cut, Sérsic cut, and visual classification). For all three methods of disk selection, the optical bar fraction shows a decrease from 60% at to 20% at .
This result may seem counter-intuitive given the fact that we find a lower optical bar fraction in bulge-dominated galaxies, and we might expect such systems to be on average brighter. However, Table 5 explains why we find the opposite result. This table shows how the optical bar fraction varies as a function of morphological class and absolute magnitude. Here the morphological classes refer to the four visually-classified disk morphological classes: ‘bulge+disk smooth’, ‘bulge+disk clumpy’, ‘pure disk smooth’, and ‘pure disk clumpy’. Table 5 shows that the optical bar fraction is higher at brighter for any given morphological class. Therefore, when all of the visual morphological classes are grouped together and is calculated as a function of in Fig. 9c, the optical bar fraction is higher for brighter magnitudes.
This result is consistent with the findings of Barazza et al. (2009) for cluster galaxies at intermediate redshifts ( 0.4–1). This study also finds that, although brighter, early Hubble type galaxies host fewer bars than fainter, late-type galaxies, within a given Hubble type, brighter galaxies on average have a higher optical bar fraction.
4.5 Optical Bar Fraction as a Function of Host Color
We find no significant difference in the optical bar fraction in disks on the red sequence and blue cloud. When disks are selected through visual classification, the optical bar fraction on the red sequence is 34% and on the blue cloud, it is 34%. This can be easily seen by inspection of Fig. 6. The identical values for the blue cloud and red sequence explain in part why the global optical bar fraction based on visual selection of disks, is similar to the one obtained by selecting disks via a blue cloud cut.
Taking a global average of the optical bar fraction across the blue cloud and red sequence may not reveal the dependence of the optical bar fraction solely on color because the relative number of bright to faint galaxies is different on the blue cloud and red sequence, with the red sequence having more bright galaxies (Fig. 6). As already shown in 4.4, the bright systems have a higher optical bar fraction than fainter galaxies, since the optical bar fraction rises at higher luminosities for each given morphological type (Table 5). Therefore, we expand the exploration of the optical bar fraction by looking at the breakdown of the optical bar fraction as a function of rest-frame and (Table 6), as well as and visual morphological class (Table 7).
4.6 Optical Bar Fraction as Function of Kappa, , ICM density, and Distance to Nearest Cluster Center
How does the local environment affect the optical bar fraction, and where do barred galaxies live with respect to the density peaks in the A901/902 cluster environment? In this section, we make a first step in exploring these questions using four traces of local environment density: the line-of-sight projected surface mass density (Heymans et al. 2008), the local galaxy number density (Wolf, Gray, & Meisenheimer 2005; Gilmour et al. 2007), the ICM density as characterized by the X-ray emission from hot intra-cluster gas in counts, and the projected distance to the nearest cluster center. We calculate by finding the radius enclosing the ten nearest neighbors to a galaxy. This is used to calculate a galaxy number density, quoted in . Maps of for the Abell 901/902 field are constructed by Heymans et al. (2008) through an analysis of weak gravitational lensing, which is sensitive to the line-of-sight projected surface mass density.
Figure 10 shows the variation of the three measures of local environment density (, , and ICM density) with distance to the nearest cluster center. It is evident from all three tracers, that local density decreases with increasing distance from the nearest cluster center. The core, outer region, and outskirt of the clusters are defined in 3.3. One caveat in this analysis is that the quantities used are projected quantities.
Figure 11 shows the variation of the optical bar fraction function of: (a) distance from nearest cluster center, (b) log , (c) , and (d) ICM density. We find that between the core and the virial radius of the cluster ( 0.25 to 1.2 Mpc), the optical bar fraction does not depend strongly on the local environment density tracers (, , and ICM density), and varies at most by a factor of 1.3, allowed by the error bars.
Within the core region, the small number statistics and projection effects make it hard to draw a robust conclusion on the detailed variation of the optical bar fraction. In fact, the detailed behavior seen as we move from the outer region to the cluster core varies according to which indicator is used: shows no change when using projected radius (Fig. 11a), dips by a factor of 1.5 when using (Fig. 11b), or (Fig. 11c), and rises by a factor of 1.2 when using the ICM density (Fig. 11d). Given the small number statistics, projection effects, and the fact that different indicators suggest different trends in the cluster core, we can only say that inside the cluster core, we do not find evidence for a variation stronger than a factor of 1.5 in the optical bar fraction as a function of any of the three environmental indicators in Fig. 11.
How do our results compare to other studies? The recent study of bars in field and intermediate density regions by A09 reports no variation of the optical bar fraction with , where varies between -3 and 2. On the other hand, several previous studies have found an enhanced optical bar fraction toward cluster centers (Barazza et al. 2009; Thompson 1981; Andersen 1996). We discuss the implication of the results from our study as as well as these other works in 5.
4.7 Comparison of the Optical Bar Fraction in the A901/902 Clusters and the Field
To further explore the impact of environment on the evolution of bars and disk galaxies, it would be desirable to compare the properties of disk galaxies in cluster and field samples, which are at similar redshifts and are analyzed in a similar way. We do not have a field sample at the same redshift as that of the A901/902 supercluster ( 0.165), and therefore resort to an approximate comparison only, bearing in mind the caveats.
We compare the results on bars and disks from the STAGES sample to those from studies of nearby galaxies by MJ07 and A09. In these studies, bars are identified and characterized through ellipse-fits, as for our STAGES study. The sample of MJ07 is based on moderately inclined galaxies in the Ohio State University Bright Spiral Galaxy Survey (OSUBSGS; Eskridge et al. 2002), which contains galaxies of RC3 type S0/a or later, (0 T 9), , , and . This sample is dominated by early to intermediate-type (Sab-Sc) galaxies, in the range to . The galaxies are local field spirals, and strongly interacting galaxies are not included in the MJ07 analysis.
The sample of A09 is based on the Sloan Digital Sky Survey (SDSS; Abazajian et al. 2004) within the redshift range 0.01–0.04 and with . Hubble types for galaxies in this sample are from visual classification, bars are identified through ellipse-fitting and environment density is estimated from the projected local galaxy density (). The densities considered in the A09 sample range from the field to intermediate densities comparable to those in the outer regions and outskirts of our clusters ( from -3 to 2).
Before we compare the results obtained for bars in the cluster with those from the field studies, we compare the properties (e.g., absolute magnitude, color) of the underlying galaxy populations in the field and cluster samples. In Figure 12a–b, we compare the distributions of absolute magnitude and rest-frame color for the STAGES cluster, OSUBSGS, and SDSS field samples. The SDSS data are from A09. The OSU sample is brighter, and is dominated by galaxies in the range to , while the STAGES sample is dominated by galaxies in the range to . The SDSS sample spans a narrow range in to . The STAGES and OSU samples have a similar range in color, although the OSU sample has a slightly higher proportion of bluer galaxies.
We have shown that the optical bar fraction is a strong function of galaxy morphology and luminosity. It is therefore important to compare not only the global optical bar fraction, averaged over all galaxy types for a given magnitude cut, but also to compare galaxies of different morphological types, namely spiral galaxies with prominent bulges and spiral galaxies that appear as pure bulgeless disks. The latter galaxies are also of particular interest as they present a potential challenge to hierarchical CDM models.
Table 8 shows the detailed comparison of the optical bar fraction between field and cluster galaxies. The comparison is done separately for very bright (parts A and B of Table 8) and moderately bright to faint (part C of Table 8) galaxies. The global optical bar fraction averaged over all galaxy types in the samples, as well as the optical bar fraction for galaxies classified as ‘bulge+disk’ (B+D), and galaxies with pure disks, are shown.
The upper error bar on the optical bar fraction quoted for this study and MJ07, is the sum in quadrature of the error in the bar fraction from isophotal twists ( 3.2) and the statistical error. Note that including isophotal twists into the optical bar fraction can only make the optical bar fraction higher. Therefore, the lower error bars quoted represent only the statistical error.
When comparing bright galaxies in STAGES with the OSU field survey (part A in Table 8), we find that the average global optical bar fraction, as well as the optical bar fraction for galaxies with B+D is slightly higher. However, the difference is not significant within the error margins.
When comparing bright galaxies in STAGES with the SDSS field survey (part B in Table 8), we find that for the STAGES cluster sample is higher than the field by a factor of 1.2. In Table 8 part C, we show the comparison of the optical bar fraction for faint galaxies to between the STAGES cluster sample and the SDSS sample. We find that the optical bar fraction for early-type ‘B+D’ galaxies in the cluster is lower by a factor of 0.6. For late-type ‘pure disk’ galaxies, the optical bar fraction in the cluster is higher by a factor of 1.2.
In summary, for bright early Hubble types, as well as faint late-type systems with no evident bulge, the optical bar fraction in the Abell 901/2 clusters is comparable within a factor of 1.2 to that of field galaxies at lower redshifts ().
4.8 Bar Strength Distribution in the A901/902 Clusters and the Field
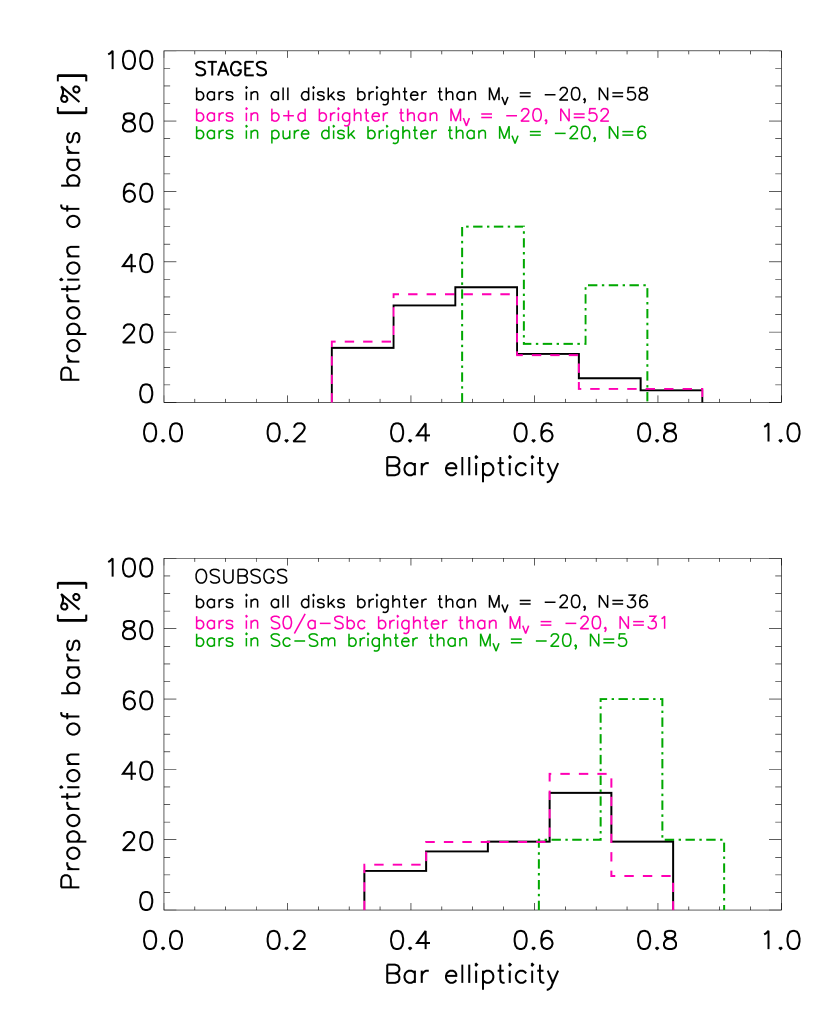
Since we have found that the optical bar fraction is a strong function of , for the following analysis, we focus on galaxies brighter than in all samples. Figure 13a–b shows the peak ellipticity distributions for the STAGES and OSUBSGS samples, respectively. In panel (a) the pink and green lines show the distributions for galaxies classified as ‘bulge+disk’ and ’pure disk’, respectively. In panel (b) the distributions are split into bulge-dominated galaxies (S0-Sbc; pink) and (Sc-Sm; green).
We find that in both the cluster and field, the highest ellipticity bars lie in disk-dominated galaxies, although number statistics for this group are low in both samples, for galaxies brighter than . In the A901/902 cluster system at , peaks at lower values ( 0.5) than in lower-redshift field OSUBSGS galaxies ( 0.7).
The result of lower in STAGES compared to OSU could be caused by more bulge-dominated hosts in STAGES than OSU. Bars in galaxies with large bulges can appear weaker (i.e., rounder). This effect has been observed in the STAGES sample, as well as in SDSS by BJMO8, and could be an artifact due to the apparent dilution of the ellipticity of the bar isophotes by the bulge. If it is not an artifact, it is possible that a massive bulge can affect the actual bar supporting orbits and cause the bar to become rounder. The same result is seen using (the maximum gravitational torque induced by the bar normalized to the axisymmetric component) for characterizing bar strength (Laurikainen et al. 2007).
However when measuring the Fourier amplitude of the bar to characterize bar strength, early-type galaxies appear to host stronger bars (e.g., Laurikainen et al. 2007). The bar-to-total mass ratio also increases toward early-type galaxies, although with large scatter, as measured from 2D bulge-disk-bar decomposition (Weinzirl et al. 2009).
5 Discussion
We can use clusters as a laboratory for learning about the interplay between internal and external drivers of galaxy evolution. Bars are the most efficient internal drivers of galaxy evolution, however it is still an open question what makes one galaxy more susceptible to bar formation than another, and how bars evolve as a function of epoch and environment. The situation is complex because, in principle, the fraction of barred galaxies in a cluster depends on the epoch of bar formation, the robustness of bars, the interplay between cluster environmental processes (harassment, tidal interactions, ram pressure stripping), and the evolutionary history of clusters.
The relationship between the bar and the properties of its host galaxy, such as the Hubble type or bulge-to-total () ratio has been explored in several studies (e.g., Odewahn 1996; BJM08; A09; Weinzirl et al. 2009; Laurikainen et al. 2009), focusing mainly on field galaxies. We first discuss results reported to date on how the bar fraction varies from intermediate to late Hubble types (Sbc to Sd or Sm). The early study by Odewahn (1996) found that the optical fraction of strong bars rises from intermediate to late Hubble types (e.g., from Sbc to Sm). The study by BJM08, where the sample of disk galaxies was dominated by galaxies of intermediate to late Hubble types, also found that the optical bar fraction rises in galaxies that tend to be disk-dominated and devoid of a bulge. Similarly, in the study by Weinzirl et al. (2009), the near-IR bar fraction was found to be larger toward systems of low bulge-to-total () ratios. Thus, the trend of a higher bar fraction in disk-dominated systems is reported by at least three studies. Our results in the study of A901/902 (see below) are also in agreement with this trend.
As we go from intermediate to early Hubble types, (e.g., from Sbc to S0/a to S0), two recent studies seem to agree that the bar fraction is much lower in S0 than among galaxies of type Sbc to S0/a. Laurikainen et al. (2009) report that the NIR bar fraction first rises in going from spirals (Sa-Scd) to S0/a, and then falls sharply among S0 galaxies. The study by A09, based on SDSS galaxies, finds an optical bar fraction of 29% in S0, compared to 55% in early type (S0/a-Sb), and 54% in intermediate-to-late type (Sbc-Sm). Thus, they confirm that the bar fraction drops sharply among S0s, but unlike Laurikainen et al. (2009), they do not find evidence for an increase from Sbc to S0/a.
In summary, when considering all the studies to date (Odewahn 1996; BJM08; Weinzirl et al. 2009; Laurikainen et al. 2009; A09) it appears that the bar fraction is highest in late type Sd-Sm disk-dominated galaxies and lowest among S0, while conflicting results exist on how the bar fraction varies from S0/a to Sc.
How do our results in the A901/902 supercluster compare to the above results in the field? We have found that the optical bar fraction in the A901/902 cluster system depends on both the bulge-to-disk ratio and the luminosity ( 4.3 and 4.4). We do not have quantitative measures of bulge-to-total () ratios in order to classify galaxies into Hubble types, but we separate spirals into two broad classes: those with ‘bulge+disk’ and those that are ‘pure disks’. We then found that at a given luminosity, is higher among galaxies, which are ‘pure disks’, without a significant bulge component, as compared to those with a bulge. In 4.3, we explored whether this trend could be artificially caused by systematic effects whereby a more prominent bulge might cause us to systematically miss primary bars. We concluded that this was unlikely, and that the trend of a higher in galaxies without a bulge, as opposed to those with bulges, is a robust one. This trend is in agreement with the above-described results from earlier studies (e.g., Odewahn 1996; BJM08; Weinzirl et al. 2009).
In addition, we have found a new hitherto unappreciated dependence of the bar fraction on luminosity. Specifically, we find that for a given visual morphological class, rises at higher absolute magnitude. A concurrent study by Barazza et al. (2009) similarly report that for cluster and field galaxies at with early Hubble types S0-Sb, the bar fraction rises for brighter galaxies. Our results thus suggest that the relationship between bar fraction and bulge-to-disk ratio may not be a monotonic one, and may depend on other factors, such as the gas content or luminosity.
How do our results and those reported from other studies fit within theoretical scenarios of bar formation? Let us first consider the trend of a higher in galaxies classified as ‘pure disk’. In one theoretical scenario, it has been suggested that bars can form and be maintained through the swing amplification of gravitational instabilities (e.g., Toomre 1981; Binney & Tremaine 1987) in dynamically cold disks. The presence of a significant amount of cold gas in the disk lowers the Toomre parameter, favoring the onset on gravitational instabilities. Typically is needed for efficiently maintaining the swing amplifier. Such bars are less likely to grow in galaxies where a prominent bulge leads to an inner Lindblad resonance (ILR), which cuts off the feedback loop for swing amplification (by preventing stellar spiral density waves from going through the center of the galaxy). The existence of an ILR requires not only the presence of a bulge, but requires a large in order to produce a large enough density contrast between the inner and outer regions of the disk. Therefore, in this scenario, it is expected that galaxies with a large gas mass fraction and/or with no ILR are more likely to host bars than galaxies, which are gas-poor and have ILRs, for instance, due to a prominent bulge.
Our result in A901/902, and the results in the field by BJM08, whereby the bar fraction is higher in galaxies with pure disks than in galaxies with bulges, seem broadly consistent with this scenario. We also note that the drop in bar fraction among S0s (Laurikainen et al. 2009; A09) is also consistent with this framework, since S0s have prominent bulges, likely host ILRs, and have a low gas mass fraction. One would like to know whether it is the ratio or the gas fraction that primarily control the bar fraction. For field galaxies where the pure disk spirals (Sd) have both a low and a large gas fraction, it is difficult to disentangle these two factors. However, the fact that we see a higher among pure disks in clusters suggests that the gas content of the disk is less relevant, since cluster galaxies can be stripped of their gas by various cluster processes (e.g., Balogh et al. 2000; Quilis et al. 2000). For the A901/902 cluster system, we find that 73%2% of galaxies appear smooth (i.e., contain little or no patchiness caused by dust/gas).
However, the above scenario where bars are formed and maintained through the swing amplification of gravitational instabilities cannot fully explain the full range of observational results to date. For instance, our result that within a given morphological class, rises at higher luminosity requires us to consider other theoretical aspects of bar evolution, such as the effect of the DM halo. Studies have found that the DM fraction rises for lower luminosity systems, although with large scatter (Persic et al. 1996; Kassin et al. 2006). The interplay between a DM halo and the disk can influence both the formation and subsequent growth of a bar. In early simulations with rigid DM halos, the halo acts as a dynamically hot component and thus tends to make an embedded unbarred disk more stable against bar formation. We note that such earlier simulations (e.g., Ostriker & Peebles 1973), using rigid rather than live DM halos, may have exaggerated the inhibition of the bar. In more recent simulations, live halos are used to represent a more realistic view of real galaxies and bar evolution. Debattista & Sellwood (2000) find that in simulations with live halos, bars form readily and are difficult to destroy. A massive live halo has the effect of braking the bar through dynamical friction, where the amount of braking depends on the DM halo-to-disk mass ratio within the region of the disk. Athanassoula (2002, 2003) finds that the distribution of the halo mass is the most influential factor dictating the evolution of the bar. Bars in more halo-dominated simulations develop more slowly than bars embedded in disks that are massive compared to the halo in the inner regions. However, although the bars grow more slowly, they tend to become stronger because the live DM halo acts a sink for angular momentum transferred out by the bar.
In the context of these simulations, one would expect bars to form and grow more slowly in galaxies with higher DM fraction, namely in fainter galaxies. Our results are consistent with some aspects of this scenario. Our results of a higher among brighter galaxies may be related to the faster and more efficient growth of bars in brighter galaxies with lower DM fraction. However, another prediction of these simulations is that bars in brighter galaxies with lower DM fraction would, in the end, be weaker. We do not find statistical evidence of a change in with luminosity. The mean for galaxies fainter than , compared to the mean for galaxies brighter than . This change in the mean by a factor of 1.2 is within the statistical error.
How does the frequency and evolution of bars differ in different environments? In 4.6, we found that between the core and the virial radius of the cluster ( 0.25 to 1.2 Mpc) at intermediate densities (log() to 2.3), the optical bar fraction does not depend strongly on the local environment density tracers (, , and ICM density), and varies at most by a factor of 1.3, allowed by the error bars. These results agree with those of A09 for intermediate densities. A09 find no dependence of the optical bar fraction on local environment density, over a wide range of log() to 3. The average galaxy number density in A09 is lower than our sample, and is comparable to the environments present in the outer region of our cluster sample (Fig. 11), where we also find no dependence of the bar fraction with . Recently, Romano-Díaz et al. (2008) used theoretical models to study the formation of bars in a cosmological context. Their results suggest that interaction with the halo sub-structure induces bars. Because this substructure is present in all environments, these models imply a similar bar fraction across a large range of environment densities, which is consistent with our results.
Inside the cluster core at the highest densities, our data do not yield conclusive results for several reasons. Firstly, the number statistics are very limited, and at best, within the caveats of limited number statistics, we can say that does not show evidence for a variation larger than a factor of 1.5 toward the core as a function of the environmental indicators ( 4.6). Secondly, the detailed behavior seen as we move from the outer region to the cluster core varies according to which indicator is used: shows no change when using projected radius (Fig. 11a), dips by a factor of 1.5 when using (Fig. 11b), or (Fig. 11c), and rises by a factor of 1.2 when using the ICM density (Fig. 11d).
Some early studies looked at the optical bar fraction toward the centers of local clusters (Thompson 1981; Andersen 1996). These studies use visual classification of Coma and Virgo galaxies, respectively. Both studies use the velocity distributions of cluster galaxies to argue that the fraction of barred galaxies is enhanced toward the cluster cores. Thompson (1981) finds that bars occur twice as often in the core compared to the outskirt region of the Coma cluster, while Andersen does not quote specific numbers. A recent study by Barazza et al. (2009) using ellipse-fitting on a sample dominated by galaxies with to at intermediate redshifts 0.4–1, finds a rise in the optical bar fraction of a factor of 2 in cluster cores. However they caution that this result may be affected by low number statistics.
Although, we cannot make a conclusive statement about the behavior of the bar fraction in the core region based on our data, we can speculate on what effects are at play in the cluster cores that might affect the bar fraction and trends found in previous studies. The possibility raised by previous studies (Thompson 1981; Andersen 1996; Barazza et al. 2009) that the optical bar fraction in the cluster core is higher (or not significantly lower) from that in the outer region of the cluster may at first seem puzzling because bulge-dominated galaxies are generally prevalent in cluster cores. Given our results of a lower optical bar fraction in bulge-dominated galaxies ( 4.3), one might naively expect a sharp drop in the optical bar fraction toward the cluster cores. The fact that such a drop is not seen, suggests that other processes in the core tend to enhance the bar fraction, thereby countering the drop. We discuss two such processes below.
In the cluster core, the galaxy collision and interaction timescale is very short because of the high galaxy number density () and the large galaxy velocity dispersion ():
| (4) |
where is the collision cross-section. Heiderman et al. (2008) calculate for the core, outer region, and outskirt of the Abell 901/902 system. They find that in the cluster cores is 0.7 Gyr, compared to 10 Gyr and 200 Gyr in the outer region and outskirts, respectively. Thus, galaxy tidal interactions are expected to be frequent in the A901/902 cluster cores. This can lead to the tidal triggering of bars in sufficiently cold disks and would tend to raise the optical bar fraction in cluster cores.
Another additional factor favoring bar formation in cluster cores is that the frequent tidal interactions are unlikely to develop into galaxy mergers or into strong galaxy interactions associated with large tidal heating because the galaxy velocity dispersion is large (700 to 1000 km/s for the A901/902 system; Gray et al. in prep.). The latter type of mergers or interactions tend to lead to strong tidal damage and heating of the disk and could destroy the bars. The results of Heiderman et al. (2008) are consistent with this scenario: they find that in the A901/902 clusters, the galaxy mergers and strongly interacting galaxies (those with strong morphological distortions) are rare and tend to be located outside the cluster core, in the outer region between the core and virial radius. This supports the idea that the large galaxy velocity dispersion in cluster cores are not conducive to mergers and violent interactions. In effect, the core environment may well provide many frequent weak, non-destructive tidal interactions (harassment), which favor the triggering of bars in cold disks. In such a case, the trend of a lower bar fraction from a population of galaxies with high in the core, may be counteracted by the opposite tendency for core environmental processes (e.g., harassment) to favor bar formation222One way to further test the hypothesis that tidal triggering of bars via harassment is important toward the core would be to look at how the optical bar fraction for systems with a fixed narrow range of varies within the cluster. Unfortunately, in the core, we do not have enough number statistics for pure disk systems ( 0) and no quantitative measure of to split the class of ‘bulge+disk’ systems into sub-classes with narrow ranges of . We find no conclusive trend of the bar fraction with density within the clusters for the broad class of ‘bulge+disk’ systems..
It is also interesting in this context to note that higher bar fractions have been reported for binary pairs of galaxies (e.g., Elmegreen et al. 1990; Varela et al. 2004). Elmegreen et al. (1990) find a similar bar fraction in field and groups ( 30%), and a higher fraction in galaxy pairs ( 50%), but only for early Hubble types. Their study is based on visual classifications from a number of different field, group, and binary samples of nearby galaxies. Binary pairs vary in separation, but all have projected separation distances kpc. Varela et al. (2004) also find that the optical bar fraction in binary pairs is twice as high as in isolated galaxies, again only for early Hubble types. This is consistent with the idea that weak interactions may enhance the bar fraction.
6 Summary and Conclusions
We have used the STAGES survey of the Abell 901/902 supercluster in F606W at z0.165 to study the properties of barred and unbarred disks in a dense environment. Ellipse-fitting was used to identify and characterize the properties of bars in our sample. Visual classification was used to characterize secondary morphological parameters such as the prominence of the bulge, clumpiness, and spiral arms. Galaxies were grouped into the broad classes: ‘pure bulge’, ‘bulge+disk’, and ‘pure disk’. In addition, the galaxies were classified as either ‘clumpy’ or ‘smooth’. We find the following results:
-
1.
Disk selection in clusters: To identify the optical bar fraction , three common methods of disk selection were used and compared: visual classification, color cut, and Sérsic cut. We find 625, 485, and 353 disk galaxies, respectively, via visual classification, a Sérsic cut (), and a blue-cloud cut (Table 2). A color cut misses 51%2% of visually-identified disk galaxies. A Sérsic cut misses 31%2% of visually-identified disk galaxies with . Therefore, a blind application of a color cut or Sérsic cut would miss many of the red galaxies with prominent bulges that are prevalent in a cluster environment.
-
2.
Global optical bar fraction: For moderately inclined galaxies (), we find that the three methods of disk selection (visual, color cut, Sérsic cut), we obtain a similar optical bar fraction of 34%, 31%, and 30%, respectively (Table 2).
-
3.
Optical bar fraction as a function of morphology and luminosity:
We explore as a function of host galaxy properties and find that it rises in spiral galaxies, which are less bulge-dominated and/or are brighter. The optical bar fraction is a factor of 1.8 higher in galaxies classified as ‘pure disk’ compared to galaxies visually classified as ‘bulge+disk’ (Table 4). Within a given bin, is higher in visually-selected disk galaxies that have no bulge as opposed to those with bulges. Furthermore, we find that for a given visual morphological class, rises at higher absolute magnitudes (Fig. 9 and Table 5). When the normalized effective radius is used to trace central galaxy concentration, the bar fraction is 2.7 times higher in galaxies with the lowest central concentration () compared to the galaxies with the highest central concentration (; Fig. 8).
-
4.
Optical bar fraction as a function of , , ICM density, and distance from nearest cluster center: Between the core and the virial radius of the cluster ( 0.25 to 1.2 Mpc) at intermediate densities (log() to 2.3), the optical bar fraction does not appear to depend strongly on the local environment density tracers (, , and ICM density), and varies at most by a factor of 1.3 (Fig. 11. Inside the cluster core, within the caveats of limited number statistics, does not show evidence for a variation larger than a factor of 1.5 as a function of the three environmental indicators. Overall, our results suggest that the optical bar fraction is not strongly dependent on environment at intermediate densities (e.g., log() to 2.3).
-
5.
Comparison to field studies: We compare in Table 8 our results to those for field samples, specifically MJ07 (OSUBSGS) and A09 (SDSS), where bar identification and characterization was done through ellipse-fitting. We find that for bright early Hubble types, as well as faint late-type systems with no evident bulge, the optical bar fraction in the Abell 901/2 clusters is comparable within a factor of 1.2 to that of field galaxies at lower redshifts ().
-
6.
Bar strength distribution in cluster and field: We find that in both the cluster and field, the highest ellipticity bars lie in disk-dominated galaxies.
S.J. and I.M. acknowledge support from the National Aeronautics and Space Administration (NASA) LTSA grant NAG5-13063, NSF grant AST-0607748, and grants G0-10395 from STScI, which is operated by AURA, Inc., for NASA, under NAS5-26555. E. F. B. and K. J. acknowledge support from the Deutsche Forschungsgemeinschaft through the Emmy Noether Programme. A. B. acknowledges support from DLR grant 50 OR 0404. D. H. M. acknowledges support from NASA LTSA grant NAG5-13102 issued through the office of Space Science. E.vK. and M.B. were supported by the Austrian Science Foundation FWF under grand P18416. C. Y. P. is grateful for support provided through STScI and NRC-HIA Fellowship. C. W. acknowledges support from an STFC Advanced Fellowship. Support for STAGES was provided by the NASA through grant G0-10395 from STScI, which is operated by AURA, Inc., for NASA, under NAS5-26555. The STAGES team would like to thank Hans-Walter Rix for his support. This research has made use of NASA’s Astrophysics Data System Service.
References
- Abadi et al. (1999) Abadi, M. G., Moore, B., & Bower, R. G. 1999, MNRAS, 308, 947
- Abazajian et al. (2004) Abazajian, K., et al. 2004, AJ, 128, 502
- Abraham et al. (1996) Abraham, R. G., et al. 1996, ApJ, 471, 694
- Aguerri et al. (2009) Aguerri, J. A. L., Méndez-Abreu, J., & Corsini, E. M. 2009, A&A, 495, 491; A09
- Andersen (1996) Andersen, V. 1996, AJ, 111, 1805
- Athanassoula (1992) Athanassoula, E. 1992, MNRAS, 259, 345
- Athanassoula (2002) Athanassoula, E. 2002, ApJL, 569, L83
- Athanassoula (2003) Athanassoula, E. 2003, MNRAS, 341, 1179
- Athanassoula (2005) Athanassoula, E. 2005, MNRAS, 358, 1477
- Athanassoula et al. (2005) Athanassoula, E., Lambert, J. C., & Dehnen, W. 2005, MNRAS, 363, 496
- Balogh et al. (1998) Balogh, M. L., Schade, D., Morris, S. L., Yee, H. K. C., Carlberg, R. G., & Ellingson, E. 1998, ApJL, 504, L75
- Balogh et al. (1999) Balogh, M. L., Morris, S. L., Yee, H. K. C., Carlberg, R. G., & Ellingson, E. 1999, ApJ, 527, 54
- Balogh et al. (2000) Balogh, M. L., Navarro, J. F., & Morris, S. L. 2000, ApJ, 540, 113
- Barazza et al. (2008) Barazza, F. D., Jogee, S., & Marinova, I. 2008, ApJ, 675, 1194; BJM08
- Barazza et al. (2009) Barazza, F. D., et al. 2009, A&A, 497, 713
- Barden et al. (2005) Barden, M., et al. 2005, ApJ, 635, 959
- Bekki (1999) Bekki, K. 1999, ApJL, 510, L15
- Bell et al. (2003) Bell, E. F., McIntosh, D. H., Katz, N., & Weinberg, M. D. 2003, ApJS, 149, 289
- Bell et al. (2004) Bell, E. F., et al. 2004, ApJL, 600, L11
- Bell et al. (2005) Bell, E. F., et al. 2005, ApJ, 625, 23
- Binggeli et al. (1988) Binggeli, B., Sandage, A., & Tammann, G. A. 1988, ARAA, 26, 509
- Binney & Tremaine (1987) Binney, J., & Tremaine, S. 1987, Princeton, NJ, Princeton University Press, 1987, 747 p.,
- Blanton et al. (2005) Blanton, M. R., Eisenstein, D., Hogg, D. W., Schlegel, D. J., & Brinkmann, J. 2005, ApJ, 629, 143
- Borch et al. (2006) Borch, A., et al. 2006, A&A, 453, 869
- Bravo-Alfaro et al. (2000) Bravo-Alfaro, H., Cayatte, V., van Gorkom, J. H., & Balkowski, C. 2000, AJ, 119, 580
- Bureau & Freeman (1999) Bureau, M., & Freeman, K. C. 1999, AJ, 118, 126
- Bureau & Athanassoula (2005) Bureau, M., & Athanassoula, E. 2005, ApJ, 626, 159
- Buta et al. (2005) Buta, R., Vasylyev, S., Salo, H., & Laurikainen, E. 2005, AJ, 130, 506
- Butcher & Oemler (1978) Butcher, H., & Oemler, A., Jr. 1978, ApJ, 219, 18
- Byrd & Valtonen (1990) Byrd, G., & Valtonen, M. 1990, ApJ, 350, 89
- Cayatte et al. (1990) Cayatte, V., van Gorkom, J. H., Balkowski, C., & Kotanyi, C. 1990, AJ, 100, 604
- Combes et al. (1990) Combes, F., Debbasch, F., Friedli, D., & Pfenniger, D. 1990, A&A, 233, 82
- Combes & Sanders (1981) Combes, F., & Sanders, R. H. 1981, A&A, 96, 164
- Das & Jog (1995) Das, M., & Jog, C. J. 1995, ApJ, 451, 167
- Debattista & Sellwood (1998) Debattista, V. P., & Sellwood, J. A. 1998, ApJL, 493, L5
- Debattista & Sellwood (2000) Debattista, V. P., & Sellwood, J. A. 2000, ApJ, 543, 704
- Debattista et al. (2006) Debattista, V. P., Mayer, L., Carollo, C. M., Moore, B., Wadsley, J., & Quinn, T. 2006, ApJ, 645, 209
- de Vaucouleurs (1963) de Vaucouleurs, G. 1963, ApJS, 8, 31
- deVaucoulers et al. (1991) de Vaucouleurs, G., de Vaucouleurs, A., Corwin Jr., H. G., Buta, R. J., Paturel, G., & Fouque, P. 1991, Third Reference Catalogue of Bright Galaxies (New York: Springer) (RC3)
- Dubinski et al. (2008) Dubinski, J., Gauthier, J.-R., Widrow, L., & Nickerson, S. 2008, ArXiv e-prints, 802, arXiv:0802.3997
- Dressler (1980) Dressler, A. 1980, ApJ, 236, 351
- Elmegreen (1979) Elmegreen, B. G. 1979, ApJ, 231, 372
- Elmegreen et al. (1990) Elmegreen, D. M., Elmegreen, B. G., & Bellin, A. D. 1990, ApJ, 364, 415
- Elmegreen et al. (1991) Elmegreen, D. M., Sundin, M., Sundelius, B., & Elmegreen, B. 1991, A&A, 244, 52
- Elmegreen (1994) Elmegreen, B. G. 1994, ApJL, 425, L73
- Elmegreen et al. (2004) Elmegreen, B. G., Elmegreen, D. M., & Hirst, A. C. 2004, ApJ, 612, 191
- Erwin (2005) Erwin, P. 2005, MNRAS, 364, 283
- Eskridge et al. (2000) Eskridge, P. B., et al. 2000, AJ, 119, 536
- Evrard et al. (1990) Evrard, A. E., Silk, J., & Szalay, A. S. 1990, ApJ, 365, 13
- Farouki & Shapiro (1981) Farouki, R., & Shapiro, S. L. 1981, ApJ, 243, 32
- Fisher (2006) Fisher, D. B. 2006, ApJL, 642, L17
- Friedli et al. (1996) Friedli, D., Wozniak, H., Rieke, M., Martinet, L., & Bratschi, P. 1996, A&A Suppl., 118, 461
- Graham & Worley (2008) Graham, A. W., & Worley, C. C. 2008, MNRAS, 752
- Gray et al. (2002) Gray, M. E., Taylor, A. N., Meisenheimer, K., Dye, S., Wolf, C., & Thommes, E. 2002, ApJ, 568, 141
- Gray et al. (2008) Gray, M. E., et al. 2008, arXiv:0811.3890
- Gunn & Gott (1972) Gunn, J. E., & Gott, J. R. I. 1972, ApJ, 176, 1
- Heiderman, A., et al. (2008) Heiderman, A., Jogee, S., Marinova, I,. et al. 2008, ApJ, submitted
- Heller et al. (2007) Heller, C. H., Shlosman, I., & Athanassoula, E. 2007, ApJL, 657, L65
- Hernquist & Mihos (1995) Hernquist, L., & Mihos, J. C. 1995, ApJ, 448, 41
- Heymans et al. (2008) Heymans, C., et al. 2008, MNRAS, 385, 1431
- Hopkins et al. (2008) Hopkins, P., et al. 2008, arXiv:0901.4111
- Hunt & Malkan (1999) Hunt, L. K., & Malkan, M. A. 1999, ApJ, 516, 660
- Jedrzejewski (1987) Jedrzejewski, R. I. 1987, MNRAS, 226, 747
- Jog & Solomon (1984) Jog, C. J., & Solomon, P. M. 1984, ApJ, 276, 127
- Jogee (1999) Jogee, S. 1999, Ph.D. thesis, Yale University
- Jogee et al. (2002a) Jogee, S., Knapen, J. H., Laine, S., Shlosman, I., Scoville, N. Z., & Englmaier, P. 2002a, ApJL, 570, L55
- Jogee et al. (2002b) Jogee, S., Shlosman, I., Laine, S., Knapen, J. H., Englmaier, P., Scoville, N. Z., & Wilson, C. D. 2002b, ApJ
- Jogee et al. (2004) Jogee, S., Barazza, F., Rix, H.-W., Shlosman, I. et al. 2004a, ApJl, 615, L105
- Jogee et al. (2005) Jogee, S., Scoville, N., & Kenney, J. D. P. 2005, ApJ, 630, 837
- Kassin et al. (2006) Kassin, S. A., de Jong, R. S., & Weiner, B. J. 2006, ApJ, 643, 804
- Kennicutt (1998) Kennicutt, R. C., Jr. 1998, ARAA, 36, 189
- Knapen et al. (2000) Knapen, J. H., Shlosman, I., & Peletier, R. F. 2000, ApJ, 529, 93
- Kodama & Smail (2001) Kodama, T., & Smail, I. 2001, MNRAS, 326, 637
- Koopmann & Kenney (1998) Koopmann, R. A., & Kenney, J. D. P. 1998, ApJL, 497, L75
- Kormendy (1979) Kormendy, J. 1979, ApJ, 227, 714
- Kormendy (1982) Kormendy, J. 1982, ApJ, 257, 75
- Kormendy (1993) Kormendy, J. 1993, Galactic Bulges, 153, 209
- Kormendy & Kennicutt (2004) Kormendy, J., & Kennicutt, R. C., Jr. 2004, ARAA, 42, 603
- Kuijken & Merrifield (1995) Kuijken, K., & Merrifield, M. R. 1995, ApJL, 443, L13
- Lacey & Silk (1991) Lacey, C., & Silk, J. 1991, ApJ, 381, 14
- Laine et al. (1999) Laine, S., Kenney, J. D. P., Yun, M. S., & Gottesman, S. T. 1999, ApJ, 511, 709
- Laine et al. (2002) Laine, S., Shlosman, I., Knapen, J. H., & Peletier, R. F. 2002, ApJ, 567, 97
- Larson et al. (1980) Larson, R. B., Tinsley, B. M., & Caldwell, C. N. 1980, ApJ, 237, 692
- Laurikainen et al. (2004) Laurikainen, E., Salo, H., & Buta, R. 2004, ApJ, 607, 103
- Laurikainen et al. (2004) Laurikainen, E., Salo, H., Buta, R., & Vasylyev, S. 2004, MNRAS, 355, 1251
- Laurikainen et al. (2007) Laurikainen, E., Salo, H., Buta, R., & Knapen, J. H. 2007, MNRAS, 381, 401
- Laurikainen et al. (2009) Laurikainen, E., Salo, H., Buta, R., & Knapen, J. H. 2009, ApJL, 692, L34
- Lütticke et al. (2000) Lütticke, R., Dettmar, R.-J., & Pohlen, M. 2000, A&A Suppl., 145, 405
- Margoniner et al. (2001) Margoniner, V. E., de Carvalho, R. R., Gal, R. R., & Djorgovski, S. G. 2001, ApJL, 548, L143
- Marinova & Jogee (2007) Marinova, I., & Jogee, S. 2007, ApJ, 659, 1176; MJ07
- Martinez-Valpuesta et al. (2006) Martinez-Valpuesta, I., Shlosman, I., & Heller, C. 2006, ApJ, 637, 214
- McIntosh et al. (2005) McIntosh, D. H., et al. 2005, ApJ, 632, 191
- Menéndez-Delmestre et al. (2007) Menéndez-Delmestre, K., Sheth, K., Schinnerer, E., Jarrett, T. H., & Scoville, N. Z. 2007, ApJ, 657, 790
- Mihos et al. (1995) Mihos, J. C., Walker, I. R., Hernquist, L., Mendes de Oliveira, C., & Bolte, M. 1995, ApJL, 447, L87
- Moore et al. (1996) Moore, B., Katz, N., Lake, G., Dressler, A., & Oemler, A. 1996, Nature, 379, 613
- Moore et al. (1998) Moore, B., Lake, G., & Katz, N. 1998, ApJ, 495, 139
- Mulchaey & Regan (1997) Mulchaey, J. S., & Regan, M. W. 1997, ApJL, 482, L135
- Noguchi (1987) Noguchi, M. 1987, MNRAS, 228, 635
- Norman et al. (1996) Norman, C. A., Sellwood, J. A., & Hasan, H. 1996, ApJ, 462, 114
- Odewahn (1996) Odewahn, S. C. 1996, ASP Conf. Ser. 91: IAU Colloq. 157: Barred Galaxies, 91, 30
- Oemler (1974) Oemler, A. J. 1974, ApJ, 194, 1
- Ostriker & Peebles (1973) Ostriker, J. P., & Peebles, P. J. E. 1973, ApJ, 186, 467
- Persic et al. (1996) Persic, M., Salucci, P., & Stel, F. 1996, MNRAS, 281, 27
- Pfenniger & Norman (1990) Pfenniger, D., & Norman, C. 1990, ApJ, 363, 391
- Quilis et al. (2000) Quilis, V., Moore, B., & Bower, R. 2000, Science, 288, 1617
- Quillen et al. (1995) Quillen, A. C., Frogel, J. A., Kenney, J. D. P., Pogge, R. W., & Depoy, D. L. 1995, ApJ, 441, 549
- Quinn et al. (1993) Quinn, P. J., Hernquist, L., & Fullagar, D. P. 1993, ApJ, 403, 74
- Ravindranath et al. (2004) Ravindranath, S., et al. 2004, ApJL, 604, L9
- Reese et al. (2007) Reese, A. S., Williams, T. B., Sellwood, J. A., Barnes, E. I., & Powell, B. A. 2007, AJ, 133, 2846
- Regan et al. (1997) Regan, M. W., Vogel, S. N., & Teuben, P. J. 1997, ApJ, 482, L143
- Romano-Díaz et al. (2008) Romano-Díaz, E., Shlosman, I., Heller, C., & Hoffman, Y. 2008, ApJL, 687, L13
- Sakamoto et al. (1999) Sakamoto, K., Okumura, S. K., Ishizuki, S., & Scoville, N. Z. 1999, ApJ, 525, 691
- Schneider (2006) Schneider, P. 2006, Extragalactic Astronomy and Cosmology, by Peter Schneider. Berlin: Springer, 2006.,
- Schwarz (1981) Schwarz, M. P. 1981, ApJ, 247, 77
- Sellwood (1993) Sellwood, J. A. 1993, Galactic Bulges, 153, 391
- Sellwood & Wilkinson (1993) Sellwood, J. A., & Wilkinson, A. 1993, Reports of Progress in Physics, 56, 173
- Sérsic & Pastoriza (1967) Sérsic, J. L., & Pastoriza, M. 1967, PASP, 79, 152
- Shen & Sellwood (2004) Shen, J., & Sellwood, J. A. 2004, ApJ, 604, 614
- Sheth et al. (2003) Sheth, K., Regan, M. W., Scoville, N. Z., & Strubbe, L. E. 2003, ApJL, 592, L13
- Sheth et al. (2005) Sheth, K., Vogel, S. N., Regan, M. W., Thornley, M. D., & Teuben, P. J. 2005, ApJ, 632, 217
- Sheth et al. (2008) Sheth, K., et al. 2008, ApJ, 675, 1141
- Shlosman et al. (1989) Shlosman, I., Frank, J., & Begelman, M. C. 1989, Nature, 338, 45
- Shlosman & Noguchi (1993) Shlosman, I., & Noguchi, M. 1993, ApJ, 414, 474
- Thompson (1981) Thompson, L. A. 1981, ApJL, 244, L43
- Toomre (1964) Toomre, A. 1964, ApJ, 139, 1217
- Toomre (1981) Toomre, A. 1981, Structure and Evolution of Normal Galaxies, 111
- Treu et al. (2003) Treu, T., Ellis, R. S., Kneib, J.-P., Dressler, A., Smail, I., Czoske, O., Oemler, A., & Natarajan, P. 2003, ApJ, 591, 53
- van den Bergh (2002) van den Bergh, S. 2002, AJ, 124, 782
- van den Bergh (2007) van den Bergh, S. 2007, AJ, 134, 1508
- van den Bosch et al. (2008) van den Bosch, F. C., Aquino, D., Yang, X., Mo, H. J., Pasquali, A., McIntosh, D. H., Weinmann, S. M., & Kang, X. 2008, MNRAS, 387, 79
- van Kampen & Katgert (1997) van Kampen, E., & Katgert, P. 1997, MNRAS, 289, 327
- Varela et al. (2004) Varela, J., Moles, M., Márquez, I., Galletta, G., Masegosa, J., & Bettoni, D. 2004, A&A, 420, 873
- Vollmer et al. (2005) Vollmer, B., Braine, J., Combes, F., & Sofue, Y. 2005, A&A, 441, 473
- Weinberg (1985) Weinberg, M. D. 1985, MNRAS, 213, 451
- Weinzirl et al. (2009) Weinzirl, T., Jogee, S., Khochfar, S., Burkert, A., & Kormendy, J. 2008, ArXiv e-prints, 807, arXiv:0807.0040, in press
- White et al. (2005) White, S. D. M., et al. 2005, A&A, 444, 365
- Wolf et al. (2004) Wolf, C., et al. 2004, A&A, 421, 913
- Wolf et al. (2005) Wolf, C., Gray, M. E., & Meisenheimer, K. 2005, A&A, 443, 435
- Wolf et al. (2008) , MNRASaccepted
- Wozniak et al. (1995) Wozniak, H., Friedli, D., Martinet, L., Martin, P., & Bratschi, P. 1995, A&A Suppl., 111, 115
- Zabludoff & Franx (1993) Zabludoff, A. I., & Franx, M. 1993, AJ, 106, 1314
- Zheng et al. (2005) Zheng, X. Z., Hammer, F., Flores, H., Assémat, F., & Rawat, A. 2005, A&A, 435, 507
| Whole cluster sample | Core | Outer region | Outskirt | |
|---|---|---|---|---|
| R Rcore | R R Rvirial | R Rvirial | ||
| (1) | (2) | (3) | (4) | |
| Nall | 750 | 81 | 556 | 113 |
| Nbulge | 125 | 26 | 88 | 11 |
| Ndisk | 625 | 55 | 468 | 102 |
| Ndisk (bulge+disk) | 452 | 46 | 334 | 72 |
| Ndisk (pure disk) | 173 | 9 | 134 | 30 |
| Nbulge/Nall | 0.17 | 0.32 | 0.16 | 0.10 |
| Ndisk/Nall | 0.83 | 0.68 | 0.84 | 0.90 |
| Nbulge+disk/Nall | 0.60 | 0.57 | 0.60 | 0.64 |
| N/Nall | 0.23 | 0.11 | 0.24 | 0.27 |
Note. — The numbers shown are for the 750 bright () galaxies, which we were able to classify into three broad groups: ‘pure bulge’, ‘bulge+disk’, and ‘pure disk’, as outlined in 3.3. The relative numbers in each group are shown for the whole cluster (column 1) and different regions within the custer (columns 2, 3, and 4). The core radius R Mpc and the virial radius R Mpc.
| Method | Ndisk | Nbarred | fbar,opt |
|---|---|---|---|
| (1) | (2) | (3) | (4) |
| Visual | 340 | 115 | 34% |
| Color | 189 | 58 | 31% |
| Sérsic | 241 | 72 | 30% |
Note. — All optical bar fractions are for galaxies with , , and kpc. Columns are: (1) Method for selecting disk galaxies. See 3.1 and 4.1 for details; (2) Number of moderately inclined disk galaxies, Ndisk; (3) Number of barred disk galaxies, Nbarred. Bars are detected through ellipse fitting; (4) Optical bar fraction, , defined as in Eq. 1. The upper error bar on the optical bar fraction is the sum in quadrature of the error in the bar fraction from isophotal twists ( 3.2) and the statistical error. Note that including isophotal twists into the optical bar fraction can only make the optical bar fraction higher. Therefore, the lower error bars quoted represent only the statistical error.
| Method | Ndisk | Nbar | fbar,opt |
|---|---|---|---|
| (1) | (2) | (3) | (4) |
| Visual | 389 | 128 | 33% |
| Color | 208 | 69 | 33% |
| Sérsic | 290 | 85 | 29% |
Note. — All optical bar fractions are for galaxies with M∗/M, , and kpc. Columns are: (1) Method for selecting disk galaxies. See 3.1 and 4.1 for details; (2) Number of moderately inclined disk galaxies, Ndisk; (3) Number of barred disk galaxies, Nbarred. Bars are detected through ellipse fitting; (4) Optical bar fraction, , defined as in Eq. 1. The upper error bar on the optical bar fraction is the sum in quadrature of the error in the bar fraction from isophotal twists ( 3.2) and the statistical error. Note that including isophotal twists into the optical bar fraction can only make the optical bar fraction higher. Therefore, the lower error bars quoted represent only the statistical error.
| Morphology | Nall | Ndisk | Nbar | fbar,opt |
|---|---|---|---|---|
| (1) | (2) | (3) | (4) | (5) |
| Pure bulge | 105 | — | — | — |
| B+D | 110a+131b+21c | 262 | 77 | 29% |
| Pure disk | 78 | 78 | 38 | 49% |
| Clumpy | 105 | 105 | 47 | 45% |
| Smooth | 340 | 235 | 68 | 29% |
Note. — All values are for galaxies with , , and kpc. Columns are : (1) Morphological parameters from visual classification ( - number of ‘bulge+disk’ galaxies with bar/spiral arm; - number of ‘bulge+disk’ galaxies without bar/spiral; - number of bulge+disk galaxies without bar and no spiral arm class); (2) Total number of galaxies in class; (3) Number of moderately inclined disk galaxies in class; (4) Number of barred disk galaxies, where bars are from ellipse fitting; (5) Optical bar fraction calculated as in Eq. 1. The upper error bar on the optical bar fraction is the sum in quadrature of the error in the bar fraction from isophotal twists ( 3.2) and the statistical error. Note that including isophotal twists into the optical bar fraction can only make the optical bar fraction higher. Therefore, the lower error bars quoted represent only the statistical error.
| range | Bulge+Disk Smooth | Bulge+Disk Clumpy | Pure Disk Smooth | Pure Disk Clumpy |
|---|---|---|---|---|
| 10% (6/58) | 40% (2/5) | 46% (11/24) | 29% (5/17) | |
| 20% (14/71) | 18% (3/17) | 57% (4/7) | 60% (12/20) | |
| 42% (22/53) | 35% (7/20) | — | 63% (5/8) | |
| 53% (10/19) | 75% (12/16) | — | — |
Note. — We show the variation of as a function of absolute magnitude and morphological class for visually-identified, moderately inclined disk galaxies with kpc. The numbers in parentheses give the values in each bin. Values are only shown for bins containing more than two galaxies. The error presented is the statistical error in each bin.
| 31% (20/65) | 34% (17/50) | 36% (8/22) | 20% (1/5) | |
| 10% (4/39) | 25% (16/65) | 44% (26/59) | 69% (22/32) |
Note. — We show the variation of as a function of rest-frame color and absolute magnitude for visually-identified, moderately inclined disk galaxies with kpc. The numbers in parentheses give the values in each bin. Values are only shown for bins containing more than two galaxies. The error presented is the statistical error in each bin.
| Bulge+Disk Smooth | Bulge+Disk Clumpy | Pure Disk Smooth | Pure Disk Clumpy | |
|---|---|---|---|---|
| 6% (2/33) | 21% (8/38) | 52% (14/27) | 49% (22/45) | |
| 30% (51/170) | 76% (16/21) | 20% (1/5) | — |
Note. — We show the variation of as a function of rest-frame color and morphological class for visually-identified, moderately inclined disk galaxies with kpc. The numbers in parentheses give the values in each bin. Values are only shown for bins containing more than two galaxies. The error presented is the statistical error in each bin.
| A) Bright galaxies split into morphological types | ||
|---|---|---|
| Reference | MJ07 | this work |
| Magnitude range | ||
| Environment | OSUBSGS (mostly field) | Abell 901/902 (cluster) |
| Redshift | 0 | 0.165 |
| All types2: 40% (36/90) | All types: 48% (58/121) | |
| S0-Sbc2: 41% (31/71) | B+D: 47% (52/111) | |
| B) Bright galaxies split into morphological types | ||
| Reference | A09 | this work |
| Magnitude range | ||
| Environment | SDSS (field + interm. density) | Abell 901/902 (cluster) |
| Redshift | 0.01-0.04 | 0.165 |
| All types: 48% (337/699) | All types3: 57% (41/72) | |
| S0 to Sbc: 41% (196/474) | B+D 3: 56% (39/68) | |
| C) Faint galaxies split into morphological types | ||
| Reference | A09 | this work |
| Magnitude range | ||
| Environment | SDSS (field + interm. density) | Abell 901/902 (cluster) |
| Redshift | 0.01-0.04 | 0.165 |
| All types: 43% (589/1360) | All types: 32% (65/205) | |
| S0 to Sbc: 39% (349/893) | B+D: 23% (37/159) | |
| Scd-Sd: 51% (240/467) | pure disk: 61% (28/46) | |
Note. — (1): The fractions quoted for this study are for galaxies with and kpc. (2): The upper error bar on the optical bar fraction quoted for this study and MJ07 is the sum in quadrature of the error in the bar fraction from isophotal twists ( 3.2) and the statistical error. Note that including isophotal twists into the optical bar fraction can only make the optical bar fraction higher. Therefore, the lower error bars quoted represent only the statistical error.
(3): The OSUBSGS sample of moderately inclined galaxies in MJ07 is dominated by early-to-intermediate Hubble types (S0-Sbc; 71) galaxies mostly S0/a to Sbc. The number of late Hubble type (Sc-Sm; 18) galaxies is too low to yield robust number statistics for the late types. We thus only show for the early-to-intermediate Hubble types.
(4): In the STAGES sample, there are only 5 pure disk galaxies with magnitudes , while most pure disk galaxies have (see Table 5). For this reason, we only show the bright-galaxy comparison for early-type (B+D) galaxies.