Magnetic circular dichroism in GaMnAs: (no) evidence for an impurity band
Abstract
Magneto-optical properties of the ferromagnetic semiconductor GaMnAs are studied in a material specific multi-band tight-binding approach. Two realistic models are compared: one has no impurity band while the other shows an impurity band for low Mn concentrations. The calculated magnetic circular dichroism (MCD) is positive for both models proving that, unlike previously asserted, the observed positive MCD signal is inconclusive as to the presence or absence of an impurity band in GaMnAs. The positive MCD is due to the antiferromagnetic p-d coupling and the transitions into the conduction band.
pacs:
75.50.Pp, 71.55.Eq, 78.20.Ls, 75.50.DdThe ferromagnetic semiconductor GaMnAs Ohno (1998); Jungwirth et al. (2006); Dietl (2008a) is a fascinating material not only because of its importance for technological applications Fabian et al. (2007), but also because its understanding poses great challenge. Indeed, understanding the electronic structure of GaMnAs requires resolving complexities due to disorder, correlations, and magnetism. Over the past years, an intense debate has sparked about the nature of the carrier states (holes) Jungwirth et al. (2007): Do the relevant states reside in a GaAs-like valence band or in an Mn-induced impurity band? While the leading mean-field picture Jungwirth et al. (2006) of GaMnAs relies on the valence-band scenario, also supported by transport experiments Elsen et al. (2008); Neumaier et al. (2009), recent optical experiments appear to imply the existence of an impurity band Burch et al. (2008).
Ferromagnetism in GaMnAs is mediated by free holes induced by Mn impurities Dietl et al. (2000); Das Sarma et al (2003). Experimentally, magneto-optical studies of GaMnAs Burch et al. (2008); Szczytko et al. (1996); Beschoten et al. (1999); Chakarvorty et al. (2007); Szczytko et al. (1999); Ando et al. (2008) gave important insights into the exchange mechanism between the holes and the local Mn moments Burch et al. (2008). In particular, magnetic circular dichroism (MCD), which is the relative absorption strength for the left and right circularly polarized light, can give the signs and magnitudes of the exchange coupling constants Oppeneer (2000); Ando (2000). It is now generally believed that the coupling between holes and the local moments (p-d coupling) is antiferromagnetic.
The observed MCD signal around the fundamental absorption edge, , is positive, which seems to imply a ferromagnetic p-d coupling, in contrast to what is known about II-Mn-VI diluted magnetic semiconductors Szczytko et al. (1996); Lang et al. (2005), as well as about GaMnAs at very low doping levels, at which the material is paramagnetic Schneider et al. (1987). Keeping the coupling antiferromagnetic, the natural explanation, within the valence-band picture, appeared to be a shift of the Fermi energy due to the Mn doping—Mn acts as an acceptor—in the ferromagnetic regime. This so called Moss-Burstein shift would then reverse the order in which the two circular polarizations of light are absorbed Szczytko et al. (1999, 2001); Dietl et al. (2001).
On the other hand, recent MCD experiments have been interpreted to imply the existence of an impurity band Ando et al. (2008), invalidating the Moss-Burstein shift picture. Such a view appears consistent with the calculations of Ref. Lang et al., 2005, which concluded that the positive MCD would arise in the valence-band scenario only if the p-d coupling were ferromagnetic (this argument counters the results of Ref. Hankiewicz et al. (2004) which finds instead a positive MCD in the valence-band model with Mn disorder in the Born approximation). Also, recent tight-binding calculations for an embedded single Mn impurity in a GaAs matrix Tang and Flatté (2008) point to the existence of an impurity band. The apparent picture coming from experiments Ando et al. (1998); Chakarvorty et al. (2007); Ando et al. (2008); Burch et al. (2008) is that of a dominant and spectrally broad positive MCD signal from the transitions to an impurity band.
Here we argue that the positive MCD signal has little to do with the presence or absence of an impurity band in GaMnAs. The signal results from the spin-resolved electronic level ordering in GaMnAs which is present despite the strong disorder. The Fermi level shift due to doping by Mn acceptors is strong enough to make the MCD signal positive, regardless whether or not the Fermi level lies in the valence band (Moss-Burstein shift) or in the impurity band, while holding to the antiferromagnetic p-d coupling in both cases. The dominant transitions are those involving the conduction band, not the impurity one. We thus find most previous conclusions drawn from the positive MCD signal unfounded. Our argument is based on large-scale tight-binding calculations of MCD in disordered GaMnAs using two models. One model reproduces the valence-band picture, the other shows an impurity band. Both have antiferromagnetic p-d coupling, and both show a positive MCD around the fundamental absorption edge, in agreement with experiment.
Our simulations use a material-specific microscopic tight-binding approach. The models are based on 16 valence and conduction bands of GaAs which are approximated throughout the entire Brillouin zone to fit the experimentally determined band structure Chadi (1977); Talwar and Ting (1982). We use two different parameter sets for the inclusion of Mn impurities into the models. One of the models Mašek et al. (2007) is characterized by an only slightly changed host valence band and a shift of the Fermi energy according to the number of holes that are added with the Mn. The other model Tang and Flatté (2004) shows a strong shift of the host valence-band states into the gap leading to the formation of an impurity band which starts to merge with the valence band at Mn concentrations around Turek et al. (2008). We present results on the absorption of left and right circularly polarized light for ferromagnetic bulk at zero temperature and various Mn concentrations. Within this framework we can treat the disorder effects non-perturbatively. While this approximation seems justified for large concentrations of Mn impurities Jungwirth et al. (2007), , an explicit inclusion of the carrier-carrier interactions (computationally infeasible) may give quantitative corrections of our findings Dietl (2008b).
As already stated, we investigate two different sets of tight-binding parameterizations to study in detail how an impurity band affects the MCD results. These two models were thoroughly analyzed in Ref. Turek et al. (2008) concerning the density of states, the size of the band gap, the position of the Fermi energy, localization properties of holes, optical effective masses, and mean free paths. The first model, which we call model A, was suggested by Mašek Mašek et al. (2007). This model, derived from a first-principles approach, describes GaMnAs qualitatively very similar to what is expected from a p-doped GaAs Turek et al. (2008). Its main characteristic is the inclusion of additional holes and therefore a corresponding shift of the Fermi energy into the host valence band. There is no formation of an impurity band within this model.
The second model, which we call model B, was suggested by Tang and Flatté Tang and Flatté (2004). Within this model the Mn impurities are described by a modified on-site potential and a spin-dependent potential at the four nearest As neighbors. The two relevant parameters are adjusted such that the experimental binding energy of of the Mn impurity is recovered. Qualitatively, this model not only shifts the Fermi energy due to the additional holes but it also affects the positions of the energy levels of the host material rather strongly Turek et al. (2008). Applying this model to disordered systems with many Mn impurities leads to the formation of an isolated impurity band for Mn concentrations . At higher concentrations the impurity band starts to merge with the host valence band. Hence, the comparison of these two different parameterizations, models A and B, allows us to draw conclusions on how the existence of an impurity band influences the MCD signals that are seen in the experiments.
We analyze the MCD signal by evaluating the diagonal and off-diagonal elements of the optical absorption matrix. The matrix elements can be written in terms of the eigenstates and eigenenergies as Czycholl (2004)
| (1) |
with the system volume , the Fermi function , energy difference , and momentum matrix elements . The absorption for right (left) polarized light can be obtained by replacing in Eq. (1). The MCD signal, for a constant index of refraction (or poor conductors), is
| (2) |
In order to numerically evaluate the conductivity (1) we calculate the eigenenergies and the matrix elements of the momentum operator using a multi-band tight-binding approach Turek et al. (2008). This approach is applied to periodically repeated finite size super-cells containing up to 2000 atoms. The resulting conductivity is furthermore averaged over several disorder configurations. Therefore, our approach goes beyond the single impurity calculation presented on model B in Ref. Tang and Flatté (2008) as we explicitly include disorder averaging effects. In our calculations, for numerical reasons, we use a smearing temperature corresponding to meV in the Fermi functions and a peak width . The integration over the super-lattice Brillouin zone is performed by summation over up to 2048 different vectors Turek et al. (2008). As the systems under consideration are disordered one cannot restrict this summation to the irreducible part of the Brillouin zone. Furthermore, the finiteness of the systems limits the Mn concentrations to in our present simulations.
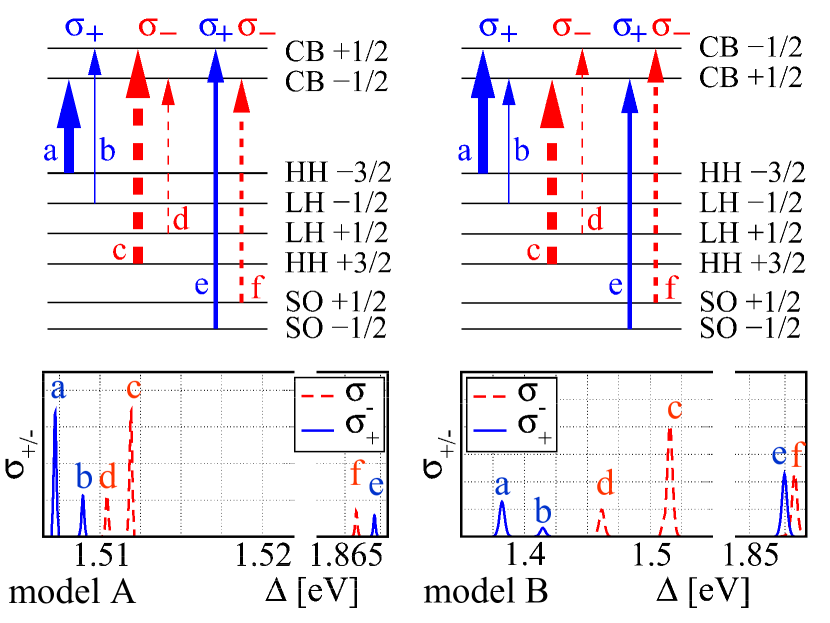
For a better understanding of the numerical MCD results we first analyze the effect of a single Mn impurity in a super-cell of 2000 atoms with periodic boundary conditions. The absorption was evaluated at the point, i.e. in the super-lattice Brillouin zone. Due to the magnetic moment of the Mn impurity the spin degeneracies of the conduction s- and the valence p-bands are lifted. The order in which the levels appear can be concluded from the absorption peaks of at . We show the numerical results in Fig. 1. The Fermi energy was chosen to be (artificially) above the highest impurity level, to show all relevant optical transitions. The absorption peaks then correspond to the six possible transitions between the six heavy hole, light hole, and spin orbit split-off bands to the two conduction bands Ando (2000). Other transitions are suppressed because of the selection rules for the momentum matrix elements. Among the allowed transitions, ‘a’ and ‘c’ are the strongest ones due to their larger momentum matrix elements. From the position of each and peak one can uniquely identify the involved bands. The extracted ordering of the levels is shown schematically in the upper panel of Fig. 1.
As a Mn impurity also acts as an acceptor, the highest impurity level, that is the levels labeled ‘HH -3/2’ in Fig. 1, is in fact unoccupied. This means that the actual Fermi energy lies just below this highest impurity level. Therefore, all transitions starting from this level are suppressed. For the absorption this means that the peak labeled ‘a’ is not observable at zero temperature.
Figure 1 points to common features and differences between the two models. The order of the first four peaks, ‘a’ through ‘d’, is the same for both models implying the same ordering of the valence band states. The spin of the Mn core 3d electrons in our simulation points into the direction, that is, anti-parallel to the propagation direction of the light. This leads to an acceptor state with spin-down character implying antiferromagnetic p-d exchange coupling for the holes, for both models.
Besides this common feature there are two major differences between model A and model B. First, the magnitude of the level splitting due to the magnetic impurity is very different. For example, model A results in a splitting of the four heavy and light hole bands of while in model B this splitting is . This difference in the splittings is associated with the fact that model B explicitly reproduces the bound state energies of a single Mn impurity at in the host gap by a strong deformation of the host valence band Tang and Flatté (2004). The second major difference between the two models is the different order of the two conduction bands. In model A the spin-up band has a higher energy while in model B it is the spin-down band. Hence we find that model A is based on a ferromagnetic s-d coupling, consistent with the prevalent view, while model B produces antiferromagnetic s-d coupling. Concerning the absorption data this is reflected in the fact that at energies for model A the peak comes first while for model B it is the peak. This specific in the ordering of the conduction band does not alter the calculated MCD signal qualitatively.
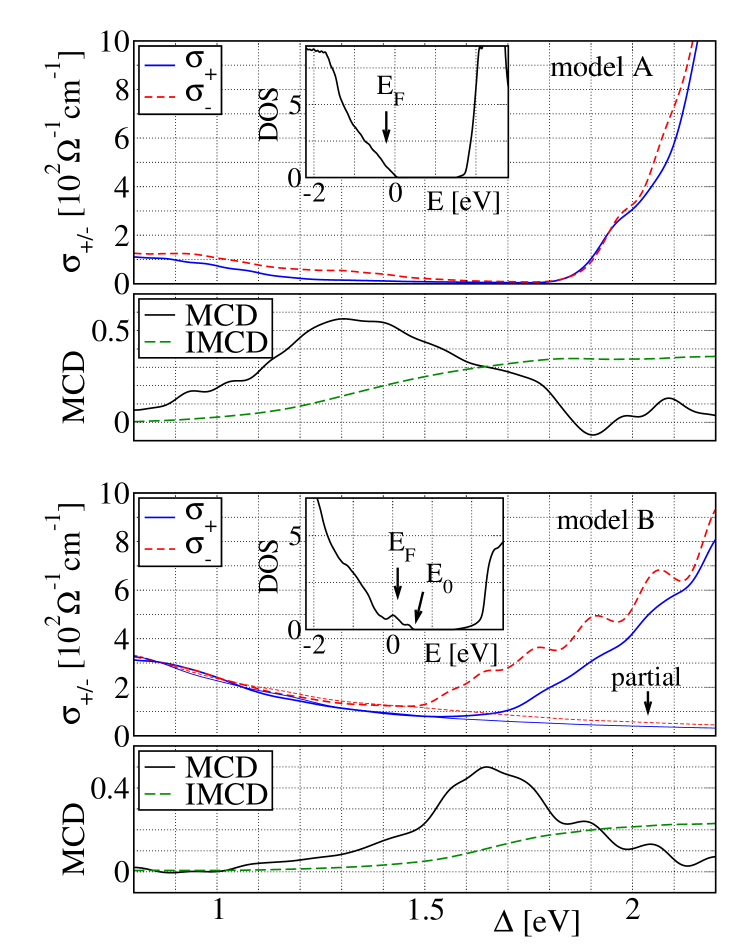
How are the above effects of a single Mn impurity reflected in the absorption of the left and right circularly polarized light in strongly disordered samples with many impurities? The simulation results for a Mn concentration are shown in Fig. 2. For this Mn concentration model B still shows an impurity band, which is attached to the host valence band, while model A does not exhibit an impurity band at all as can be seen in the insets of Fig. 2. The Fermi energy in model A lies within the host valence band whereas for model B it lies within the impurity band. For both models we find that the absorption sets in at lower energies implying a positive MCD signal. This is understandable as the strong transitions at low are suppressed as the highest valence and impurity band states with spin down character are not occupied. Comparing with recent experiments we find very good qualitative agreement for the MCD and IMCD signals Beschoten et al. (1999); Chakarvorty et al. (2007). A precise quantitative agreement cannot be expected from a tight-binding model Harrison (2004).
To test the hypothesis put forward in Ando et al. (2008), that the positive MCD is due to the transitions to the impurity band, we have calculated the partial conductivities by excluding the conduction band states in Eq. 1 for model B; see Fig. 2. These conductivities (and their differences) are much smaller than the complete ones, giving no support to the hypothesis. Instead, the positive MCD around the absorption edge is due to the transitions to the conduction band.
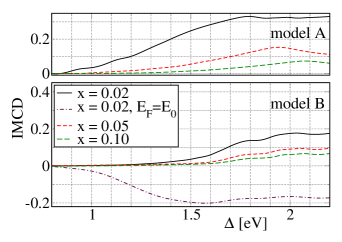
As in Ref. Chakarvorty et al., 2007, we show the IMCD signal for various Mn concentrations in Fig. 3. With increasing Mn concentration the magnitude of the IMCD signal is decreasing as the total absorption becomes stronger. However, the shape of the signal is rather robust for all investigated Mn concentrations. In particular, we do not observe a change in the sign of the MCD signal within the considered range of concentrations from 2 % to 10 %.
What would the MCD signal be for a fully compensated GaMnAs? It is particularly interesting to see what the MCD were if the Fermi level were at the top of the impurity band in model B, as this reflects the ordering of the impurity band levels and the deformation of the ordering due to disorder. Our results are shown in Fig. 3 for % (). The MCD is negative as the transitions are now allowed, dominating the signal in accord with the single-impurity picture in Fig. 1.
In summary, we find that the positive MCD signal in GaMnAs (a) is inconclusive as to the presence or absence of an impurity band, (b) implies antiferromagnetic p-d coupling also for the valence-band scenario, and (c) originates from the transitions to the conduction band.
We thank D. Weiss and C. Back for helpful discussions. This work was supported by the DFG SFB 689.
References
- Ohno (1998) H. Ohno, Science 281, 951 (1998).
- Jungwirth et al. (2006) T. Jungwirth, J. Sinova, J. Mašek, J. Kucera, and A. H. MacDonald, Rev. Mod. Phys. 78, 809 (2006).
- Dietl (2008a) T. Dietl, J. Appl. Phys. 103, 07D111 (2008a).
- Fabian et al. (2007) J. Fabian, A. Matos-Abiague, C. Ertler, P. Stano, and I. Žutic̀, Acta Phys. Slovaca 57, 565 (2007).
- Jungwirth et al. (2007) T. Jungwirth, J. Sinova, A. H. MacDonald, B. L. Gallagher, V. Novak, K. W. Edmonds, A. W. Rushforth, R. P. Campion, C. T. Foxon, L. Eaves, et al., Phys. Rev. B 76, 125206 (2007).
- Elsen et al. (2008) M. Elsen, H. Jaffr s, R. Mattana, M. Tran, J.-M. George, A. Miard, and A. Lema tre, Phys. Rev. Lett. 99, 127203 (2007).
- Neumaier et al. (2009) D. Neumaier, M. Turek, U. Wurstbauer, A. Vogl, M. Utz, W. Wegscheider, and D. Weiss, Phys. Rev. Lett. 103, 087203 (2009).
- Burch et al. (2008) K. S. Burch, D. D. Awschalom, and D. N. Basov, J. Magn. Magn. Mater. 320, 3207 (2008).
- Dietl et al. (2000) T. Dietl, H. Ohno, F. Matsukura, J. Cibert, and D. Ferrand, Science 287, 1019 (2000).
- Das Sarma et al (2003) S. D. Das Sarma, E. H. Hwang, E. H. Hwang, and Phys. Rev. B 67, 155201 (2003).
- Szczytko et al. (1996) J. Szczytko, W. Mac, A. Stachow, A. Twardowski, P. Becla, and J. Tworzydklo, Solid State Commun. 99, 927 (1996).
- Beschoten et al. (1999) B. Beschoten, P. Crowell, I. Malajovich, D. Awschalom, F. Matsukura, A. Shen, and H. Ohno, Phys. Rev. Lett. 83, 3073 (1999).
- Chakarvorty et al. (2007) R. Chakarvorty, S. Shen, K. J. Yee, T. Wojtowicz, R. Jakiela, A. Barcz, X. Liu, J. K. Furdyna, and M. Dobrowolska, Appl. Phys. Lett. 91 171118 (2007).
- Szczytko et al. (1999) J. Szczytko, W. Mac, A. Twardowski, F. Matsukura, and H. Ohno, Phys. Rev. B 59, 12935 (1999).
- Ando et al. (2008) K. Ando, H. Saito, K. C. Agarwal, M. C. Debnath, and V. Zayets, Phys. Rev. Lett. 100, 067204 (2008).
- Oppeneer (2000) P. Oppeneer, Handbook of Magnetic Materials 13, 229 (2000).
- Ando (2000) K. Ando, Magneto-Optics (Springer-Verlag, 2000), p. 211.
- Lang et al. (2005) R. Lang, A. Winter, H. Pascher, H. Krenn, X. Liu, and J. K. Furdyna, Phys. Rev. B 72, 024430 (2005).
- Schneider et al. (1987) J. Schneider, U. Kaufmann, W. Wilkening, M. Baeumler, and F. Köhl, Phys. Rev. Lett. 59, 240 (1987).
- Szczytko et al. (2001) J. Szczytko, W. Bardyszewski, and A. Twardowski, Phys. Rev. B 64, 075306 (2001).
- Dietl et al. (2001) T. Dietl, H. Ohno, and F. Matsukura, Phys. Rev. B 63, 195205 (2001).
- Hankiewicz et al. (2004) E. M. Hankiewicz, T. Jungwirth, T. Dietl, C. Timm, and J. Sinova, Phys. Rev. B 70, 245211 (2004).
- Tang and Flatté (2008) J.-M. Tang and M. E. Flatté, Phys. Rev. Lett. 101, 157203 (2008).
- Ando et al. (1998) K. Ando, T. Hayashi, M. Tanaka, and A. Twardowski, The 7th joint MMM-intermag conference on magnetism and magnetic materials 83, 6548 (1998).
- Chadi (1977) D. J. Chadi, Phys. Rev. B 16, 790 (1977).
- Talwar and Ting (1982) D. N. Talwar and C. S. Ting, Phys. Rev. B 25, 2660 (1982).
- Mašek et al. (2007) J. Mašek, J. Kudrnovský, F. Máca, J. Sinova, A. H. MacDonald, R. P. Campion, B. L. Gallagher, and T. Jungwirth, Phys. Rev. B 75, 045202 (2007).
- Tang and Flatté (2004) J.-M. Tang and M. E. Flatté, Phys. Rev. Lett. 92, 047201 (2004).
- Turek et al. (2008) M. Turek, J. Siewert, and J. Fabian, Phys. Rev. B 78, 085211 (2008).
- Dietl (2008b) T. Dietl, J. Phys. Soc. Jpn. 77, 031005 (2008b).
- Czycholl (2004) G. Czycholl, Theoretische Festkörperphysik (Springer-Verlag Berlin Heidelberg, 2004).
- Harrison (2004) W. A. Harrison, Elementary Electronic Structure (World Scientific, Singapore, 2004).