EuFe2As2 under High Pressure: an Antiferromagnetic Bulk Superconductor
Abstract
We report the ac magnetic susceptibility and resistivity measurements of EuFe2As2 under high pressure . By observing nearly 100% superconducting shielding and zero resistivity at = 28 kbar, we establish that -induced superconductivity occurs at 30 K in EuFe2As2. shows an anomalous nearly linear temperature dependence from room temperature down to at the same . indicates that an antiferromagnetic order of Eu2+ moments with 20 K persists in the superconducting phase. The temperature dependence of the upper critical field is also determined.
The discovery of superconductivity (SC) at a transition temperature = 26 K in LaFeAsO1-xFxby Kamihara et al.[1] has triggered extensive studies of SC in layered iron pnictides and related compounds. Rotter et al. found that BaFe2As2 with a simpler structure can be made superconducting by doping: = 38 K in (Ba1-xKx)Fe2As2 with = 0.4.[2] Perhaps more importantly, it is reported that 122 compounds of the form Fe2As2 ( = Ca, Sr, Ba, and Eu) can be tuned to SC by the application of high pressure .[3, 4, 5, 6, 7, 8, 9, 10] tuning can provide opportunities to determine the nature of the iron-pnictide high-temperature SC without being adversely affected by disorder due to doping. However, most of these reports are based only on resistivity measurements and hence cannot establish the bulk nature of -induced SC.[11] Even when magnetic measurements are reported, results are not conclusive: In ref. \citenAlireza09JPCM, magnetic measurements were performed on SrFe2As2 and BaFe2As2, but the observed volume fraction was expressed in arbitrary units. In ref. \citenLee08condmat, the volume fraction of the -induced superconducting phase of CaFe2As2 was estimated to be at least 50%, while in ref. \citenYu08condmat CaFe2As2 was reported not to exhibit SC under hydrostatic produced by the use of helium as a pressure-transmitting medium.
EuFe2As2 exhibits two phase transitions, at 190 K and 19 K, at ambient .[13, 14, 15, 16] The transition at is a combined structural and magnetic transition, similar to those in the other 122 compounds: the crystal structure changes from tetragonal to orthorhombic and the Fe2+ moments order antiferromagnetically. The transition at is due to the antiferromagnetic (AFM) ordering of the Eu2+ moments. The AFM coupling of the Eu2+ moments is rather weak: the field-induced paramagnetic state with a saturated moment of 7 /Eu is easily reached by the application of 1 or 2 T in the -plane or along the -axis, respectively.[17] A temperature ()- phase diagram has been determined from measurements:[10] while decreases with and is not detected above = 23 kbar, is nearly -independent up to 26 kbar (the highest in ref. \citenMiclea08condmat). The authors of ref. \citenMiclea08condmat state that -induced SC at 30 K occurs above 20 kbar. However, their data (at = 21.6 kbar) shows only a partial drop and approximately half of the normal-state appears to remain as . Obviously, further experimental confirmation is necessary.
In this letter, we report measurements of the ac magnetic susceptibility and of EuFe2As2 single crystals under high . By observing a nearly 100% shielding volume fraction and a sharp resistive transition to the zero-resistivity state at = 28 and 29 kbar, we establish that EuFe2As2 is a bulk superconductor at these values of . We also show evidence that the AFM order of the Eu2+ moments persists in the superconducting phase.
A single-crystal ingot of EuFe2As2 was grown by the Bridgman method from a stoichiometric mixture of its constituent elements. A 3He/4He dilution refrigerator or a 3He refrigerator and a superconducting magnet were used for measurements. For the measurements of (), a piece with an -plane area of 1.15 x 1.15 mm2 and a -axis thickness of 0.5 mm was cut. Note that the use of a thick sample enabled us to reliably estimate the volume fraction for the external field in the -direction. In the case of a thin sample, a large demagnetization factor for makes the estimation of the volume fraction very difficult. For measurements along the -axis (in the -plane), the sample was placed in a clamped piston-cylinder pressure cell with the -axis (the -plane) parallel to the cylinder axis. An ac modulation field ( = 67.1 Hz and 0.04 mT) and external magnetic field were applied along the cylinder axis. In order to estimate the size of the signal corresponding to 100% shielding, a piece of Pb with nearly the same dimensions as the sample was measured with the same pick-up coil for the two orientations (namely, the -axis and -plane orientations). The accuracy of these estimations was estimated to be about 10%. For measurements, a thin sample with dimensions of 1 x 0.2 x 0.03 mm3 was exfoliated, where 0.03 mm is along the -axis. After four gold wires were attached to a (001) surface with conducting silver paste, the sample was placed in a clamped piston-cylinder pressure cell with the longest axis, which is the electrical current direction, parallel to the cylinder axis. A standard four-contact method was used with a low-frequency ac current ( = 0.1 mA, = 17 Hz), and the field was applied parallel to the current. For both and measurements, Daphne7474 (Idemitsu Kosan Co., Ltd., Tokyo) was used as a pressure-transmitting medium.[18] This oil does not solidify up to 37 kbar at room temperature (RT)[19] and hence ensures hydrostatic-pressure generation in the present measurements (highest 30 kbar). Furthermore, the pressure cells were cooled slowly (1.5 K/min) from RT down to 20 K to prevent the possible development of nonhydrostaticity. Note that we always refer to the applied field , which may be different from the internal field by 1 T, because of the large saturation moment of Eu2+.
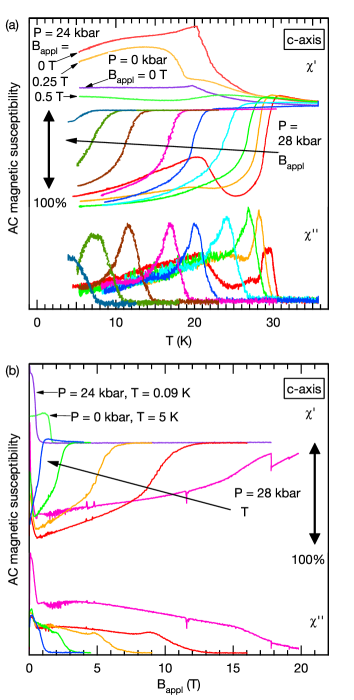
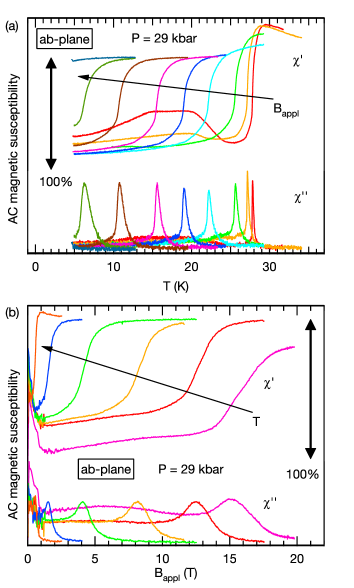
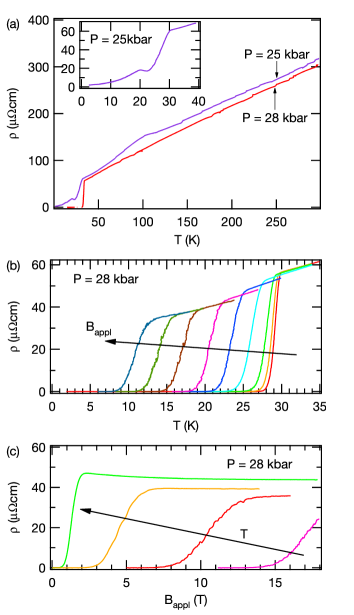
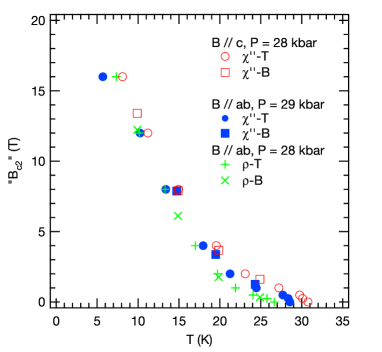
Figure 1(a) shows along the -axis as a function of for various pressures and external fields. At ambient ( = 0 kbar) and = 0 T, the real part increases with decreasing and reaches a maximum at = 20 K, below which the dependence is weak. This is essentially the same as the dependence of dc magnetic susceptibility.[17] At = 24 kbar and = 0 T, exhibits a similar dependence with a maximum at 20 K, although it is enhanced over that at ambient . This is consistent with the previous report that is almost -independent.[10] We observed no clear indication of SC at = 24 kbar. A small field of = 0.25 T markedly changes the shape of the - curve, and when = 0.5 T no clear sign of is visible. At = 28 kbar and = 0 T, exhibits a large drop below = 31 K, then increases with decreasing to reach a maximum at 20 K, and finally decreases again. The large drop in indicates the occurrence of SC, and the size of the drop is consistent with 100% shielding, as indicated by the arrow in the figure. The maximum at 20 K indicates that the AFM ordering of the Eu2+ moments still occurs in the superconducting phase. The feature associated with the magnetic transition is barely visible at = 0.25 T, but is absent at = 0.5 T. With increasing , the superconducting transition shifts to lower .
Figure 1(b) shows along the -axis as a function of for various pressures and temperatures. At = 0 kbar, shows a large drop at approximately 1.5 T, indicating the entrance into the field-induced paramagnetic state, as is consistent with a previous magnetization study.[17] At = 24 kbar, at = 0 is larger than that at = 0 kbar, as is consistent with the - data explained above, and shows a drop at approximately 0.5 T. The - curves at = 28 kbar show superconducting diamagnetism and its suppression with increasing . The curves at = 0.02, 10, 15, and 20 K, namely, , show a drop near 0.5 T, similar to the drop observed at = 24 kbar.
We define (“”) as the temperature (applied magnetic field) where deviates from the normal-state value. The reason why , not , is used is that exhibits and field dependences in the normal state, which makes the unambiguous determination of the onset of SC difficult in some cases [see the = 1 T curve in Fig. 1(a) and the = 25 K curve in Fig. 1(b), for example]. The quotation marks attached to indicate that values are based on the applied field, not on the internal field. The superconducting phase diagram determined from the data in Fig. 1 is shown in Fig. 4.
Figure 2(a) shows in the -plane at = 29 kbar as a function of . With decreasing , the = 0 T curve shows a large drop at = 29 K, then increases to reach a plateau between 20 and 15 K, and finally decreases. The magnitude of diamagnetism is nearly 100%. Although this is not typical of antiferromagnets, the plateau indicates a magnetic phase transition. Note that the dependence of the magnetic susceptibility at ambient shows a similar plateau when measured at = 0.5 T.[17] An indication of a magnetic phase transition is barely visible at = 0.25 T, but is absent at 0.5 T. Figure 2(b) shows in the -plane at = 29 kbar as a function of . The curves at = 0.3, 5, 10, 15, and 20 K, namely , show a decrease with increasing field up to 1 T, similarly to the -axis data. The superconducting phase diagram is shown in Fig. 4.
Figure 3(a) shows at = 25 and 28 kbar as a function of . At = 25 kbar, a hump appears at approximately 100 K, indicating the existence of . shows a sudden drop below 30 K and a hump at approximately 20 K, but does not reach zero (see the inset). This is similar to the data in ref. \citenMiclea08condmat. At = 28 kbar, decreases almost linearly with decreasing from RT and exhibits a sharp drop to zero below 30 K. The midpoint is 29 K. Figures 3(b) and 3(c) show resistive transition curves. The transition width increases as increases. To determine the superconducting phase diagram (Fig. 4), we define (“”) as the temperature (applied magnetic field) where deviates from zero. This criterion gives a much better correspondence with magnetically determined values of at large values of , where the resistive transition widths are large, than the usual midpoint one, though it gives a lower of 27 K at = 0 T.
Although ref. \citenMiclea08condmat suggested that -induced SC coexists with the structural/magnetic transition at , the present and data indicate that bulk SC occurs only when is completely suppressed. There is evidence from the SR and NMR measurements of (Ba1-xKx)Fe2As2 that the apparent coexistence of the orthorhombic AFM phase and superconducting phase in iron pnictide superconductors is not a true coexistence but can be explained by phase separation.[20, 21] Also note that the critical pressure at which the structural/magnetic transition disappears differs between ref. \citenMiclea08condmat and the present work: in ref. \citenMiclea08condmat, no transition was detected above = 23 kbar, while a transition was detected at = 25 kbar in our study. A very recent high- study of SrFe2As2 showed that the critical pressure is very sensitive to the homogeneity of the applied pressure and that it is higher when the pressure is more hydrostatic.[22] This may explain the difference in the critical pressure between ref. \citenMiclea08condmat and the present work. As shown in Fig. 3(a), the appearance of bulk SC is associated with the anomalous nearly -linear . This and the fact that partial (or filamentary) and bulk SC occur below and above the critical pressure of magnetism, respectively, bear resemblance to cases of -induced SC in some heavy-fermion compounds.[23, 24] It is interesting to note that -linear is also observed in a wide range in optimally doped BaFe1.8Co0.2As2.[25]
The superconducting phase diagram (Fig. 4) indicates that “” is almost isotropic. The initial slope -d“”/d at = can be estimated to be 0.5(1), 0.6(2), and 0.19(4) T/K from the -axis , -plane , and -plane data for T, respectively. Although the slope depends on the type of determination method for “”, the estimated slopes are much smaller than those in the -induced SC of other 122 compounds.[3, 4, 7] It is interesting to note that a very large slope of 3.87 T/K was reported for Eu0.7Na0.3Fe2As2.[26] The “”- curves show a strong concave curvature above about 1 T. This reminds us of the dependence of observed in the ternary molybdenum sulphide Sn0.2Eu0.8Mo6.35S8,[27] which can be explained by the Jaccarino-Peter compensation effect arising from the exchange interaction between local moments and conduction carriers.[28]
In conclusion, when the structural/magnetic transition is suppressed by high , EuFe2As2 shows an anomalous nearly -linear dependence of and becomes a bulk superconductor at 30 K. The AFM order of the Eu2+ moments at 20 K persists in the superconducting phase. The upper critical field exhibits a unique dependence, which indicates the effect of the exchange interaction between the Eu2+ moments and conduction carriers.
References
- [1] Y. Kamihara, T. Watanabe, M. Hirano, and H. Hosono: J. Am. Chem. Soc. 130 (2008) 3296.
- [2] M. Rotter, M. Tegel, and D. Johrendt: Phys. Rev. Lett. 101 (2008) 107006.
- [3] M. S. Torikachvili, S. L. Bud’ko, N. Ni, and P. C. Canfield: Phys. Rev. Lett. 101 (2008) 057006.
- [4] T. Park, E. Park, H. Lee, T. Klimczuk, E. D. Bauer, F. Ronning, and J. D. Thompson: J. Phys.: Condens. Matter 20 (2008) 322204.
- [5] P. L. Alireza, Y. T. C. Ko, J. Gillett, C. M. Petrone, J. M. Cole, G. G. Lonzarich, and S. E. Sebastian: J. Phys.: Condens. Matter 21 (2009) 012208.
- [6] H. Fukazawa, N. Takeshita, T. Yamazaki, K. Kondo, K. Hirayama, Y. Kohori, K. Miyazawa, H. Kito, H. Eisaki, and A. Iyo: J. Phys. Soc. Jpn. 77 (2008) 105004.
- [7] H. Kotegawa, H. Sugawara, and H. Tou: J. Phys. Soc. Jpn. 78 (2009) 013709.
- [8] K. Igawa, H. Okada, H. Takahashi, S. Matsuishi, Y. Kamihara, M. Hirano, H. Hosono, K. Matsubayashi, and Y. Uwatoko: J. Phys. Soc. Jpn. 78 (2009) 025001.
- [9] H. Lee, E. Park, T. Park, F. Ronning, E. D. Bauer, and J. D. Thompson: arXiv:0809.3550.
- [10] C. F. Miclea, M. Nicklas, H. S. Jeevan, D. Kasinathan, Z. Hossain, H. Rosner, P. Gegenwart, C. Geibel, and F. Steglich: arXiv:0808.2026.
- [11] After the submission of this article, a preprint has appeared, in which the -induced bulk SC of SrFe2As2 has been demonstrated by measurements. K. Matsubayashi, N. Katayama, K. Ohgushi, A. Yamada, K. Munakata, T. Matsumoto, and Y. Uwatoko: arXiv:0905.0968, to be published in J. Phys. Soc. Jpn.
- [12] W. Yu, A. A. Aczel, T. J. Williams, S. L. Bud’ko, N. Ni, P. C. Canfield, and G. M. Luke: arXiv:0811.2554.
- [13] H. Raffius, E. Mörsen, B. Mosel, W. Müller-Warmuth, W. Jeitschko, L. Terbüchte, and T. Vomhof: J. Phys. Chem. Solids 54 (1993) 135.
- [14] M. Tegel, M. Rotter, V. Weiss, F. M. Schappacher, R. Pottgen, and D. Johrendt: J. Phys.: Condens. Matter 20 (2008) 452201.
- [15] Z. Ren, Z. Zhu, S. Jiang, X. Xu, Q. Tao, C. Wang, C. Feng, G. Cao, and Z. Xu: Phys. Rev. B 78 (2008) 052501.
- [16] H. S. Jeevan, Z. Hossain, D. Kasinathan, H. Rosner, C. Geibel, and P. Gegenwart: Phys. Rev. B 78 (2008) 052502.
- [17] S. Jiang, Y. Luo, Z. Ren, Z. Zhu, C. Wang, X. Xu, Q. Tao, G. Cao, and Z. Xu: New J. Phys. 11 (2009) 025007.
- [18] Daphne7474 was developed by Idemitsu Kosan Co. Ltd. in collaboration with one of the authors KM for use in high-pressure scientific researches.
- [19] K. Murata, K. Yokogawa, H. Yoshino, S. Klotz, P. Munsch, A. Irizawa, M. Nishiyama, K. Iizuka, T. Nanba, T. Okada, Y. Shiraga, and S. Aoyama: Rev. Sci. Instrum. 79 (2008) 085101.
- [20] J. T. Park, D. S. Inosov, C. Niedermayer, G. L. Sun, D. Haug, N. B. Christensen, R. Dinnebier, A. V. Boris, A. J. Drew, L. Schulz, T. Shapoval, U. Wolff, V. Neu, X. Yang, C. T. Lin, B. Keimer, and V. Hinkov: Phys. Rev. Lett. 102 (2009) 117006.
- [21] H. Fukazawa, T. Yamazaki, K. Kondo, Y. Kohori, N. Takeshita, P. M. Shirage, K. Kihou, K. Miyazawa, H. Kito, H. Eisaki, and A. Iyo: J. Phys. Soc. Jpn. 78 (2009) 033704.
- [22] H. Kotegawa, T. Kawazoe, H. Sugawara, K. Murata, and H. Tou: arXiv:0904.4631.
- [23] N. Kimura, K. Ito, K. Saitoh, Y. Umeda, H. Aoki, and T. Terashima: Phys. Rev. Lett. 95 (2005) 247004.
- [24] G. Knebel, D. Aoki, J.-P. Brison, and J. Flouquet: J. Phys. Soc. Jpn. 77 (2008) 114704.
- [25] K. Ahilan, J. Balasubramaniam, F. L. Ning, T. Imai, A. S. Sefat, R. Jin, M. A. McGuire, B. C. Sales, and D. Mandrus: J. Phys.: Condens. Matter 20 (2008) 472201.
- [26] Y. Qi, Z. Gao, L. Wang, D. Wang, X. Zhang, and Y. Ma: New J. Phys. 10 (2008) 123003.
- [27] O. Fischer, M. Decroux, S. Roth, R. Chevrel, and M. Sergent: J. Phys. C 8 (1975) L474.
- [28] V. Jaccarino and M. Peter: Phys. Rev. Lett. 9 (1962) 290.