11email: brunthal@mpifr-bonn.mpg.de 22institutetext: Harvard-Smithsonian Center for Astrophysics, 60 Garden Street, Cambridge, MA 02138, USA 33institutetext: UC Berkeley, 601 Campbell Hall, Astronomy Department & Radio Astronomy Lab, Berkeley, CA 94720, USA 44institutetext: Department of Astrophysics, Radboud Universiteit Nijmegen, Postbus 9010, 6500 GL Nijmegen, the Netherlands 55institutetext: ASTRON, Postbus 2, 7990 AA Dwingeloo, the Netherlands
Discovery of a bright radio transient in M82: a new radio supernova?
In this Letter, we report the discovery of a new bright radio transient in M82. Using the Very Large Array, we observed the nuclear region of M82 at several epochs at 22 GHz and detected a new bright radio source in this galaxy’s central region. We find a flux density for this flaring source that is times larger than the upper limits determined in previous observations. The flare must have started between 2007 October 29 and 2008 March 24. Over the past year, the flux density of this new source has decreased from 100 mJy to 11 mJy. The lightcurve (based on only three data points) can be fitted better with an exponential decay than with a power law. Based on the current data we cannot identify the nature of this transient source. However, a new radio supernova seems to be the most natural explanation. With its flux density of more than 100 mJy, it is at least 1.5 times brighter than SN1993J in M81 at the peak of its lightcurve at 22 GHz.
Key Words.:
(Stars:) supernovae: general, Radio continuum: general, Galaxies: individual: M821 Introduction
M82 is a nearby (3.6 Mpc based on a Cepheid distance to M81 by Freedman et al., 1994) irregular (I0) galaxy with a very active starburst in its nuclear region. It harbors many bright supernova remnants in its central region, which have been studied extensively for decades (Muxlow et al., 1994; Beswick et al., 2006; Fenech et al., 2008). van Buren & Greenhouse (1994) estimate a supernova rate of 0.1 year-1. However, a new radio supernova has not been discovered. Singer et al. (2004) reported a supernova in M82 (SN2004am) that was classified as type-II (Mattila et al., 2004), but it has not been detected at radio wavelengths (Beswick et al., 2004).
Kronberg & Sramek (1985) and Kronberg et al. (2000) monitored the flux densities of 24 radio sources in M82 from 1980 until 1992. Most sources (75%) remained surprisingly constant. There is some controversy about how the fluxes of these compact radio sources can be stable. Models of supernova remnants expanding into a dense medium may explain this (Chevalier & Fransson, 2001). Seaquist & Stanković (2007) argue that the radio emission could arise from wind-driven bubbles. Studying the evolution of a young source could be very important for understanding these models. The strongest source, 41.9+58.0, shows an exponential decay with a decay rate of =11.9 years (Kronberg et al., 2000). Another source, 41.5+597, which was detected in 1981 with a flux density of 10 mJy, faded within a few months to a flux density below 1 mJy (Kronberg & Sramek, 1985; Kronberg et al., 2000). The nature of this strongly variable source was never clarified.
Radio supernova are rare events. So far only about two dozen have been detected (Weiler et al., 2002) and most of them were quite distant and rather weak. This makes it difficult to study them in great detail. One notable exception is SN1993J (Schmidt et al., 1993) in M81, which has been studied extensively (Marcaide et al., 1997, 2009; Bietenholz et al., 2001, 2003; Pérez-Torres et al., 2001, 2002; Bartel et al., 2002, 2007). Thus, the detection of a new nearby supernova would be highly desirable.
M82 is part of the M81 group of galaxies and it shows clear signs of tidal interaction with M81 and NGC 3077 (Yun et al., 1994). This makes the M81 group an ideal system for studying galaxy interaction in great detail. With this motivation, we have initiated a project to measure the proper motions of M81 and M82 with VLBI astrometry. We are observing M81*, the nuclear radio source in M81, bright water masers in M82, and three compact background quasars. Based on our experience with measurements of proper motions in the Local Group (Brunthaler et al., 2005b, 2007), we expect a detection of the tangential motions of M81 and M82 relative to the Milky Way within a few years. So far, we have observed at three epochs at 22 GHz with the High Sensitivity Array (including the Very Long Baseline Array, the Very Large Array, and the Greenbank and Effelsberg telescopes). Here, we report the detection of a new transient source in M82 based on the data from the NRAO111The National Radio Astronomy Observatory is a facility of the National Science Foundation operated under cooperative agreement by Associated Universities, Inc. Very Large Array (VLA).
2 Observations and data reduction
M82 was observed with the Very Large Array (VLA) as part of the High Sensitivity Array observation under projects BB229 and BB255 on 2007 January 28, 2008 May 03, and 2009 April 08. The total observing time in each epoch was 12 hours. We used M81* as phase calibrator and switched between M81*, M82, and 3 extragalactic background quasars every 50 seconds in the cycle M81* – 0945+6924 – M81* – 0948+6848 – M81* – M82 – 1004+6936 – M81*, yielding an integration time of 100 minutes on M82. We observed with two frequency bands of 50 MHz, each in dual circular polarization. The data reduction was performed with the Astronomical Image Processing System (AIPS) and involved standard steps. On 2007 January 28 and 2009 April 08, we used 3 C48 as flux density calibrator. M81* was used as a gain and phase calibrator and one round of phase self-calibration was performed on M82. Unfortunately, no flux density calibrator was observed on 2008 May 03. Here, we assumed a flux density of 150 mJy for the highly variable source M81*. This value was chosen since it was in the range of typical values at cm wavelenghts (e.g. Brunthaler et al., 2006) and it yielded flux densities for 0945+6924, 1004+6936, and 44.0+59.6 in M82 that were consistent with their flux densities at the other two epochs.
M82 was also observed on 2008 March 24 with the VLA at 22 GHz for 10 minutes (6 minutes integration time on M82) in spectral line mode. 3C 48 was used as flux density calibrator, and 1048+717 was used as gain and phase calibrator. A total bandwidth of 9.18 MHz was observed. We also analyzed the archival VLA data of 2007 October 29 at 4.8 GHz, which is the latest available data before our observations. Here, 3C 286 was used as flux density calibrator and 1048+717 was used as phase calibrator. Eighteen minutes of integration time on M82 was spread over 1.5 hours.
3 Results
A new bright source was detected on 2008 May 03 (see Fig. 1, middle and Fig. 2, bottom). With it’s flux density of mJy, it was clearly the brightest radio source in the field (at least five times brighter than the second brightest source). Almost one year later, on 2009 April 08, the source had faded to a flux density of mJy, i.e. losing almost 90% of it’s flux density (see Fig. 1, bottom). We estimated its position to be =09h55m51.551 =69∘40′45.792. Following the traditional convention of previous papers naming a source after the position offset to =09h55m and =69, our new detection would be 42.82+59.54. The positions in the two observations are consistent and the uncertainty was estimated by comparing the position of another clearly identified source (44.0+59.6) with the positions from observations with the Multi-Element Radio Linked Interferometer Network (MERLIN) by Muxlow et al. (1994).
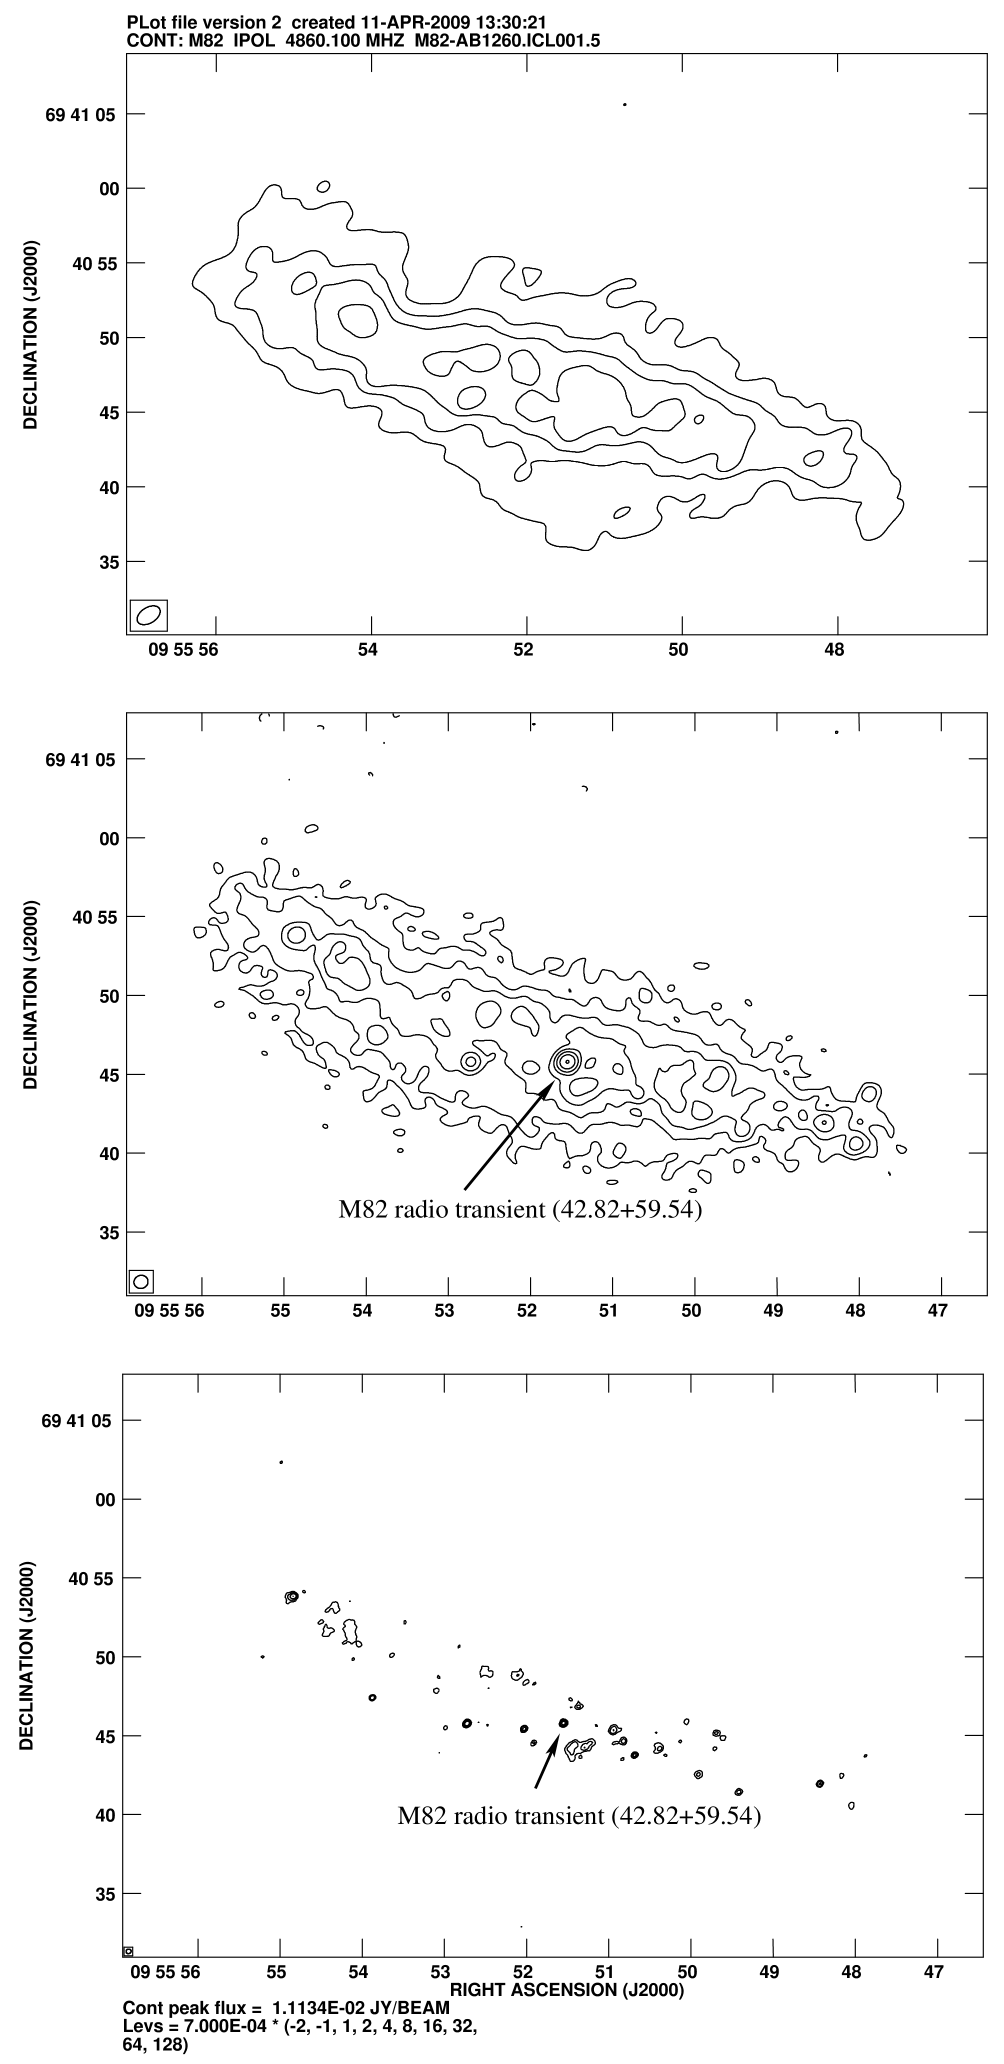
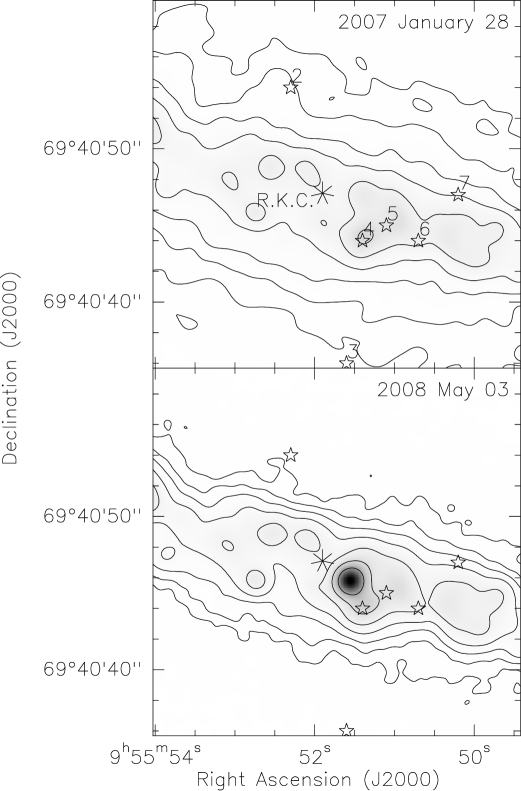
To constrain the start time of the flare, we reduced two earlier VLA observations of M82. The spectral line observation on 2008 March 24 had lower quality, since we observed with a narrow bandwidth and had only 6 minutes integration time on M82. Nevertheless, we could easily confirm the detection of the new source at the same position with a similar but slightly higher flux density as in the 2008 May 03 observation. Next, we analyzed 4.8 GHz data from 2007 October 29. Here, no bright point source was discovered (see Fig. 1, top), so we conclude that the start of the flare was between 2007 October 29 and 2008 March 24. However, it is possible that the source could be highly self-absorbed early in its development and thus might have been detectable at high frequencies, but not at 4.8 GHz. In this case, the flare might have started earlier, but not earlier than 2007 January 28 (the day of our first 22 GHz observation, see Fig. 2, top).
The comparision of flux densities from different epochs in M82 is difficult due to the diffuse emission, in particular when comparing observations with different spatial resolutions. In Table 1, we list the flux densities of the new source along with the flux densities of one additional source in M82 (44.0+59.6), M81*, and three background quasars.
4 Pre-flare observations at other wavelengths
Matsumoto et al. (2001) present high-resolution (FWHM ) x-ray imaging of the central (1.1 1.1 kpc) region of M 82 with the High-Resolution Camera (HRC) aboard the Chandra X-ray Observatory. These images, taken on 1999 October 28 and 2000 January 20, show a total of 9 sources within this area, some of which are highly variable. They do not find a counterpart to our new radio source. Neither do Kong et al. (2007) in a total of 12 datasets of a similar sized region taken with the Chandra HRC and Advanced CCD Imaging Spectrometer Array (ACIS-1 and -2) taken between 1999 September 20 and 2005 August 18. These authors also present Hubble Space Telescope (HST) band (m) imaging of the region with the Near-Infrared Camera and Multi-Object Spectrometer (NICMOS) that, again, does not show a counterpart to our variable radio source.
Körding et al. (2005) observed M82 with the VLA at 8.4 GHz eight times between 2003 June and October in order to detect possible radio flares from several ultraluminous X-ray sources (ULX). No significant emission was found at the position of our new detection above a noise level of 70 Jy at each epoch. A very sensitive eight-day integration of M82 at 5 GHz wavelength was performed with MERLIN between 2002 April 1 and 28 (Fenech et al., 2008). The resulting 40 millarcsecond resolution images show no significant emission at the position of our new source above the rms noise level of Jy beam-1. Tsai et al. (2009) present a 7 mm map from the VLA from 2005 April 22, with no detection of more than 0.3 mJy at the position of our source.
5 Discussion
The most straightforward explanation for this new source is a new radio supernova. A quantitative analysis of the lightcurve is difficult due to the small number of data points (3) we obtained with different angular resolutions, the complication of diffuse emission in M82, and the uncertain absolute flux scale in our observation of 2008 May 03. We extracted the flux d ensities of our source by restricting the interferometer (u,v)-data to 30 k to remove most of the extended emission (Table 1).
We fitted the lightcurve of the source with an exponential decay: S(t)=S0 e. This yields a decay timescale of =0.460.03 yr (Fig. 3). Since we do not know the exact time of the onset of the flare, t0, we get values of S0 between 110 and 270 mJy for t0 between 2008 March 24 and 2007 October 29. For the fit, we added in quadrature the difference between peak and integrated flux density as one error estimate and systematic (flux density scale) errors of 5% for the first and third epochs, and 10% for the second epoch, where no proper flux density calibrator was observed. The resulting was 0.5. Based on this fit, we predict that the source flux density will drop to 5 mJy by mid 2009 and 1.5 mJy in early 2010. We also fitted a simple exponential decay to the 22 GHz lightcurve of SN199J in M81. Here we used the first year of data after the peak in the lightcurve published in Weiler et al. (2007). The fit yields =0.720.09 yr, indicating that the new source in M82 decays faster than SN1993J.
A power-law fit (S(t)(t0-t)α) is not consistent with the lightcurve of the new source in M82 (, for t0 between 2007.8 and 2008). If one allows an earlier t0 (e.g., if the source is highly self-absorbed at lower frequencies), the power-law fit improves (, for t0=2007.08, one day after our 2007 January 28 observation).

The position of the new source is marginally consistent with the position of the kinematic center of M82 (Weliachew et al., 1984). This raises the possibility that, rather than a supernova, we could have detected a flare from a supermassive black hole in the center of M82. Flares in AGN sources can often be fitted with exponential decays (Valtaoja et al., 1999). For example, a strong radio flare in 1999 in the Seyfert galaxy III Zw 2 has a decay rate of =0.73 year (Brunthaler et al., 2005a).
Other explanations, such as luminous flares from quiescent supermassive black holes induced by a close passage of a star that is torn apart by tidal forces, are also possible. However, such flares show a power-law decay with (Evans & Kochanek, 1989; Ayal et al., 2000; Gezari et al., 2009), which is not consistent with our lightcurve.
However, M82 has never shown evidence of a nuclear supermassive black hole (which would be surprising for a small irregular galaxy). Since the progenitor for our flare showed no X-ray emission, a stellar or intermediate mass black hole is also not probable. Thus, based on the current data, a new radio supernova seems to be the most likely explanation.
| Source | Date | Peak Flux | Integrated Flux |
|---|---|---|---|
| [mJy beam-1] | [mJy] | ||
| M82 transient | 24/03/2008 | 104.41.3 | 99.62.3 |
| (42.82+59.54) | 03/05/2008 | 89.90.1 | 88.40.2 |
| 08/04/2009 | 11.10.1 | 9.20.2 | |
| 44.0+59.6 | 28/01/2007 | 15.00.2 | 77.81.0 |
| 03/05/2008 | 12.50.1 | 11.00.2 | |
| 08/04/2009 | 14.70.1 | 12.40.2 | |
| M81* | 28/01/2007 | 711 | 721 |
| 03/05/2008 | 150 | 150 | |
| 08/04/2009 | 1953 | 1795 | |
| 0945+6924 | 28/01/2007 | 14.30.2 | 14.40.3 |
| 03/05/2008 | 14.80.1 | 14.70.2 | |
| 08/04/2009 | 13.80.2 | 12.20.3 | |
| 0948+6848 | 28/01/2007 | 22.50.2 | 24.30.3 |
| 03/05/2008 | 59.10.2 | 59.80.3 | |
| 08/04/2009 | 63.60.4 | 56.30.6 | |
| 1004+6936 | 28/01/2007 | 31.00.2 | 30.80.3 |
| 03/05/2008 | 30.90.2 | 30.40.2 | |
| 08/04/2009 | 34.60.3 | 30.80.4 |
Acknowledgements.
We thank the referee Dr. K. Weiler for critically reading the manuscript.References
- Ayal et al. (2000) Ayal, S., Livio, M., & Piran, T. 2000, ApJ, 545, 772
- Bartel et al. (2002) Bartel, N., Bietenholz, M. F., Rupen, M. P., et al. 2002, ApJ, 581, 404
- Bartel et al. (2007) Bartel, N., Bietenholz, M. F., Rupen, M. P., & Dwarkadas, V. V. 2007, ApJ, 668, 924
- Beswick et al. (2004) Beswick, R. J., Muxlow, T. W. B., Argo, M. K., & Pedlar, A. 2004, IAU Circ., 8332, 2
- Beswick et al. (2006) Beswick, R. J., Riley, J. D., Marti-Vidal, I., et al. 2006, MNRAS, 369, 1221
- Bietenholz et al. (2001) Bietenholz, M. F., Bartel, N., & Rupen, M. P. 2001, ApJ, 557, 770
- Bietenholz et al. (2003) Bietenholz, M. F., Bartel, N., & Rupen, M. P. 2003, ApJ, 597, 374
- Brunthaler et al. (2006) Brunthaler, A., Bower, G. C., & Falcke, H. 2006, A&A, 451, 845
- Brunthaler et al. (2005a) Brunthaler, A., Falcke, H., Bower, G. C., et al. 2005a, A&A, 435, 497
- Brunthaler et al. (2005b) Brunthaler, A., Reid, M. J., Falcke, H., Greenhill, L. J., & Henkel, C. 2005b, Science, 307, 1440
- Brunthaler et al. (2007) Brunthaler, A., Reid, M. J., Falcke, H., Henkel, C., & Menten, K. M. 2007, A&A, 462, 101
- Chevalier & Fransson (2001) Chevalier, R. A. & Fransson, C. 2001, ApJ, 558, L27
- Evans & Kochanek (1989) Evans, C. R. & Kochanek, C. S. 1989, ApJ, 346, L13
- Fenech et al. (2008) Fenech, D. M., Muxlow, T. W. B., Beswick, R. J., Pedlar, A., & Argo, M. K. 2008, MNRAS, 391, 1384
- Freedman et al. (1994) Freedman, W. L., Hughes, S. M., Madore, B. F., et al. 1994, ApJ, 427, 628
- Gezari et al. (2009) Gezari, S., Heckman, T., Cenko, S. B., et al. 2009, ApJ, in press, arXiv:0904.1596
- Kong et al. (2007) Kong, A. K. H., Yang, Y. J., Hsieh, P.-Y., Mak, D. S. Y., & Pun, C. S. J. 2007, ApJ, 671, 349
- Körding et al. (2005) Körding, E., Colbert, E., & Falcke, H. 2005, A&A, 436, 427
- Kronberg & Sramek (1985) Kronberg, P. P. & Sramek, R. A. 1985, Science, 227, 28
- Kronberg et al. (2000) Kronberg, P. P., Sramek, R. A., Birk, G. T., et al. 2000, ApJ, 535, 706
- Marcaide et al. (1997) Marcaide, J. M., Alberdi, A., Ros, E., et al. 1997, ApJ, 486, L31+
- Marcaide et al. (2009) Marcaide, J. M., Marti-Vidal, I., Alberdi, A., et al. 2009, A&A, submitted, arXiv:0903.3833
- Matsumoto et al. (2001) Matsumoto, H., Tsuru, T. G., Koyama, K., et al. 2001, ApJ, 547, L25
- Mattila et al. (2004) Mattila, S., Meikle, W. P. S., Groeningsson, P., et al. 2004, IAU Circ., 8299, 2
- Muxlow et al. (1994) Muxlow, T. W. B., Pedlar, A., Wilkinson, P. N., et al. 1994, MNRAS, 266, 455
- Pérez-Torres et al. (2001) Pérez-Torres, M. A., Alberdi, A., & Marcaide, J. M. 2001, A&A, 374, 997
- Pérez-Torres et al. (2002) Pérez-Torres, M. A., Alberdi, A., & Marcaide, J. M. 2002, A&A, 394, 71
- Schmidt et al. (1993) Schmidt, B. P., Kirshner, R. P., Eastman, R. G., et al. 1993, Nature, 364, 600
- Seaquist & Stanković (2007) Seaquist, E. R. & Stanković, M. 2007, ApJ, 659, 347
- Singer et al. (2004) Singer, D., Pugh, H., & Li, W. 2004, IAU Circ., 8297, 2
- Tsai et al. (2009) Tsai, C.-W., Turner, J. L., Beck, S. C., Meier, D. S., & Ho, P. T. P. 2009, AJ, in press, arXiv:0903.1858
- Valtaoja et al. (1999) Valtaoja, E., Lähteenmäki, A., Teräsranta, H., & Lainela, M. 1999, ApJS, 120, 95
- van Buren & Greenhouse (1994) van Buren, D. & Greenhouse, M. A. 1994, ApJ, 431, 640
- Weiler et al. (2002) Weiler, K. W., Panagia, N., Montes, M. J., & Sramek, R. A. 2002, ARA&A, 40, 387
- Weiler et al. (2007) Weiler, K. W., Williams, C. L., Panagia, N., et al. 2007, ApJ, 671, 1959
- Weliachew et al. (1984) Weliachew, L., Fomalont, E. B., & Greisen, E. W. 1984, A&A, 137, 335
- Yun et al. (1994) Yun, M. S., Ho, P. T. P., & Lo, K. Y. 1994, Nature, 372, 530