Doping dependent optical properties of Bi2201.
Abstract
An experimental study of the in-plane optical conductivity of (Pbx,Bi2-x)(LaySr2-y)CuO6+δ (Bi2201) is presented for a broad doping and temperature range. The in-plane conductivity is analyzed within a strong coupling formalism. We address the interrelationship between the optical conductivity (), the single particle self energy, and the electron-boson spectral function. We find that the frequency and temperature dependence can be well described within this formalism. We present a universal description of optical, ARPES and tunneling spectra. The full frequency and temperature dependence of the optical spectra and single particle self-energy is shown to result from an electron-boson spectral function, which shows a strong doping dependence and weak temperature dependence.
pacs:
71.10.Ay, 72.80.Ga, 74.25.Gz, 74.72.Hs1 Introduction
Many properties distinguish high temperature superconductors from conventional superconductors, most importantly of course the critical temperature. It is therefore not surprising that experimental and theoretical efforts are aimed at finding alternatives for the conventional electron-phonon coupling driven pairing mechanism. The field is currently divided into two schools. The first school explains the peculiarities of these materials by strong correlation effects [1, 2, 3, 4, 5] while the second seeks the origin in the coupling of electrons to a spectrum of bosons [6, 7, 8, 9, 10]. The first school typically approaches the problem starting from doping the Mott-insulating state of the parent compounds. The resulting state of matter is not adiabatically connected to another well known state of matter, the Fermi liquid, hence its properties are fundamentally different. The important interactions are then the on-site Coulomb repulsion and the anti-ferromagnetic exchange coupling , neither of which qualifies as a retarded interaction as in the standard Eliashberg framework [11]. The second school starts by assuming that the underlying state of matter is a Fermi liquid but that the peculiar properties arise due to a strong coupling of electrons to bosons different from phonons in ordinary metals, for example spin fluctuations.
A problem in the study of the electron-boson coupling in cuprates is the high critical temperature of these materials: since spectroscopic signatures of the interaction are smeared out by thermal broadening they are more easily determined at low temperatures. However, a careful description of the superconducting (d-wave) state complicates the analysis tremendously. Nevertheless, some attempts have been made to extract the bosonic spectral function in the superconducting state [12]. The study of cuprates with a low critical temperature can therefore be of interest, because the analysis can be performed at low temperature without the intervention of the superconducting state.
In a recent study we reported on an analysis of the optical properties of several cuprates [13]. We found evidence for a broad, structured bosonic spectrum extending up to energies of 300 to 400 meV. The spectra consist of two features: (i) a robust peak in the range of 50 to 60 meV and (ii) a doping dependent continuum extending to 300 - 400 meV for the samples with the highest . Interestingly, the doping dependence of these spectra correlates with that of the critical temperature. In this paper we report on the optical spectra of (Pbx,Bi2-x)(LaySr2-y)CuO6+δ (Bi2201)used in that study and discuss the analysis of [13] in more detail.
The structure of the paper is as follows. In section 2 we discuss the experimental techniques and optical conductivity. In section 3 the strong coupling formalism is introduced and we present the analysis of optical spectra within this formalism. In section 3.5 we make a comparison with angle resolved photoemission spectroscopy (ARPES) and tunneling experiments within the context of a model unifying the results from both experimental techniques.
2 Experiments
The optical properties of four samples of and substituted Bi2201 are studied: underdoped Bi2Sr1.25La0.75CuO6+δ (UD0, 0 K) and Pb0.5Bi1.55Sr1.2La0.8CuO6+δ (UD10, 10 K), optimally doped Pb0.55Bi1.5Sr1.6La0.4CuO6+δ (OpD35, 35 K) and overdoped Pb0.38Bi1.74Sr1.88CuO6+δ (OD0, 0 K). Temperature dependent experiments are performed in cryostats that have been specially adapted to keep the sample position fixed during thermal cycling. Far-infrared reflectivity experiments are carried out at pressures of about mbar while the mid-infrared reflectivity and near infrared/ ultra violet ellipsometry experiments are carried out under ultra high vacuum conditions with mbar. Samples are freshly cleaved just before being inserted into the cryostat. For each sample, spectra were taken between 10 K and 300 K with a temperature interval of 2 K. We use a Fourier transform infrared spectrometer for reflection experiments in the range 5 meV to 750 meV. The reference for the reflection measurements is taken on a gold film deposited in-situ on the sample. Ellipsometric measurements are performed in the energy range 0.75 - 6 eV.
2.1 Normal incidence reflectivity.
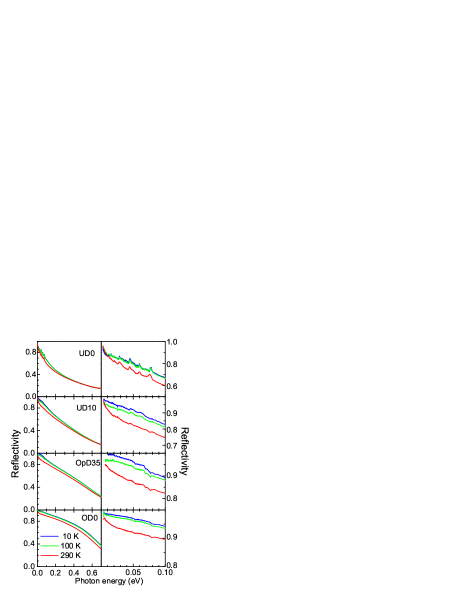
Reflectivity spectra are shown in figure 1 for all four samples at three temperatures: 10 K, 100 K and 290 K. The reflectivity data is characteristic of a bad metal and shows a strong doping dependence. With increasing doping the metallicity increases and the reflectivity increases accordingly. As a result the sharp phonon structures, which can be clearly seen in the UD0 sample (top right panel) become progressively more screened and are hardly visible in the OD0 spectra. The metallicity manifests itself in a dependence on frequency that follows the Hagen-Rubens trend for frequencies below 25 meV (200 cm-1). We made fits to the low frequency reflectivity using the Hagen-Rubens expression to estimate the d.c. resistivity. The values obtained in this way are in agreement with those reported in the literature for similar doping values [14, 15] and the fits extrapolate to = 1 within our experimental uncertainty ( 0.5 %). The exception is the UD0 sample. On a qualitative level the reflectivity looks similar to that of a disordered metal (for an example see [16]). The temperature dependence is also somewhat different from the other samples: the reflectivity increases with decreasing temperature but below 10 meV the reflectivity first shows a small increase and then starts to decrease for temperatures below about 100 K.
2.2 Ellipsometry
Ellipsometric measurements give direct access to the complex pseudo-dielectric function, , that corresponds closely to with a weak admixture of the -axis component. Correspondingly, the transformation from to using the Fresnel equations gives rise to a small correction for the -axis admixture in this frequency range. This has been verified for several high Tc cuprates with roughly the same optical constants [17, 18]. The -axis dielectric constant is almost independent of energy between 1.25 eV and 3 eV and equals roughly 4.1 for Bi2223 and 4.0 for Hg-1201. We use a frequency independent -axis dielectric constant for Bi2201, 4.3, to correct . A systematic error for this procedure was determined by varying the value of between 4 and 4.5 and is indicated as the error bar in figure 2.
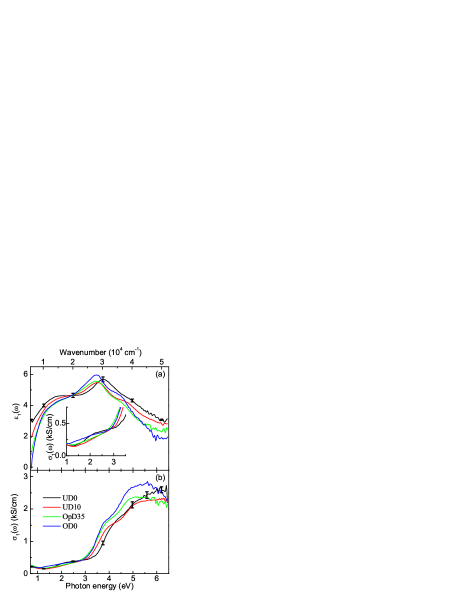
The -axis corrected functions obtained from the ellipsometric measurements, and , are displayed in figure 2. We observe a series of interband transitions starting around 2 eV. At this energy there is a weak onset, which is most clearly pronounced for the UD0 sample, which has been associated with the onset of charge transfer excitations [19]. We observe three more transitions at higher energy which show a significant doping dependence.
2.3 In-plane conductivity
The combination of reflection experiments and ellipsometry makes the determination of the optical conductivity in the IR range more robust, as detailed in [20]. We display the optical conductivity, , in figure 3 at several temperatures. As expected the low frequency conductivity increases strongly with doping (note the factor of two difference in scale between the upper and lower panels). With the exception of the UD0 sample, the conductivities show a metallic Drude response. The UD0 sample shows a broad incoherent response with an interesting temperature dependence: with decreasing temperature an asymmetric peak develops with a maximum at 15 - 20 meV. A similar structure and temperature trend has also been observed for YBa2Cu3O6+δ (YBCO) [21], indicating that this is a generic feature of underdoped cuprates. The pronounced mid-infrared structure observed in [21] is less visible here. The optical conductivity of the OpD35 sample at T = 10 K does not show a clear signature of the superconducting gap, but the conductivity is strongly suppressed as compared to at T = 40 K. Another signature of superconductivity is the presence of a superfluid density, which appears as a -function in with strength . is directly proportional to the superfluid density and can be estimated from a Drude-Lorentz fit. We find 0.84 eV. As a double check we use the fact that, due to causality, the delta function in gives rise to a contribution to . The inset in figure 3c compares the superfluid density obtained by extrapolating to zero frequency to the one obtained from the Drude-Lorentz fit, shown as a semi circle. The two estimates are in good agreement. The superfluid density is substantially smaller compared to optimally doped Bi2212 [22] ( 1.18 eV) and Bi2223 [17] ( 1.28) but Tc is correspondingly lower. This correlation between Tc and the superfluid density has been observed by several authors [23, 24].
3 Analysis
3.1 Extended Drude model
The Drude model describes the optical conductivity of a gas of non-interacting electrons with a single, energy independent channel of dissipation: . This model is insufficient to describe the situation where the dissipation in the electron system arises from the electron-phonon or electron-electron interactions. To deal with these situations we can generalize the Drude model by introducing a memory function [25],
| (1) |
or “optical self-energy” () [9].Two related quantities are the effective mass, and scattering rate, . These quantities are useful because they are more easily interpreted physically. (1) is easily inverted to obtain the scattering rate and effective mass directly from the measured conductivity, provided one has an estimate for the plasma frequency, and the contribution due to interband transitions [26, 18].
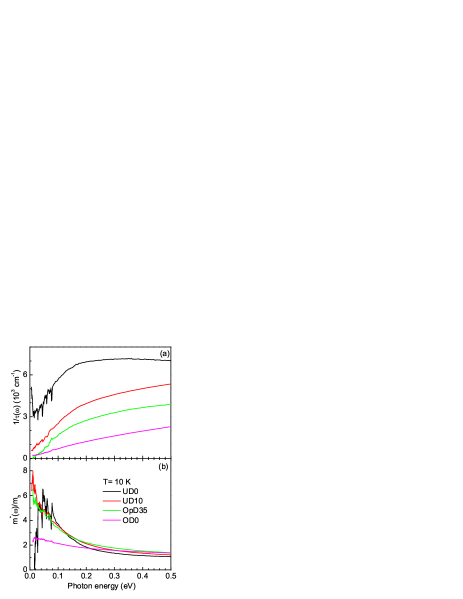
and are shown in figure 4 at T =10 K. The UD0 sample has the highest scattering rate and strongest frequency dependence. However, shows an upturn at low frequency and a corresponding negative effective mass in the same frequency range. The implication of this is that the low temperature, low frequency properties cannot be described in terms of an interacting gas of electrons and thus invalidates the extended Drude analysis for this compound. A similar observation was made in [21] for heavily underdoped YBCO samples. However the scattering rate reported there shows a peak structure around 150 meV which is not found here.
The other three samples show monotonically increasing scattering rates, except in the vicinity of direct optical phonon absorptions. The overall scattering rate as well as the magnitude of the frequency dependence strongly decreases with increasing doping. This can be related to a decreasing coupling to low energy bosonic excitations. A measure of this coupling strength can be obtained from the relation . Therefore can be estimated directly from figure 4b, showing that decreases from 6.5 for UD10 to 1.5 for the OD0 sample. The room temperature values for the three samples are 4.5, 3 and 1.5. The determination of these coupling strengths from experimental quantities will serve as an important consistency check in section 3.2.
3.2 Strong coupling formalism
In this section we will focus on the memory function because of its relation to self-energies above and below the Fermi energy and because structures arising from electron-boson interactions are more clearly visible in than in and [9, 10]. Encoded in the memory function are the self-energy effects associated with the electron-electron and electron-phonon interaction. The relation between single particle self-energies and the memory function is given by [27, 28, 29],
| (2) |
where are Fermi factors and and are self-energies above and below the Fermi energy. To arrive at this result we have to make some assumptions. First, we neglect vertex corrections and the energy dependence of the density of states. Furthermore the self-energies are assumed to be momentum independent. We will return to this latter assumption in section 3.5. Under these circumstances we can express the single particle self-energy as,
| (3) |
with Bose factors, and the“glue function”, . The tilde on this quantity indicates that it is an effective spectral density that potentially contains features not arising from coupling to bosons, for example the opening of a pseudogap in the density of states. Several authors have discussed the applicability of this formalism and its underlying assumptions to the cuprate problem [11, 30, 31, 32, 33]. We want to determine whether or not it can be consistently applied to the optical properties of cuprates and see the implications of the resulting glue-functions with regard to other experimental probes.
Several microscopic theories give predictions about the shape of . We have tested these predictions, as well as “model-independent” functions, for HgBa2CuO4+δ as described in [34]. A general function that consists of a histogram representation of using N blocks with adjustable positions and heights,
| (4) |
where runs from 1 to N, = 0 and is the height of the th block. For we use to circumvent the divergence of the integral in (3). The 2 parameters of this model are optimized using a standard Levenberg-Marquardt least square routine. This routine optimizes the parameters of the histogram model to obtain the best fit to the experimental reflectivity and ellipsometry data. The resulting histogram gives an indication of the important features in the spectrum. We find that the detail of that can be extracted from the experimental data is best represented with = 6 blocks. For cuprates the function consists of two main features: a peak with an energy in the range 50 - 60 meV and a broad spectrum extending up to 400 meV [13].
3.3 Temperature dependence of the self-energy/memory function
(2) and (3) depend on temperature through the Bose and Fermi factors only. In the electron-phonon problem the temperature dependence of the phonon spectral density is very weak, and can be neglected. However, if the bosons that make up derive from electronic degrees of freedom can depend on temperature due to feedback effects [32]. In [13] we found that a fit of the experimental data at all temperatures required a temperature dependent , suggesting that it derives at least in part from electronic degrees of freedom.
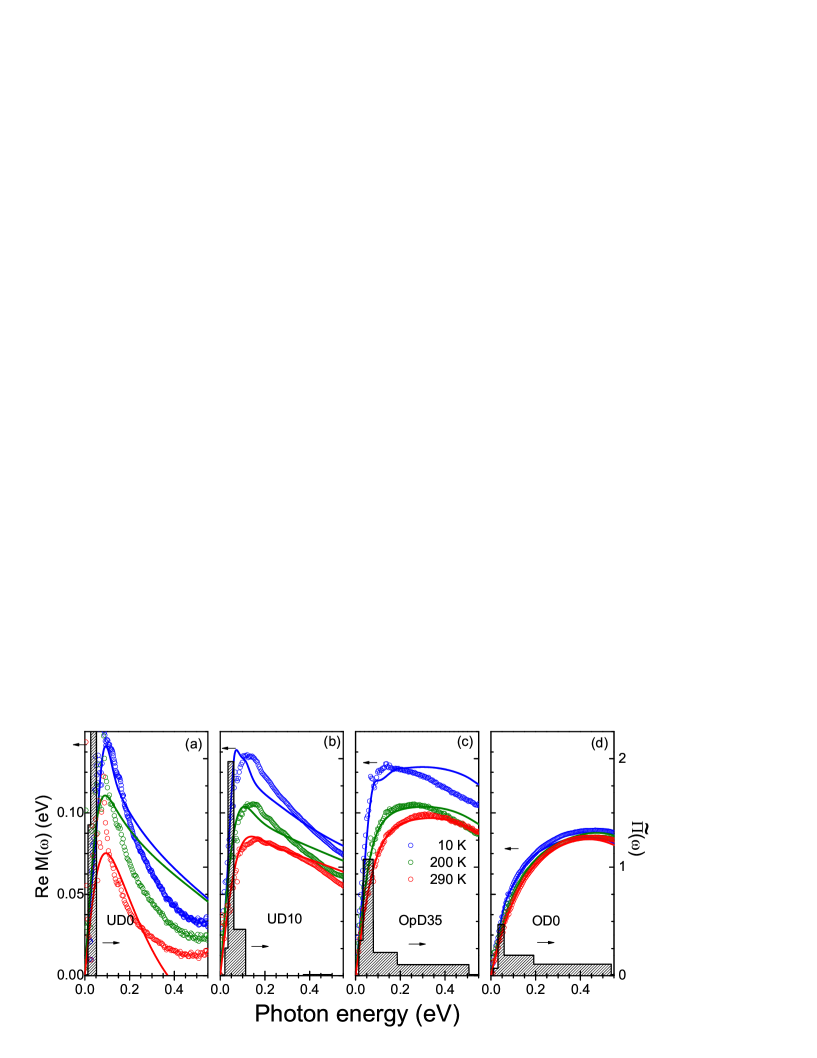
In figure 5 the room temperature spectra are reproduced together with experimental and calculated memory functions for the four samples. The experimental memory functions show a strong doping dependence from narrow and strongly peaked in the underdoped regime to broad with no clear maximum on the overdoped sample. The comparison with the function shows that the presence of this maximum correlates with the strength of the peak at 50 - 60 meV in the function. We use the spectrum that gives the best fit to the room temperature optical spectra to calculate the memory function at several temperatures. At room temperature the calculated is therefore the best fit to the experimental one based on (2) and (3). The reason for choosing the room temperature is that at lower temperatures the spectra might contain features related to the pseudogap. The quality of the fit becomes progressively worse with decreasing doping. For the most underdoped sample, UD0, the room temperature data can no longer be described by this formalism. So we may conclude that (i) (2) and (3) describe well the state of affairs in optimally and overdoped superconductors and (ii) the equations fail miserably for the most underdoped sample. This could imply a doping induced transition between two different states of matter, non-Fermi liquid on the underdoped side and Fermi liquid on the overdoped side. The exact doping value separating these two regimes is difficult to establish beyond any question with this method: the fits and temperature dependence may still be rather good if the system is only slightly away from the Fermi liquid regime.
3.4 Temperature dependence of
is calculated at 10 K and 200 K by correspondingly changing temperature in (2) and (3) but using the same as for 290 K. It is clear from figure 5 that most of the temperature dependence of the optical spectra can indeed be explained within the strong coupling formalism. The remaining differences (for example, at high energies) can be removed by optimizing the parameters of the histogram at each particular temperature.
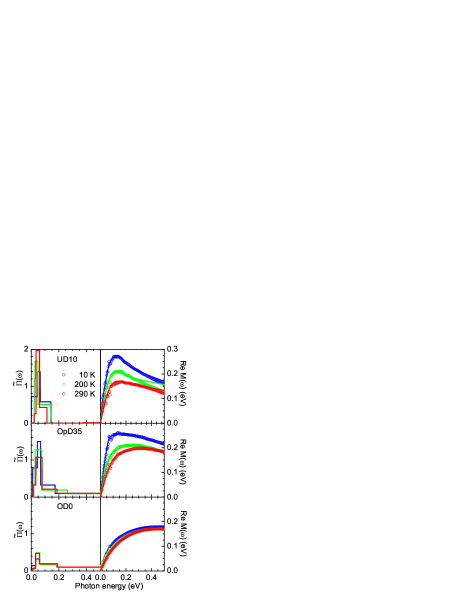
These results are shown in the panels of figure 6 where the memory functions are calculated from functions at corresponding temperatures. The temperature dependence of is weak for the OD0 sample but becomes stronger with decreasing doping. The coupling constant, , can be obtained by two methods (i) from as discussed above and (ii) using the relation . We obtained the same values with these two methods. In figure 7 we show the coupling constants derived for the Bi2201 spectra together with those derived from the other functions presented in [13].
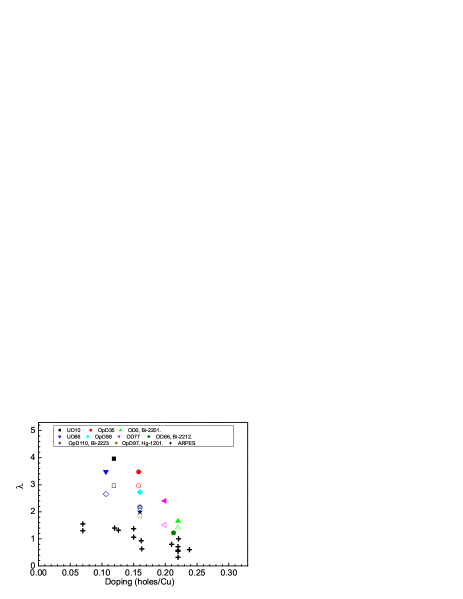
The result shows a strong and systematic increase of for decreasing hole concentration. This trend can also be obtained from other probes, for example from ARPES as indicated by the crosses which are taken from [35]. The ARPES coupling constants are estimates for the nodal direction. They represent only a partial coupling constant determined from the change in dispersion around the low energy kink and are therefore smaller than the ones determined from optics. There is a trend of increasing coupling constant when the temperature is reduced. This temperature dependence becomes stronger upon decreasing the doping. The latter systematic temperature dependence of is a direct consequence of a growth of intensity at low energies below the 50 - 60 meV peak (see the functions of the UD10 sample in the left-hand panels of figure 6). As mentioned above, all trivial thermal factors contained in (2) and (3) are in principle folded out by our procedure. The remaining temperature dependence reflects therefore the thermal properties of the ’glue-function’ itself. In a separate paper [13] we have shown for a large number of cuprates, including the present set of samples, that reasonable (albeit 2-3 times higher than experimental) values of Tc are predicted by the Eliashberg equations using these functions. Moreover the 50 - 60 meV peak seems to be irrelevant for the pairing in the overdoped samples. In the Bi2201 materials Tc is low, despite the fact that the electron-boson coupling found in optical and ARPES experiments is large. is, in fact, quite similar to e.g. Bi2212 and Bi2223 where the maximum Tc is of order 100 Kelvin. This is a natural consequence of cation disorder at the Sr site in the single layer Bi2201 compounds, suppressing rather effectively the -wave order parameter in the copper-oxygen planes[38].
3.5 Discussion.
Hwang et al. have investigated the coupling to bosonic modes by analyzing the optical scattering rates of Bi-2212 [9, 12, 39, 40, 41, 42], YBCO [43] and LSCO [44]. Several other groups have applied different methods of analysis to optical spectra with similar results but differing interpretations [45, 46, 47, 48, 49, 50, 51, 52, 53, 54]. Several other techniques, like ARPES [35, 36, 37, 55, 56, 57, 58, 59, 60, 61, 62, 63] and tunneling [64, 65, 66, 67], also show evidence for coupling of electrons to bosonic modes.
3.6 Comparison with other optical experiments.
In most of the earlier work a spectral function consisting of two contributions is reported: a peak below 100 meV and structure in the 200 - 300 meV range. The doping trend of seen in figure 5 is similar to the one observed in [40] for Bi2Sr2CaCu2O8+δ , namely that is a broad and featureless function for high dopings and becomes peaked and narrow for lower dopings. The authors of [12] apply an analysis similar to ours and also find an overall decrease in intensity in with increasing doping (note that in [12] the notation is used for ). The main difference with their analysis is that we find the spectra to be much less temperature dependent in the low energy region of , in agreement with the results obtained by Dordevic et al. [52]. Hwang et al. explain the temperature and doping dependence of these spectra as arising from the presence of a pseudogap at lower temperatures for the underdoped samples [42]. Although we cannot fully exclude this possibility, the analysis in figure 5 shows that another interpretation is also possible: namely the peak in at low doping arises from the coupling to a bosonic mode. This peak is smeared out at higher temperatures by the Bose and Fermi factors appearing in (2) and (3). The peak in disappears with increasing doping simply because the coupling to low energy bosonic modes gets weaker. The temperature effect is much more pronounced for Hg1201 where the peak in is more clearly visible [13]. Although there is no simple relation between the energy of a peak seen in and one seen in a pseudogap would shift the peak in to higher energies as compared to the peak in . We note that the experimental in figure 5 show the opposite trend, i.e. the peak in shifts to lower energy with decreasing temperature. Our analysis thus shows that features in the optical spectra which have been attributed to the opening of a pseudogap [68] can in fact be explained by a nearly temperature independent peak in in the 50 - 60 meV range.
3.7 Comparison with ARPES.
The experimental results from ARPES can be summarized as indicative of two distinct structures in the electron energy dispersion. Along the nodal direction one observes a kink at low energy 50 - 70 meV [35, 37, 55, 56] followed by a “waterfall” around 350 meV [62, 63]. The interpretation of these two features is still under debate. Along the anti-nodal direction only the low energy feature is observed since the band bottom occurs around 100 meV. The kink has a smaller energy 40 meV in the normal state and is shifted to 70 meV in the superconducting state as a result of the opening of the superconducting gap [57, 58, 60, 61].
If we ignore for the moment the momentum anisotropy, then the self energies calculated with can be compared to extracted from ARPES. ARPES experiments have been performed on crystals taken from the same batch as used in this study [37, 69]. The self-energy along the nodal direction has been determined using a full 2D analysis of the spectral function using the LDA band structure as bare band dispersion [69]. The self energies of the OpD35 and OD10 samples are shown in figure 8a and 8b respectively by open circles. The self energies calculated from the optical function are shown in the same figure in red. These self energies are quite different but a closer examination reveals that several features correspond quite well. Both experiments show structure in the 50 -60 meV range and display a maximum in in the 200 - 300 meV range. In order to determine the experimental from ARPES an assumption has to be made for the bare band dispersion. The fact that both the experimental and calculated self-energy have almost parallel slope in the limit of frequency going to zero, suggests that at least the low energy properties determined by optical spectroscopy and ARPES are compatible.
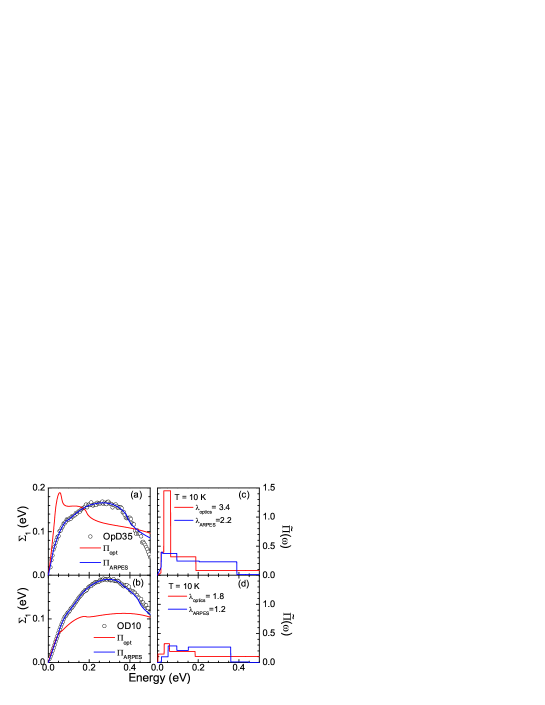
The ARPES self-energy can be further analyzed using our histogram model for . The fit to the ARPES self-energy is shown in blue in figure 8a and 8b. The functions obtained from optics and ARPES are compared in panels 8c and 8d. The optical and ARPES glue-functions, although at first glance quite different, have a number of globally similar features: (i) the overall coupling strength, (ii) the broad energy range and (iii) the 50 - 60 meV peak. We note that the low energy kink in the ARPES data gives rise to a peak in at the same energy as the optical data. The total coupling constants, indicated in figure 8c and 8d, are somewhat larger for the optical function. The same trend is seen in figure 7 where we compared obtained from ARPES and optics for several samples. Since the optical conductivity has contributions from all of k-space one may expect that this explains the difference between optical and ARPES results. Stojkovic and Pines show that the optical conductivity is a linear superposition of contributions along the Fermi surface where the self-energies are k-dependent quantities [70],
| (5) |
We can estimate the effect of anisotropy using our knowledge of the electronic structure from ARPES. As summarized above, the kink disperses from 70 meV at the nodal direction to 40 meV at the anti-nodal direction [71]. The second ingredient needed is the bare Fermi velocity, . Estimates for the k-dependence of are available for Bi-2212 from Kaminski et al. [72]. The effect of anisotropy on can now be estimated by assuming that has two contributions: one from the nodal direction and one from the anti-nodal direction. We separately calculate the conductivity arising from the nodal and anti-nodal directions using the functions given in figure 9a and 9b. These functions are chosen such that they are compatible with the experimental observations discussed above. The resulting conductivities are weighted with the Fermi velocity ratio : = 2 : 1.

The resulting optical conductivity is then analyzed using the same method as the experimental data in section 3.2. The function shown in figure 9c shows that the momentum anisotropy in gives rise to a mode energy that is a weighted average of the nodal and antinodal direction. A comparison of these results with the functions from figure 8c and 8d shows that, (i) the low energy kink seen by optics has an energy somewhat smaller than the nodal kink energy seen by ARPES and (ii) there is less intensity in the high energy range seen by optics compared with the nodal self-energy determined from ARPES. Both effects arise because the optical function is an effective function that contains contributions from all points around the Fermi surface.
3.8 Comparison to tunneling experiments.
The analysis of tunneling data for the cuprates turns out to be more complicated than for conventional superconductors. Several groups have found evidence for coupling to bosonic modes. Two groups report coupling to a mode around 40 meV [64, 65, 67]. This is significantly lower than our result. We note however that the tunneling experiments are mainly sensitive to the anti-nodal region of k-space due to the presence of a van Hove singularity. As we have seen above ARPES experiments indicate that in the antinodal region the mode energy is indeed close to 40 meV. However, using a different analysis Lee et al. report coupling to a bosonic mode at 53 meV in Bi2212 [66].
4 Conclusions and outlook.
The optical properties of Bi2201 show an interesting evolution with doping. The strongly underdoped UD0 sample shows a non-Drude behavior at low temperatures, while the more doped compounds all show Drude like behavior. It is interesting to speculate at which doping the transition from one type of low temperature behavior to the other occurs. One possibility is that it coincides with the onset of superconductivity. An interesting consequence of our analysis is than that the onset of superconductivity separates two different normal states of matter. The optical properties for higher dopings could be described within the strong coupling formalism while the properties of the UD0 sample clearly fall in a different universality class dominated by strong electron correlations.
The strong coupling analysis shows that the coupling to bosonic modes in these materials decreases strongly as a function of doping. For the UD10 sample we find a narrow boson spectrum with a large intensity in the range below 100 meV. With increasing doping two separate trends are observed: the spectrum broadens and the coupling to the 50 - 60 meV peak is strongly reduced. Our study shows that the main temperature dependence of the optical spectra can be understood to arise from the thermal factors appearing in the strong coupling formalism. To consistently fit the frequency dependence at all temperatures we have to allow for temperature dependence in the function. This suggests that part of the spectrum is electronic in nature. Since the peak in the 50 - 60 meV range is present at all temperatures and has a relatively weak doping dependence, we conclude that it partially arises from vibrational degrees of freedom.
5 Acknowledgments
We gratefully acknowledge stimulating discussions with J. Zaanen, D.J. Scalapino, C.M. Varma, A.V. Chubukov, T.P. Devereaux and Z.X. Shen. This work is supported by the Swiss National Science Foundation through Grant No. 200020-113293 and the National Center of Competence in Research (NCCR) Materials with Novel Electronic Properties - MaNEP .
References
- [1] P. W. Anderson. The resonating valence bond state in la2cuo4 and superconductivity. Science, 235(4793):1196–1198, 1987.
- [2] G. Seibold and J. Lorenzana. Magnetic fluctuations of stripes in the high temperature cuprate superconductors. Phys. Rev. Lett., 94(10):107006, 2005.
- [3] P. Phillips. Mottness. Ann. Phys., 321:1634, 2006.
- [4] K. Haule and G. Kotliar. Strongly correlated superconductivity: A plaquette dynamical mean-field theory study. Phys. Rev. B, 76(10):104509, 2007.
- [5] D. Eichenberger and D. Baeriswyl. Superconductivity and antiferromagnetism in the two-dimensional hubbard model: A variational study. Phys. Rev. B, 76(18):180504, 2007.
- [6] C. M. Varma, P. B. Littlewood, S. Schmitt-Rink, E. Abrahams, and A. E. Ruckenstein. Phenomenology of the normal state of cu-o high-temperature superconductors. Phys. Rev. Lett., 63(18):1996–1999, Oct 1989.
- [7] A. J. Millis, H Monien, and D Pines. Phenomenological model of nuclear relaxation in the normal state of . Phys. Rev. B, 42(1):167–178, Jul 1990.
- [8] E. Demler and S. C. Zhang. Quantitative test of a microscopic mechanism of high-temperature superconductivity. Nature, 396:733–735, 1998.
- [9] J. Hwang, T. Timusk, and G. D. Gu. High-transition-temperature superconductivity in the absence of the magnetic-resonance mode. Nature, 427:714, 2004.
- [10] M. R. Norman and A. V. Chubukov. High-frequency behavior of the infrared conductivity of cuprates. Phys. Rev. B, 73(14):140501, 2006.
- [11] P. W. Anderson. Is there glue in cuprate superconductors? Science, 316(5832):1705–1707, 2007.
- [12] J. Hwang, T. Timusk, E. Schachinger, and J. P. Carbotte. Evolution of the bosonic spectral density of the high-temperature superconductor . Phys. Rev. B, 75(14):144508, 2007.
- [13] E. van Heumen, E. Muhlethaler, A.B. Kuzmenko, D. van der Marel, W. Meevasana, Z.X. Shen, and H. Eisaki. Observation of robust 55 mev resonance in the glue function of high cuprates. submitted. Preprint available at condmat/0807.1730, 2008.
- [14] Yoichi Ando, Y. Hanaki, S. Ono, T. Murayama, Kouji Segawa, N. Miyamoto, and Seiki Komiya. Carrier concentrations in single crystals and their relation to the hall coefficient and thermopower. Phys. Rev. B, 61(22):R14956–R14959, Jun 2000.
- [15] S. Ono and Yoichi Ando. Evolution of the resistivity anisotropy in single crystals for a wide range of hole doping. Phys. Rev. B, 67(10):104512, Mar 2003.
- [16] Kwanghee Lee, A. J. Heeger, and Y. Cao. Reflectance of polyaniline protonated with camphor sulfonic acid: Disordered metal on the metal-insulator boundary. Phys. Rev. B, 48(20):14884–14891, Nov 1993.
- [17] F. Carbone, A. B. Kuzmenko, H. J. A. Molegraaf, E. van Heumen, E. Giannini, and D. van der Marel. In-plane optical spectral weight transfer in optimally doped bi2sr2ca2cu3o10. Phys. Rev. B, 74(2):024502, 2006.
- [18] E. van Heumen, R. Lortz, A. B. Kuzmenko, F. Carbone, D. van der Marel, X. Zhao, G. Yu, Y. Cho, N. Barisic, M. Greven, and C.C. Homesand S.V. Dordevic. Optical and thermodynamic properties of the high-temperature superconductor . Phys. Rev. B, 75(5):054522, 2007.
- [19] S. Uchida, T. Ido, H. Takagi, T. Arima, Y. Tokura, and S. Tajima. Optical spectra of : Effect of carrier doping on the electronic structure of the plane. Phys. Rev. B, 43(10):7942–7954, Apr 1991.
- [20] A. B. Kuzmenko. Kramers–kronig constrained variational analysis of optical spectra. Rev. Sci. Inst., 76(8):083108, 2005.
- [21] Y. S. Lee, Kouji Segawa, Z. Q. Li, W. J. Padilla, M. Dumm, S. V. Dordevic, C. C. Homes, Yoichi Ando, and D. N. Basov. Electrodynamics of the nodal metal state in weakly doped high-tc cuprates. Phys. Rev. B, 72(5):054529, 2005.
- [22] H. J. A. Molegraaf, C. Presura, D. van der Marel, P. H. Kes, and M. Li. Superconductivity-induced transfer of in-plane spectral weight in . Science, 295(5563):2239–2241, 2002.
- [23] Y. J. Uemura, G. M. Luke, B. J. Sternlieb, J. H. Brewer, J. F. Carolan, W. N. Hardy, R. Kadono, J. R. Kempton, R. F. Kiefl, S. R. Kreitzman, P. Mulhern, T. M. Riseman, D. Ll. Williams, B. X. Yang, S. Uchida, H. Takagi, J. Gopalakrishnan, A. W. Sleight, M. A. Subramanian, C. L. Chien, M. Z. Cieplak, Gang Xiao, V. Y. Lee, B. W. Statt, C. E. Stronach, W. J. Kossler, and X. H. Yu. Universal correlations between and (carrier density over effective mass) in high- cuprate superconductors. Phys. Rev. Lett., 62(19):2317–2320, May 1989.
- [24] C. C. Homes, S. V. Dordevic, M. Strongin, D. A. Bonn, Ruixing Liang, W. N. Hardy, Seiki Komiya, Yoichi Ando, G. Yu, N. Kaneko, X. Zhao, M. Greven, D. N. Basov, and T. Timusk. A universal scaling relation in high-temperature superconductors. Nature, 430(19):539–541, July 2004.
- [25] J. W. Allen and J. C. Mikkelsen. Optical properties of crsb, mnsb, nisb, and nias. Phys. Rev. B, 15(6):2952–2960, Mar 1977.
- [26] D. van der Marel, H. J. A. Molegraaf, J. Zaanen, Z. Nussinov, F. Carbone, A. Damascelli, H. Eisaki, M. Greven, P. H. Kes, and M. Li. Quantum critical behaviour in a high- superconductor. Nature, 425:271–274, 2003.
- [27] P. B. Allen. Electron-phonon effects in the infrared properties of metals. Phys. Rev. B, 3(2):305–320, Jan 1971.
- [28] P. B. Allen and B. Mitrovic. Theory of superconducting . In H. Ehrenreich, F. Seitz, and D. Turnbull, editors, Solid state physics, Advances in research and applications, page 2, London, 1982. Academic Press.
- [29] G.D. Mahan. Many particle physics. Physics of solids and liquids, New york and London, 1981. Plenum Press.
- [30] E. G. Maksimov. High-temperature superconductivity: the current state. Physics-Uspekhi, 43(10):965–990, 2000.
- [31] S. G. Sharapov and J. P. Carbotte. Effects of energy dependence in the quasiparticle density of states on far-infrared absorption in the pseudogap state. Phys. Rev. B, 72(13):134506, 2005.
- [32] A. V. Chubukov and J. Schmalian. Superconductivity due to massless boson exchange in the strong-coupling limit. Phys. Rev. B, 72(17):174520, 2005.
- [33] T. A. Maier, D. Poilblanc, and D. J. Scalapino. Dynamics of the pairing interaction in the hubbard and t-j models of high-temperature superconductors. Phys. Rev. Lett., 100(23):237001, 2008.
- [34] E. van Heumen, A.B. Kuzmenko, and D. van der Marel. Optics clues to pairing glues in high tc cuprates. submitted to Journal of Physics: conference proceedings of the 25th international low temperature physics., 2008.
- [35] A. Lanzara, P. V. Bogdanov, X. J. Zhou, S. A. Kellar, D. L. Feng, E. D. Lu, T. Yoshida, H. Eisaki, A. Fujimori, K. Kishio, J. I. Shimoyama, T. Noda, S. Uchida, Z. Hussain, and Z. X. Shen. Evidence for ubiquitous strong electron-phonon coupling in high-temperature superconductors. Nature, 412:510, 2001.
- [36] P. D. Johnson, T. Valla, A. V. Fedorov, Z. Yusof, B. O. Wells, Q. Li, A. R. Moodenbaugh, G. D. Gu, N. Koshizuka, C. Kendziora, Sha Jian, and D. G. Hinks. Doping and temperature dependence of the mass enhancement observed in the cuprate . Phys. Rev. Lett., 87(17):177007, Oct 2001.
- [37] W. Meevasana, N. J. C. Ingle, D. H. Lu, J. R. Shi, F. Baumberger, K. M. Shen, W. S. Lee, T. Cuk, H. Eisaki, T. P. Devereaux, N. Nagaosa, J. Zaanen, and Z.-X. Shen. Doping dependence of the coupling of electrons to bosonic modes in the single-layer high-temperature bi2sr2cuo6 superconductor. Phys. Rev. Lett., 96(15):157003, 2006.
- [38] H. Eisaki, N. Kaneko, D. L. Feng, A. Damascelli, P. K. Mang, K. M. Shen, Z.-X. Shen, and M. Greven. Effect of chemical inhomogeneity in bismuth-based copper oxide superconductors. Phys. Rev. B, 69(6):064512, Feb 2004.
- [39] J. Hwang, T. Timusk, A. V. Puchkov, N. L. Wang, G. D. Gu, C. C. Homes, J. J. Tu, and H. Eisaki. Marginal fermi liquid analysis of 300 k reflectance of . Phys. Rev. B, 69(9):094520, Mar 2004.
- [40] J. Hwang, T. Timusk, and G. D. Gu. Doping dependent optical properties of bi2sr2cacu2o8+δ. J. Phys: Cond. Mat., 19:125208, 2007.
- [41] J. Hwang, E. J. Nicol, T. Timusk, A. Knigavko, and J. P. Carbotte. High energy scales in the optical self-energy of the cuprate superconductors. Phys. Rev. Lett., 98(20):207002, 2007.
- [42] J. Hwang, J. P. Carbotte, and T. Timusk. Evidence for a pseudogap in underdoped bi2sr2cacu2o2+δ and yba2cu3o6.50 from in-plane optical conductivity measurements. Phys. Rev. Lett., 100(17):177005, 2008.
- [43] J. Hwang, J. Yang, T. Timusk, S. G. Sharapov, J. P. Carbotte, D. A. Bonn, Ruixing Liang, and W. N. Hardy. a-axis optical conductivity of detwinned ortho-ii . Phys. Rev. B, 73(1):014508, 2006.
- [44] J. Hwang, E. Schachinger, J. P. Carbotte, F. Gao, D. B. Tanner, and T. Timusk. Bosonic spectral density of epitaxial thin-film la1.83sr0.17cuo4 superconductors from infrared conductivity measurements. Phys. Rev. Lett., 100(13):137005, 2008.
- [45] G. A. Thomas, J. Orenstein, D. H. Rapkine, M. Capizzi, A. J. Millis, R. N. Bhatt, L. F. Schneemeyer, and J. V. Waszczak. : Electrodynamics of crystals with high reflectivity. Phys. Rev. Lett., 61(11):1313–1316, Sep 1988.
- [46] Z. Schlesinger, R. T. Collins, F. Holtzberg, C.Feild, N. E. Bickers, and D. J. Scalapino. Absence of strong coupling in inferred from infrared conductivity. Nature, 343:242–243, 1991.
- [47] T. Timusk, C. D. Porter, and D. B. Tanner. Strong electron-phonon interaction in the high- superconductors: Evidence from the infrared. Phys. Rev. Lett., 66(5):663–666, Feb 1991.
- [48] J. P. Carbotte, E. Schachinger, and D. N. Basov. Coupling strength of charge carriers to spin fluctuations in high-temperature superconductors. Nature, 401(6701):354–356, 1999.
- [49] D. Munzar, C. Bernhard, and M. Cardona. Does the peak in the magnetic susceptibility determine the in-plane infrared conductivity of ybco? a theoretical study. Physica C, 312(1):121–135, Jan 1999.
- [50] J. J. Tu, C. C. Homes, G. D. Gu, D. N. Basov, and M. Strongin. Optical studies of charge dynamics in optimally doped . Phys. Rev. B, 66(14):144514, Oct 2002.
- [51] T. Timusk. Strong electron-phonon interaction in the high- superconductors: Evidence from the infrared. J. Phys: Cond. Mat., 127(5):337–348, May 2003.
- [52] S. V. Dordevic, C. C. Homes, J. J. Tu, T. Valla, M. Strongin, P. D. Johnson, G. D. Gu, and D. N. Basov. Extracting the electron-boson spectral function from infrared and photoemission data using inverse theory. Phys. Rev. B, 71(10):104529, 2005.
- [53] Y. S. Lee, Z. Q. Li, W. J. Padilla, S. V. Dordevic, C. C. Homes, Kouji Segawa, Yoichi Ando, and D. N. Basov. Strong-coupling effects in cuprate high-tc superconductors by magneto-optical studies. Phys. Rev. B, 72(17):172511, 2005.
- [54] P. Casek, C. Bernhard, J. Humlicek, and D. Munzar. Interpretation of in-plane infrared response of high-tc cuprate superconductors involving spin fluctuations using quasiparticle spectral functions. Phys. Rev. B, 72(13):134526, 2005.
- [55] P. V. Bogdanov, A. Lanzara, S. A. Kellar, X. J. Zhou, E. D. Lu, W. J. Zheng, G. Gu, J. I. Shimoyama, K. Kishio, H. Ikeda, R. Yoshizaki, Z. Hussain, and Z. X. Shen. Evidence for an energy scale for quasiparticle dispersion in . Phys. Rev. Lett., 85(12):2581–2584, Sep 2000.
- [56] A. Kaminski, M. Randeria, J. C. Campuzano, M. R. Norman, H. Fretwell, J. Mesot, T. Sato, T. Takahashi, and K. Kadowaki. Renormalization of spectral line shape and dispersion below in . Phys. Rev. Lett., 86(6):1070–1073, Feb 2001.
- [57] A. D. Gromko, A. V. Fedorov, Y.-D. Chuang, J. D. Koralek, Y. Aiura, Y. Yamaguchi, K. Oka, Yoichi Ando, and D. S. Dessau. Mass-renormalized electronic excitations at in the superconducting state of . Phys. Rev. B, 68(17):174520, Nov 2003.
- [58] S. V. Borisenko, A. A. Kordyuk, T. K. Kim, A. Koitzsch, M. Knupfer, J. Fink, M. S. Golden, M. Eschrig, H. Berger, and R. Follath. Anomalous enhancement of the coupling to the magnetic resonance mode in underdoped pb-bi2212. Phys. Rev. Lett., 90(20):207001, May 2003.
- [59] X. J. Zhou, T. Yoshida, A. Lanzara, P. V. Bogdanov, S. A. Kellar, K. M. Shen, W. L. Yang, F. Ronning, T. Sasagawa, T. Kakeshita, T. Noda, H. Eisaki, S. Uchida, C. T. Lin, F. Zhou, J. W. Xiong, W. X. Ti, Z. X. Zhao, A. Fujimori, Z. Hussain, and Z. X. Shen. High-temperature superconductors: Universal nodal fermi velocity. Nature, 423:398, 2003.
- [60] T. Cuk, F. Baumberger, D. H. Lu, N. Ingle, X. J. Zhou, H. Eisaki, N. Kaneko, Z. Hussain, T. P. Devereaux, N. Nagaosa, and Z.-X. Shen. Coupling of the phonon to the antinodal electronic states of . Phys. Rev. Lett., 93(11):117003, Sep 2004.
- [61] X. J. Zhou, Junren Shi, T. Yoshida, T. Cuk, W. L. Yang, V. Brouet, J. Nakamura, N. Mannella, Seiki Komiya, Yoichi Ando, F. Zhou, W. X. Ti, J. W. Xiong, Z. X. Zhao, T. Sasagawa, T. Kakeshita, H. Eisaki, S. Uchida, A. Fujimori, Zhenyu Zhang, E. W. Plummer, R. B. Laughlin, Z. Hussain, and Z.-X. Shen. Multiple bosonic mode coupling in the electron self-energy of (la2-xsrx)cuo4. Phys. Rev. Lett., 95(11):117001, 2005.
- [62] T. Valla, T. E. Kidd, W.-G. Yin, G. D. Gu, P. D. Johnson, Z.-H. Pan, and A. V. Fedorov. High-energy kink observed in the electron dispersion of high-temperature cuprate superconductors. Phys. Rev. Lett., 98(16):167003, 2007.
- [63] D. S. Inosov, J. Fink, A. A. Kordyuk, S. V. Borisenko, V. B. Zabolotnyy, R. Schuster, M. Knupfer, B. Buchner, R. Follath, H. A. Durr, W. Eberhardt, V. Hinkov, B. Keimer, and H. Berger. Momentum and energy dependence of the anomalous high-energy dispersion in the electronic structure of high temperature superconductors. Phys. Rev. Lett., 99(23):237002, 2007.
- [64] N. Miyakawa, J. F. Zasadzinski, L. Ozyuzer, P. Guptasarma, D. G. Hinks, C. Kendziora, and K. E. Gray. Predominantly superconducting origin of large energy gaps in underdoped from tunneling spectroscopy. Phys. Rev. Lett., 83(5):1018–1021, Aug 1999.
- [65] J. F. Zasadzinski, L. Ozyuzer, N. Miyakawa, K. E. Gray, D. G. Hinks, and C. Kendziora. Correlation of tunneling spectra in with the resonance spin excitation. Phys. Rev. Lett., 87(6):067005, Jul 2001.
- [66] J. Lee, K. Fujita, K. McElroy, J. A. Slezak, M. Wang, Y. Aiura, H. Bando, M. Ishikado, T. Masui, J. X. Zhu, A. V. Balatsky, H. Eisaki, S. Uchida, and J. C. Davis. Interplay of electron lattice interactions and superconductivity in bi2sr2cacu2o8+δ. Nature, 442:546, august 2006.
- [67] Giorgio Levy de Castro, Christophe Berthod, Alexandre Piriou, Enrico Giannini, and Oystein Fischer. Preeminent role of the van hove singularity in the strong-coupling analysis of scanning tunneling spectroscopy for two-dimensional cuprate superconductors. Phys. Rev. Lett., 101(26):267004, 2008.
- [68] D. N. Basov and T. Timusk. Electrodynamics of high-tc superconductors. Rev. Mod. Phys., 77(2):721, 2005.
- [69] W. Meevasana, F. Baumberger, K. Tanaka, F. Schmitt, W. R. Dunkel, D. H. Lu, S. K. Mo, H. Eisaki, and Z. X. Shen. Extracting the spectral function of the cuprates by a full two-dimensional analysis: Angle-resolved photoemission spectra of bi2sr2cuo6. Phys. Rev. B, 77(10):104506, 2008.
- [70] B. P. Stojkovic and D. Pines. Theory of the longitudinal and hall conductivities of the cuprate superconductors. Phys. Rev. B, 55(13):8576–8595, Apr 1997.
- [71] X. J. Zhou, T. Cuk, T. Devereaux, N. Nagaosa, and Z. X. Shen. Angle-resolved photoemission spectroscopy on electronic structure and electron-phonon coupling in cuprate superconductors. Handbook of High-Temperature Superconductivity: Theory and Experiment, edited by J. R. Schrieffer, (Springer), 2007.
- [72] A. Kaminski, H. M. Fretwell, M. R. Norman, M. Randeria, S. Rosenkranz, U. Chatterjee, J. C. Campuzano, J. Mesot, T. Sato, T. Takahashi, T. Terashima, M. Takano, K. Kadowaki, Z. Z. Li, and H. Raffy. Momentum anisotropy of the scattering rate in cuprate superconductors. Phys. Rev. B, 71(1):014517, 2005.