Transition to superdiffusive behavior in intracellular
actin-based transport
mediated by molecular motors
Abstract
Intracellular transport of large cargoes, such as organelles, vesicles or large proteins, is a complex dynamical process that involves the interplay of ATP-consuming molecular motors, cytoskeleton filaments and the viscoelastic cytoplasm. The displacements of particles or probes in the cell cytoplasm as a function of time are characterized by different (anomalous) diffusion regimes. We investigate here the motion of pigment organelles (melanosomes) driven by myosin-V motors in Xenopus laevis melanocytes using a high spatio-temporal resolution tracking technique. By analyzing the mean square displacement (MSD) of the obtained trajectories as a function of the time lag, we show that the melanosomes display a transition between subdiffusive to superdiffusive behavior. A stochastic theoretical model is introduced to generalize the interpretation of our data. Starting from a generalized Langevin equation that explicitly considers the collective action of the molecular motors we derive an analytical expression for the MSD as a function of the time lag, which also takes into account the experimental noise. By fitting our model to the experimental data we were able to discriminate the exponents that characterize the passive and active contributions to melanosome dynamics. The model also estimates the “global” motor forces correctly. In this sense, our model gives a quantitative description of active transport in living cells with a reduced number of parameters.
pacs:
87.16.-b, 87.16.Uv, 87.10.Mn, 87.80.Nj, 87.16.NnI Introduction
Molecular motors are responsible for the active transport of organelles and other cargoes along cytoskeleton tracks to their correct destination in the cytoplasm. Three different classes of molecular motors are involved in this task: dynein and kinesin motors, which transport cargoes toward the minus and plus ends of microtubules, respectively, and myosin motors, responsible for the transport along actin filaments toward the barbed end (reviewed in myo ). While properties of microtubule-dependent transport, considered to be responsible for long-distance transport, have been extensively studied in vivo Gross ; Levi ; BEL ; Gross2 , we still do not know important aspects of the properties and regulation of actin-dependent transport which are believed to support local, short-distance movement of cargoes in living cells LangAtk .
The cytoskeleton (CSK) is a crowded network of semiflexible linear protein polymers with a complex dynamics, that can exert forces and affect the rheology of cells Miz ; Bur . Particularly, F-actin network has no global directionality and consists on intercepting randomly distributed filaments Snider . The cytoskeleton, organelles, proteins and motors are part of the highly crowded cytoplasm where the transport of cargoes takes place.
Active (AMR) and passive (PMR) microrheolgy are two distinct approaches to study the mechanical properties of the intracellular environment Wai . While in AMR micrometer-sized embedded probe particles are manipulated by external fields and their displacement is measured, the spontaneous displacement fluctuations of probe particles is analyzed in PMR.
Recent studies using AMR and PMR have shown that the action of ATP-consuming molecular motors drives the system out of equilibrium. The violation of the fluctuation dissipation theorem (FDT) has been observed in an in vitro system consisting of a cross-linked actin network with embedded myosin motors Miz and also for beads attached to the cell membrane of human airway smooth muscle (HASM) cells Bur . Likewise, direct evidence of the deviation from equilibrium inside the cell has been recently obtained Wil ; Lau . In Ref.Wil both forced and spontaneous motions of magnetic microbeads engulfed by Dyctyostelium cells are analyzed to derive the power spectrum of forces acting on intracellular phagosomes. However, the theoretical model proposed to describe their data did not distinguish between active and passive contribution to the transport.
In most of PMR experiments it has been observed that the mean square displacement (MSD) of the probes displays a crossover between a subdiffusive and a superdiffusive regimes Metz ; Bru ; Kul ; Sal ; Gal ; Len ; Bur . The subdiffusive behavior is characterized by an exponent ranging from 0.2 Tre to Tseng ; Weiss while the superdiffusive behavior presents exponents close to 1.5 Bur ; Wil . Typically, the transition time between these two regimes is on the order of 1 s.
While some authors attribute the subdiffusive behavior to elastic trapping Tseng , obstruction Sax , crowding Ban or stalling Bur , others propose that apparent subdiffusion can arise from noise inherent to single particle tracking (SPT) experiments due to slight errors on the determination of the actual particle position Mart . Although there is not a general consensus of the causes of subdiffusion yet, it is well accepted that superdiffusion has its origin in the collective behavior of molecular motors Wil ; Lau ; Bur .
Properties of motor proteins have been well characterized in vitro but not in the viscous environment of a cell. Recently, pioneering works developed new techniques that allow to measure the forces exerted by molecular motors directly Sht ; Shub . In Ref. Sht motion enhanced differential interference contrast (MEDIC) movies of living NT2 (neuron-committed teratocarcinoma) cells at 37 C, was used to determine the force-velocity curves in vivo. In Ref. Shub the force that kinesin-1 exerts on lipid droplets in fly embryos, was measured using a novel development of optical traps that can be used to apply precise forces to moving droplets in vivo. Unexpected differences between motor regulation in vivo and in vitro were found, revealing that further investigation should be done in the field.
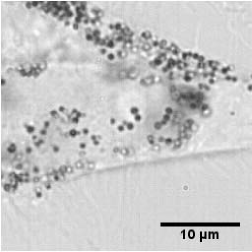
Melanophore cells are an exceptionally convenient model system to study intracellular transport driven by molecular motors Nasc , and thus to investigate some properties of out-of-equilibrium systems in living cells. Melanocytes have pigment organelles called melanosomes which are filled with the black pigment melanin. Then, they can be easily imaged using bright-field transmission light microscopy (Fig.1) and tracked with millisecond temporal resolution and nanometer precision Levi . Using a single particle tracking (SPT) technique Levi3 ; Gross , we follow the motion of myosin-V driven melanosomes along actin filaments and compute the MSD from the analysis of their trajectories.
Melanosomes are more or less spherical and stiff particles with sizes around 500 nm. Pigment organelles can be distributed in the cells in two configurations: either aggregated in the perinuclear region or homogeneously dispersed in the cytoplasm. The transport of pigment organelles during aggregation and dispersion is regulated by signaling mechanisms initiated by the binding of specific hormones to cell surface receptors horm . In a recent paper, we analyzed the MSD dependence with the time lag using an empirical model Bru . With the aid of numerical simulations, we concluded that the main difference between aggregation and dispersion condition was the average time the melanosome spends diffusing during the intervals between successive processive motions. As a consequence, active part of the transport would not be influenced by stimulation conditions.
In this work we explore an alternative and complementary approach to obtain quantitative information about the intracellular transport, that can be generalized to other biological data. Starting from a stochastic model that considers the viscoelasticity of the intracellular environment and the action of molecular motors explicitly, we derive an analytical expression for the MSD as a function of the time lag, which also takes into account the experimental noise. By fitting the logarithmic derivative of the MSD-versus-lag time to the experimental data we were able to discriminate the passive and active contributions to the melanosome dynamics. Experiments using cells expressing a dominant negative construct of myosin-V where melanosomes are not being actively transport by myosin-V, confirmed the robustness of the model. Furthermore, our approach enables us to quantitatively assess the motor forces correlation function, to estimate the magnitude of motor forces and to determine an effective diffusion coefficient by only using data coming from a PMR experiment.
II Materials and methods
II.1 Melanophore cell culture and transfection
Immortalized Xenopus laevis melanophores were cultured as described in Ref.Rog . In order to track the movement of individual organelles, the number of melanosomes in the cell was reduced by treatment with phenylthiourea Gross2 .
To study transport along actin filaments, the cells were incubated at 0∘C for 30 min with 10 M nocodazole to depolymerize microtubules Levi3 .
Melanophores were stimulated for aggregation or dispersion with 10 nM melatonin or 100 nM MSH, respectively. The samples were observed between 5 and 15 min after stimulation. All the measurements were performed at 21∘C.
Cells were transfected using the FuGENE 6 transfection reagent (Boehringer Mannheim Corp.) following the vendor’s protocols with a plasmid encoding a green fluorescent protein-tagged myosin-V tail. Expression of this plasmid results in a dominant-negative inhibition of myosin-V driven melanosome transport Rog2 . The plasmid was a kind gift of Dr. Vladimir Gelfand (Northwestern University, Chicago, IL)
II.2 Samples preparation for imaging
For microscopy measurements, cells were grown for 2 days on 25-mm round coverslips placed into 35-mm plates in 2.5 ml of the medium. Before observation, the coverslips were washed in serum-free 70% L-15 medium and mounted in a custom-made chamber specially designed for the microscope.
II.3 Tracking experiments
Single particle tracking experiments of melanosomes moving along actin filaments in wild type cells were carried out in a Zeiss IM 35 microscope adapted for SPT using a 63x oil-immersion objective (numerical aperture = 1.25) under illumination with a tungsten-halogen lamp. A CCD camera (PixelVision, Oregon, US) was attached to the video port of the microscope for imaging the cells. Movies were registered at a speed of 14 frames/s.
Tracking experiments of melanosomes in transfected cells were carried out in an Olympus IX70 microscope using a 60x water-immersion objective (numerical aperture = 1.2). A cMOS camera (Pixelink, Ottawa, Ontario, Canada) was attached to the video port of the microscope for imaging the cells at a speed of 50 frames/s.
Trajectories of melanosomes were recovered with 2 nm precision and 10 ms temporal resolution from the movies registered as described above using the pattern-recognition algorithm described in Levi2 . This algorithm is included in the program Globals for Images developed at the Laboratory for Fluorescence Dynamics (UCI, Irvine, CA). The program, which also contains some of the tools used for trajectory analysis, can be downloaded from the Laboratory for Fluorescence Dynamics website (www.lfd.uci.edu).
III Experiments
Melanophores were treated with nocodazole as described in Materials and Methods in order to depolymerize microtubules. After this treatment, aggregation and dispersion of melanosomes were induced by addition of melatonin and MSH, respectively. Movies of regions of the cells were recorded from which a total of 134 trajectories of melanosomes moving along actin filaments were obtained in aggregation and dispersion by using the pattern-recognition algorithm Levi2 .
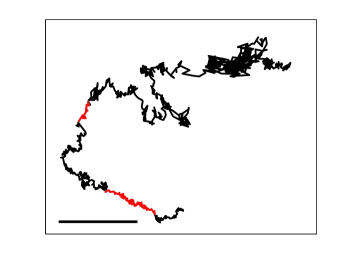
Figure 2 shows a representative trajectory of a myosin-V driven melanosome during dispersion. The tracks are noisy; however, periods of rectilinear motion can be distinguished from periods of random or diffusive behavior. Analysis of trajectories during the rectilinear segments gives a rough estimation of the speeds distribution that can be associated with the motor driven motion. We obtained a wide distribution for the speed that can be well described with a lognormal distribution with mean value nm/s and standard deviation of equal to Bru . These values are in agreement with the ones mentioned in the literature for myosin-V in vivo Snider . The noise of the experimental trajectories, quantified using a smoothing procedure was between and , which is much larger than the noise expected from the tracking method ( ) Mart .
The mean square displacement (MSD) for every trajectory is calculated as follows,
| (1) |
where x and y are the coordinates of the particle, is a lag time and the brackets represents the time average .
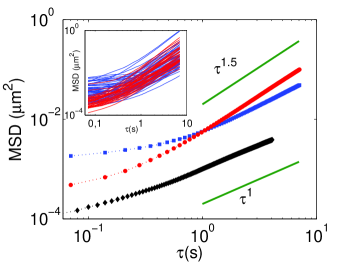
Figure 3 shows the average value of MSD obtained during dispersion and aggregation. The average distance traveled by the organelles during dispersion is significantly higher than during aggregation as was previously observed Snider ; Gross . For times larger than 1 second, the behavior presents anomalous diffusion with an exponent around 1.35.
The observation of a residual value of the MSD at (MSDo) suggests that transported melanosomes move in a constrained region with a dynamics faster than the temporal resolution of the tracking method. The presence of this jittering also results in an apparent subdiffusive behavior for short times scales Mart ; Diet2 .
We compute MSDo by linear extrapolation of the first four data points of each experimental MSD vs plot. The obtained MSDo values followed an exponential distribution, with characteristic value equal to for aggregation and for dispersion.
It is important to mention at this point that the MSD vs plots for the different trajectories present a wide distribution, principally related to the spreading of the MSDo values (see the inset in Fig.3). This observation was also found in other systems Wil ; Bur2 . In this sense, the ensamble average plot shown in Fig. 3 represents a poor estimator of the behavior of the driven particle. Instead, the logarithmic derivative of the MSD-versus-lag time , defined as Metz
| (2) |
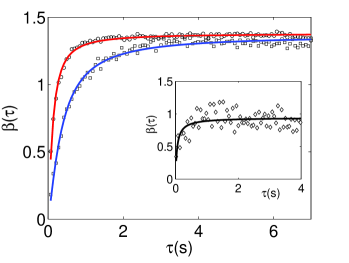
redounds on a more accurate magnitude to describe the dynamics of the transport. Figure 4 shows as a function of the time lag for the different experimental conditions.
In order to characterize the dynamical properties of melanosomes when they are not being actively transported by myosin-V, we transfected Xenopus melanophores cells with a plasmid encoding a green fluorescent protein-tagged myosin-V tail. Since this mutant of myosin-V cannot attach to actin filaments, expression of this plasmid results in a dominant-negative inhibition of myosin-V driven melanosome transport Rog2 . The MSD was calculated for every trajectory and the average behavior is shown in Fig. 3. We also analyzed the value of MSD obtained by extrapolation at s for the dominant-negative cells and verified that the MSDo values obtained followed a Gaussian distribution with mean and . These values are in agreement with the ones expected according to the error of the tracking method Mart ; Bru .
IV Theoretical model
In this section we apply the quantitative stochastic model introduced in an accompanying theoretical paper BD . We consider the diffusive behavior of a melanosome of mass , immersed in the intracellular medium and simultaneously driven by molecular motors. For this purpose, we describe the resulting dynamics by means of the generalized Langevin equation (GLE)
| (3) |
where is the dissipative memory kernel that characterizes the viscoelastic properties of the cytoplasm. The random force is assumed to be the sum of two uncorrelated contributions
| (4) |
being the internal noise due to thermal activity, while is an external random force representing the action of the molecular motors.
The thermal noise is a zero-centered and stationary random force with correlation function
| (5) |
and is related to the memory kernel via the fluctuation-dissipation theorem Zwa
| (6) |
where is the absolute temperature, and is the Boltzmann constant. This internal noise is the responsible for the passive transportation. To reproduce the subdiffusive behavior due to the viscoelastic properties of the cytoplasm, the noise autocorrelation function (5) can be modeled as a power-law powerlaw
| (7) |
where , is a proportionality coefficient, is set to 1 s., and is the Gamma function.
On the other hand, the random force is not related to the memory kernel because it stems from the activity of the molecular motors. The irreversible conversion of chemical energy from ATP hydrolysis into the particle motion via the activity of myosin-V motors drive the system to an out-of-equilibrium situation. As a consequence, the FDT is no longer valid.
Assuming that the actin network has no global directionality, the random force exerted by the action of the myosin-V motor is chosen as a zero-centered one. Moreover, in recent experiments it was observed that the forces power spectrum exhibits a power law behavior Lau ; Bur ; Wil ; Gal . Then, we assume that the autocorrelation function
| (8) |
can be written as BD
| (9) |
where , is a proportionality coefficient and is set to 1 s.
Considering that the average melanosome diameter is 500 nm Rog , its density is 1.2 g/ml Sha and Ns/m (see Refs. in Yam ), the characteristic time would be s. Then, from an experimental point of view, the inertial effects can be neglected. In this situation, the temporal evolution of the displacement can be obtained from (3), which is given by
| (10) |
where is the deterministic initial position of the particle. The relaxation function is the inverse form of the Laplace transform
| (11) |
where is the Laplace transform of the dissipative memory kernel.
To obtain an analytical expression of the MSD it is necessary to calculate the two-time position correlation. Starting from Eq. (10) and using relation (6), it can be written as
| (12) |
where the involved relaxation functions are given by
| (13) | |||||
| (14) |
only depends on the internal noise, while is related to both internal and external contributions.
Using the autocorrelation functions (7) and (9), the involved relaxation functions can be written as
| (15) | |||||
| (16) | |||||
| (17) |
where
| (18) |
is a dimensionless parameter that measures the relative intensity among the motors forces and the thermal forces.
For the integral term of (12) can be explicitly evaluated. In this case, it can be demonstrated that the MSD long time limit
| (19) |
can be written as BD
where
| (21) |
is a positive constant and . The two-dimensional situation is considered by the factor 4.
It is worth mentioning that, although , when the MSD (LABEL:msdanomal) exhibits a crossover from a subdiffusive regime with an exponent , to a superdiffusive regime with an exponent BD . The first term of (LABEL:msdanomal) represents the passive transport of the melanosome in the viscoelastic medium, while the second one corresponds to the contribution of the random force and is originated in the activity of the myosin-V motors.
Finally, to compare the analytical expression (LABEL:msdanomal) with the experimental data obtained using SPT techniques, it is necessary to take into account the error on the particle position determination. As is established in Refs.Mart ; Diet , the effect of an uncorrelated noise of variance -generated by measurement errors in particle location or by biological activity- is to add a constant to the mean square displacement. Then, the given in (LABEL:msdanomal) rewrites as
| (22) |
As it was previously discussed, the corresponding local slope of the MSD-versus-lag time (2) is a better function to characterize the dynamics. From (LABEL:msdanomal) and (22) we get
where
| (24) |
In particular, setting in Eq. (IV) one gets
| (25) |
which corresponds to the absence of active transport case.
V Results and Discussion
In this paper we study the motion of 500 nm melanosomes in Xenopus laevis melanophores treated with nocodazole (a microtubule depolymerizer), where the active transport is powered by the actin-dependent motor myosin-V. Aggregation and dispersion of melanosomes were induced by the addition of melatonin and MSH, respectively.
The MSD of melanosomes in both stimulation conditions displayed a transition from a subdiffusive to a superdiffusive regime and the corresponding local slope of the MSD-versus-lag time was well described by Eq. (IV), as shown in Fig.4.
Four parameters characterize the behavior: , , and , where and are the power law exponents of the internal and external noise correlation functions, is a parameter that measures the relative intensity between random forces and is associated with the residual value of the MSD as .
| aggregation | ||||
| dispersion | ||||
| mutant m-V | - | - |
The parameters , , and obtained from the fitting shown in Fig.4 are displayed in Table 1. The power-law exponents and for both dispersing and aggregating melanosomes were similar ( and ). These values lead to an asymptotic exponent , which is a signature of superdiffusion. Similar values were obtained in other systems Tre ; Wil ; Gal ; Bur . On the other hand, the obtained value implies a power spectrum of fluctuating motor forces that scales as , corresponding to a smoothing of discontinuities in instantaneous force pulses, as was stated in Refs. Wil ; Bur .
It is worth pointing out that with our model we are able to discriminate the contributions of internal and external forces in a straightforward fashion. In a recent paper Wil , Wilhelm described the dynamics of forced motions of magnetic microbeads in Dictyostelium cells in terms of a generalized Langevin equation. However, differently of what we have done in this paper, that model considers a single force term which included contributions of both thermal Brownian forces and driving forces generated by molecular motors. The force correlation function followed a power-law behavior with exponent 0.8, which is between the values of and obtained by us.
Melanosomes in cells expressing a dominant-negative myosin-V construct, and thus not being actively transported by myosin-V, show spontaneous motion and the MSD displays a subdiffusive behavior. In the absence of motors, Eq. (IV) rewrites in terms of and (Eq. (25)). Interestingly, we obtained a value for , very similar to the one obtained in the presence of active motors. This reinforces our hypothesis that is the parameter that characterizes the subdiffusive motion of the melanosomes in the cytoplasm. Therefore, our model allows us to discriminate between passive and active contributions to the motion. In both cases (i.e. in the presence and in the absence of active motors), is close to 1. Similar values were obtained for the subdiffusive anomalous exponent of tracer proteins in highly concentrated random-coil polymer and globular protein solutions that mimic the crowded conditions encountered in cellular environments Ban , and for the anomalous diffusion of dextran polymers inside HeLa cells Weiss .
Typically, the anomalous diffusion regime is characterized by fitting an empirical power-law relationship to the MSD dependence with of the form Bru ; Bur2 ; Rau :
| (26) |
being an effective diffusion coefficient and an exponent between 0 and 2. Notice that with this definition has units of distance square.
Likewise, we can define the effective diffusion coefficient for a subdiffusive and a superdiffusive limit regimes in our model. In the first case, setting and in (LABEL:msdanomal), we have that
| (27) |
In the superdiffusive limit, setting in Eq. (LABEL:msdanomal) we obtain
| (28) |
where we have used relation (24) to derive this expression.
Interestingly, these analytical expressions enable a quantitative interpretation of the physics underlying the transport processes, linking the macroscopic effective diffusion coefficient with microscopic parameters derived from the forces correlation functions.
In Ref. Bru we obtained the values of by fitting the MSD-vs-time lag plot of each trajectory with the empirical expression given by Eq. (26). The distributions of followed an exponential behavior, with mean values equal to and for aggregation and dispersion conditions, respectively.
Using (28) and the parameters displayed in Table 1 to compute the analytical effective diffusion coefficient, we obtained and , for aggregation and dispersion, respectively. These values are consistent with the ones obtained empirically.
For mutant cells, the computed analytical effective diffusion coefficient (27) is , which is in agreement with the one obtained in Ref. Bru ()
Moreover, the correlation function (9) allows obtaining an estimation for the magnitude of the “global” force exerted by the motors , which is given by
| (29) |
Using definitions (18) and (24), rewrites as
| (30) |
Taking , MSDo and , and from Table I, we obtain and , for dispersion and aggregation, respectively, which are in the order of the reported stall force of a single myosin-V stall . The values obtained for aggregation and dispersion are similar within the experimental error, since as far as we know the stall forces for myosin in these stimulation conditions are expected to be the same.
VI Summary
The violation of the FDT in living cells has been observed in recent studies Bur ; Lau ; Wil ; Gal . Motor proteins, which are force generators in cells, can not only modify the viscoelastic response of the cytoplasm -as is the case of CSK motors-, but they also generate non-thermal random forces which drive the system out of equilibrium Lau . The action of motors is generally reflected in a transition between a subdiffusive to a superdiffusive behavior of the displacement of particles within the cells Bur .
To investigate how the action of molecular motors affects the transport in living cells, we study the motion of melanosomes driven by myosin-V along the F-actin network in Xenopus laevis melanocytes.
Differently to other microrheology experiments reported before Bur ; Lau ; Wil ; Gal ; Miz , we adopt a different approach which uses a generalized Langevin equation that explicitly considers the collective action of the molecular motors and the presence of experimental/biological noise. The analytical solution of the model is obtained and an expression for the slope of the MSD vs the time lag is derived explicitly. The comparison between the model solution and the experimental data is straightforward, and involves 4 parameters. Two of these parameters are the exponents of the thermal and non-thermal forces correlation functions, while the others are related with the relative intensity between both kind of forces and the residual value of the MSD.
On one hand, the model predicts the observed crossover between subdiffusive to superdiffusive regimes, as well as it gives good estimates for the in vivo motor forces. On the other hand, the proposed method enables us to determine a link between the macroscopic effective diffusion coefficient and the parameters in the microscopic scale.
We believe that this theoretical approach can be used to describe the dynamics of intracellular transport of different cargoes in other living cells.
Acknowledgements.
We acknowledge support from grants PICT 928/06, PICT 31980/05 and PICT 31975/05 from Agencia Nacional de Promoción Científica y Tecnológica, Argentina.References
- (1) R. Mallik and S.P. Gross, Curr. Biol. 14, R971 (2004); R. D. Vale, Cell 112, 467 (2003).
- (2) S. P. Gross, M.A. Welte, S. M. Block and E. F. Wieschaus, J. Cell Biol. 148, 945 (2000).
- (3) V. Levi, A. S. Serpinskaya, E. Gratton and V. I. Gelfand, Biophys. J. 90, 318 (2006).
- (4) L. Bruno, M. M. Echarte and V. Levi, Cell Biochem. and Biophys. 52, 191 (2008).
- (5) S. P. Gross, M.C. Tuma, S.W. Deacon, A.S. Serpinskaya, A.R. Reilein and V. I. Gelfand, J. Cell Biol. 156, 855 (2002).
- (6) G. M. Langford, Traffic 3, 859 (2002); S. J. Atkinson, S. K. Doberstein and T.D. Pollard, Curr. Biol. 2, 326 (1992).
- (7) D. Mizuno, C. Tardin, C. F. Schmidt and F. C. MacKintosh, Science 315, 370 (2007).
- (8) P. Bursac, G. Lenormand, B. Fabry, M. Oliver, D. A. Weitz, V. Viasnoff, J. P. Butler and J. J. Fredberg, Nat. Mater. 4, 557 (2005).
- (9) J. Snider, F. Lin, N. Zahedi, V. Rodionov, C.C. Yu, and S.P. Gross, Proc. Natl. Acad. Sci. U S A 101, 13204 (2004).
- (10) See T. A. Waigh, Rep. Prog. Phys. 68, 685 (2005) and reference therein.
- (11) A. W. C. Lau, B. D. Hoffman, A. Davies, J. C. Crocker, and T. C. Lubensky, Phys. Rev. Lett 91, 198101 (2003).
- (12) C. Wilhelm, Phys. Rev. Lett 101, 028101 (2008).
- (13) M. Brunstein, L. Bruno, M. A. Desp sito and V. Levi, submmited.
- (14) F. Gallet, D. Arcizet, P. Bohec and A. Richert, arXiv:0901.3087 (2009).
- (15) C. Metzner, C. Raupach, D. Paranhos Zitterbart, and B. Fabry, Phys. Rev. E 76, 021925 (2007).
- (16) I. M. Kulic, A. E. X. Brown, H. Kim, C. Kural, B. Blehm, P. R. Selvin, P. C. Nelson, and V. I. Gelfand, Proc. Natl. Acad. Sci. U S A 105, 10011 (2008).
- (17) H. Salman, Y. Gil, R. Granek, and M. Elbaum, Chem. Phys. 284, 389 (2002).
- (18) G. Lenormand, J. Chopin, P. Bursac, J. J. Fredberg, and J. P. Butler, Biochem. and Biophys. Res. Comm. 360, 797 (2007).
- (19) X. Trepat, G. Lenormand, and J. J. Fredberg, Soft Matter 4, 1750 (2008).
- (20) Y. Tseng, T. P. Kole, and D. Wirtz, Biophys. J. 83, 3162 (2002).
- (21) M. Weiss, M. Elsner, F. Kartberg, and T. Nilssony, Biophys. J. 87, 3518 (2004).
- (22) M. J. Saxton, Biophys. J. 86, 369 (2004); M. J. Saxton, Biophys. J. 92, 1178 (2007).
- (23) D. S. Banks and C. Fradin, Biophys. J. 89, 2960 (2005).
- (24) D. S. Martin, M. B. Forstner, and J. A. Käs, Biophys. J. 83, 2109 (2002).
- (25) G. T. Shubeita, S. L. Tran, J. Xu, M. Vershinin, S. Cermelli, S. L. Cotton, M. A. Welte, and S. P- Gross, Cell 135, 1098 (2008)
- (26) Y. Shtridelman, T. Cahyuti, B. Townsend, D. DeWitt and J. C. Macosko, Cell Biochem. Biophys. 52(1), 19 (2008).
- (27) A. A. Nascimento, J. T. Roland, and V. I. Gelfand, Annu. Rev. Cell Dev. Biol. 19, 469 (2003).
- (28) V. Levi, V. I. Gelfand, A. S. Serpinskaya, and E. Gratton, Biophys. J 90, L7 (2006).
- (29) M. M. Rozdzial, and L. T. Haimo, Cell 47, 1061 (1986); P. J. Sammak, S. R. Adams, A. T. Harootunian, M. Schliwa, and R. Y. Tsien, J. Cell Biol. 117, 57 (1992).
- (30) S. L. Rogers, I. S. Tint, P.C. Fanapour, and V. I. Gelfand, Proc. Natl. Acad. Sci. U S A 94, 3720 (1997).
- (31) S. L. Rogers, R. L. Karcher, J. T. Roland, A. A. Minin, S. W., and V. I. Gelfand. J. Cell Sci. 146, 1265 (1999).
- (32) V. Levi, A. S. Serpinskaya, E. Gratton, and V. I. Gelfand, Biophys. J. 90, 318 (2006).
- (33) C. Dietrich, B. Yang, T. Fujiwara, A. Kusumi, and K. Jacobson, Biophys. J. 82, 274 (2002).
- (34) P. Bursac, B. Fabry, X. Trepat, G. Lenormand, J. P. Butler, N. Wang, J. J. Fredberg and S. S. An, Biochem. and Biophys. Res. Comm. 355, 324 (2007).
- (35) L. Bruno and M. A. Despósito, arXiv:0904.2133v1 [physics.bio-ph].
- (36) R. Zwanzig, Nonequilibrium Statistical Mechanics (Oxford Univ. Press, New York, 2001).
- (37) K. G. Wang, Phys. Rev. A 45, 833 (1992); E. Lutz, Europhys. Lett. 54, 293 (2001); A. D. Viñales and M. A. Despósito, Phys. Rev. E 73, 016111 (2006).
- (38) S. Sharma, S. Wagh, and R. Govindarajan, Pigment Cell Res. 15, 127 (2002).
- (39) S. Yamada, D. Wirtz, and S. C. Kuo, Biophys. J. 78, 1736 (2000).
- (40) P. Dieterich, R. Klages, R. Preuss and A. Schwab, Proc. Natl. Acad. Sci. U S A, 105 , 459 (2008).
- (41) C. Raupach, D. Paranhos Zitterbart, C. Mierke, C. Metzner, F.A. Muller, and B. Fabry, Phys. Rev. E 76, 011918 (2007).
- (42) G. Cappello, P. Pierobon, C. Symonds, L. Busoni, J. Christof, M. Gebhardt, M. Rief, and J. Prost, Proc. Natl. Acad. Sci. U S A 104, 15328 (2007); A. E. M. Clemen, M. Vilfan, J. Jaud, J. Zhang, M. Bärmann, and M. Rief, Biophys. J. 88, 4402 (2005).