Magnetic Coupling in the Quiet Solar Atmosphere
Abstract
Three kinds of magnetic couplings in the quiet solar atmosphere are highlighted and discussed, all fundamentally connected to the Lorentz force. First the coupling of the convecting and overshooting fluid in the surface layers of the Sun with the magnetic field. Here, the plasma motion provides the dominant force, which shapes the magnetic field and drives the surface dynamo. Progress in the understanding of the horizontal magnetic field is summarized and discussed. Second, the coupling between acoustic waves and the magnetic field, in particular the phenomenon of wave conversion and wave refraction. It is described how measurements of wave travel times in the atmosphere can provide information about the topography of the wave conversion zone, i.e., the surface of equal Alfvén and sound speed. In quiet regions, this surface separates a highly dynamic magnetic field with fast moving magnetosonic waves and shocks around and above it from the more slowly evolving field of high-beta plasma below it. Third, the magnetic field also couples to the radiation field, which leads to radiative flux channeling and increased anisotropy in the radiation field. It is shown how faculae can be understood in terms of this effect. The article starts with an introduction to the magnetic field of the quiet Sun in the light of new results from the Hinode space observatory and with a brief survey of measurements of the turbulent magnetic field with the help of the Hanle effect.
1 The magnetic field of the quiet Sun
Over the past three and a half years, the Sun stayed in a minimum state of magnetic activity as it has ended cycle 23 and is about to start with cycle 24 (if not pausing for yet a longer period of time). In this period of quiescence it was possible to observe the Sun with an exceptional instrument, the Solar Optical Telescope SOT onboard the Hinode space observatory (Kosugi et al. 2007). The Japanese Hinode satellite was put in orbit on September 22, 2006. It is not so much the spatial resolution of 0.3′′ that makes this instrument exceptional for quiet-Sun observing, but rather the absence of seeing in combination with high pointing accuracy. This allows for unprecedented “deep” (long-exposure) polarimetry with correspondingly high polarimetric sensitivity at a spatial resolution of 0.3′′. A similar polarimetric accuracy at this high spatial resolution has not been achieved from the ground in the past.
Immediately evident in the total or circular polarization maps over a large field of view from Hinode (Lites et al. 2008) is the magnetic network, which persisted existing during the most quiet states of the Sun. The magnetic network consists of an accumulation of magnetic fields in the borders between supergranular cells. The origin of these magnetic fields remains an enigma. Is it the result of advection by the supergranular flow to which it is often described, or, vice versa, is the supergranular flow rather a consequence of the existence of the magnetic network (R. Stein, private communication)? Is the network field generated locally, near the surface, or is it an integral part of the globally acting dynamo (Stein et al. 2003), or is it just the decay product of sunspots and/or ephemeral active regions?
Also omnipresent in this quiescent state of the Sun are small-scale magnetic field concentrations, visible as delicate, bright objects within and at vortices of intergranular lanes. The structure made up of ensembles of bright elements is known as the filigree (Dunn & Zirker 1973). Mehltretter (1974), while observing in the visible continuum, referred to them as facular points because they are the footpoints of magnetic field concentrations that appear as faculae near the solar limb. In more recent times, these objects were mostly observed in the G band (a technique originally introduced by Muller 1985) because the molecular band-head of CH that constitutes the G band, acts as a leverage for the intensity contrast (Rutten 1999; Rutten et al. 2001; Sánchez Almeida et al. 2001; Steiner et al. 2001; Shelyag et al. 2004). Being located in the blue part of the visible spectrum, this choice also helps improving the diffraction-limited spatial resolution and the contrast in the continuum. Recent observational investigations of the dynamics, morphology and properties of small-scale magnetic field concentrations of the quiet Sun include Berger et al. (2004); Langhans et al. (2004); Lites & Socas-Navarro (2004); Sánchez Almeida et al. (2004); Socas-Navarro & Lites (2004); Wiehr et al. (2004); Rouppe van der Voort et al. (2005); Domínguez Cerdeña et al. (2006a, b); Berger et al. (2007); Bovelet & Wiehr (2007); Centeno et al. (2007); Ishikawa et al. (2007); Langangen et al. (2007); Martínez González et al. (2007); Orozco Suárez et al. (2007); Rezaei et al. (2007a, b); Tritschler et al. (2007); Bello González & Kneer (2008); Bello González et al. (2008); de Wijn et al. (2008); Orozco Suárez et al. (2008); Bello González et al. (2009) and references therein. It would be interesting to learn to which degree the abundance of small-scale magnetic field concentrations persists in a grand minimum, to find out more about their origin.
With the help of the spectropolarimeter of the Solar Optical Telescope (SOT) onboard Hinode it became for the fist time possible to reliably determine the transversal (with respect to the line-of-sight) magnetic field component of the quiet Sun. These measurements indicate that, seen with a spatial resolution of 0.3′′, the quiet internetwork regions harbor a photospheric magnetic field whose mean field strength of its horizontal component considerably surpasses that of the vertical component (Lites et al. 2007, 2008; Orozco Suárez et al. 2007). According to these papers, the vertical fields are concentrated in the intergranular lanes, whereas the horizontal fields occur most commonly at the edges of the bright granules, aside from the vertical fields. Lites et al. (2008) determine for the horizontal field component a mean apparent field strength (averaged over a large field of view including network and internetwork regions) of 55 G, while the corresponding mean absolute vertical field strength was only 11 G. Harvey et al. (2007) find from recordings with GONG and SOLIS at moderate angular resolution a “seething magnetic field” with a line-of-sight component increasing from disk center to limb as expected for a nearly horizontal field orientation. It is reasonable to assume that the horizontal fields of Lites et al. (2008) and those of Harvey et al. (2007) are different manifestations of the same magnetic field. Ishikawa et al. (2008) detected transient horizontal magnetic fields in plage regions as well. Previously, Lites et al. (1996) and Meunier et al. (1998) reported observations of weak and strong horizontal fields in quiet Sun regions.
The anisotropy of the quiet-Sun magnetic field as revealed by the Hinode measurements is not necessarily in contradiction with the observed depolarization of scattered light through the Hanle effect. For the quantitative interpretation of the Hanle effect it was customarily assumed in the past that the quiet Sun magnetic field was “turbulent” in the sense that it was isotropically distributed on the scales relevant for the analysis. Theories have now been developed to include distribution functions for the field strength and angular directions (see, e.g., Carroll & Kopf (2007), Sampoorna et al. (2008), Sampoorna (2009)) for a better description of the turbulent magnetic field in radiation transfer and first steps are taken to use such formulations for the computation of the Hanle effect in scattering media (Frisch 2006; Nagendra et al. 2009).
The isotropy assumption may still be valid on scales smaller than 0.3′′. In fact, simulations suggest constant angular distribution within from the horizontal direction on a scale of . On the other hand, should the field be strongly anisotropic on all scales, it would still produce Hanle depolarization but its interpretation would be less straightforward. From a theoretical point of view, the anisotropy of the magnetic field comes not as a surprise, and homogeneous turbulence of the magnetic field seems unlikely since the convective flow is far from homogeneously turbulent given the scale size of 1000 km of granules vs. the pressure scale height of 100 km.
Stenflo (1982) roughly estimated the strength of the weak turbulent magnetic field based on the Hanle technique between 10 and 100 G. This range was narrowed to 4–40 G by Stenflo et al. (1998). More precise estimates by Faurobert-Scholl (1993) and Faurobert-Scholl et al. (1995) yielded values in the range of 30 to 60 G in the deep photosphere and 10 to 20 G in the middle and upper photosphere, where the latter values were increased to 20 to 30 G by Faurobert et al. (2001). The values reported by Stenflo et al. and by Faurobert et al. are not without controversy, however. Trujillo Bueno et al. (2004) find from three-dimensional radiative transfer modelling of scattering polarization in atomic and molecular lines an ubiquitous tangled magnetic field with an average strength of 130 G around 300 km height in the photosphere, which is much stronger in the intergranular than in the granular regions. They estimate that the energy density of this field would amount to 20% of the kinetic energy density of the convective motion at a height of 200 km. If this high value is correct it also indicates that the Zeeman measurements with Hinode (Lites et al. 2007, 2008; Orozco Suárez et al. 2007) have not captured quite all of the existing quiet-Sun fields, presumably because of polarimetric cancellation which Zeeman measurements are subject to in contrast to Hanle measurements. Adopting the idealized model of a single-valued microturbulent field, Trujillo Bueno et al. (2004) obtained a mean field strength that varies between 50 to 70 G in the height range from 400 km to 200 km, respectively, and only when taking an exponential probability density function for the field-strength distribution into account do they obtain the higher value of 130 G. Relatively high values are also reported by Bommier et al. (2005).
More in line with Faurobert et al. are Shapiro et al. (2007), who obtain from differential Hanle measurements with the CN violet system a field strength in the range from 10 to 30 G in the upper solar photosphere, while the analyses of the observed scattering polarization in C2 lines by Faurobert & Arnaud (2003) and Berdyugina & Fluri (2004) imply a field strength of about 10 G. However measurements of the scattering polarization in molecular lines may be quite sensitive to the thermal structure in the atmosphere. In fact Trujillo Bueno et al. (2004) obtain from measurements with C2 a field strength of the order of 10 G too, but they also show that these measurements sample the atmosphere mainly above granules only, where, correspondingly, the turbulent field must be much weaker than in the downflows of the intergranular space (see the review by Trujillo Bueno et al. (2006) for a detailed presentation of their Hanle-effect measurements).
In any case, it seems that “deep” polarimetric measurements with Hinode have discovered a large part of the hitherto “hidden” magnetic field that was known to us only through Hanle measurements. It made this field accessible to Zeeman analysis and therefore to a more reliable determination of its angular distribution, at least down to spatial resolution. In the next chapter, we review results from recent simulation that aim at explaining the predominance of the mean horizontal over the mean vertical field in the quiet-Sun photosphere.
2 Coupling of convection with magnetic fields
It was mentioned in the previous chapter that a few observational studies prior to Hinode already hinted at a frequent occurrence of horizontally oriented magnetic fields in the quiet Sun. Likewise, the horizontal fields did not come unannounced to theoretical solar physics. Grossmann-Doerth et al. (1998) noted “we find in all simulations also strong horizontal fields above convective upflows”, and Schaffenberger et al. (2005, 2006) found frequent horizontal fields in their three-dimensional simulations, which they describe as “small-scale canopies”. Also the three-dimensional simulations of Abbett (2007) display “horizontally directed ribbons of magnetic flux that permeate the model chromosphere”, not unlike the figures shown by Schaffenberger et al. (2006). However, these reports did not receive wide attention because actual measurement of the weak transversal component was not possible or unreliable prior to the advent of Hinode.
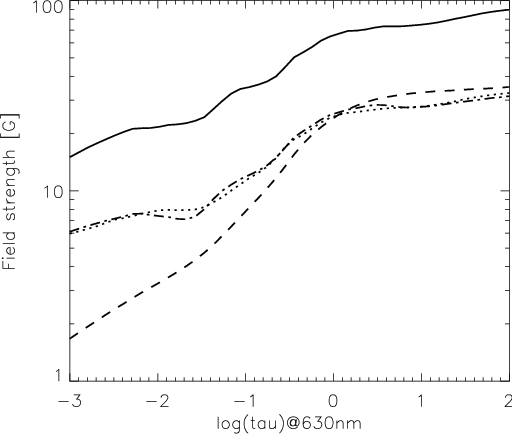
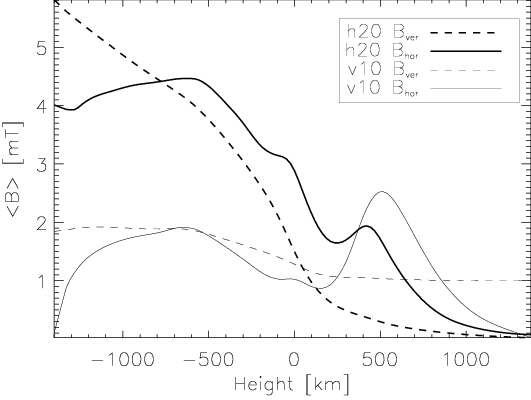
More recently and after the discovery of the horizontal field with Hinode, two theoretical works (Schüssler & Vögler (2008) and Steiner et al. (2008)) specifically aimed at finding out more about its nature and origin. Both papers present results of three-dimensional magnetohydrodynamic numerical simulations of the internetwork magnetic field with regard to the intrinsically produced horizontal magnetic field. In the following I briefly summarize and compare part of their results.
The two simulation runs presented by Steiner et al. (2008) and the “local dynamo run” of Schüssler & Vögler (2008) differ substantially in their initial and boundary conditions for the magnetic field. Yet, they all show a clear dominance of the horizontal field in parts or the full height range where the spectral lines used for the Hinode observations are formed. Thus, the intrinsic production of a predominantly horizontal magnetic field in the photosphere of three-dimensional magnetohydrodynamic simulations is a rather robust result. Figure 1 shows the horizontal and the vertical magnetic field strengths as a function of height in the atmosphere of the three simulations. Left and right boundaries of the left panel correspond to approximately km and km of the right panel, respectively. Note that the scale of the ordinate is logarithmic and in gauss in the left panel but linear and in mT in the right panel. Also account for the non-linear relation between the abscissa of the two panels. Interestingly, both simulation runs of Steiner et al. (2008) show a local maximum of the horizontal field component near 500 km height and this is also the case for a local dynamo run when the top (open) boundary is located at km (M. Schüssler private communication).
How do these results compare with Hinode? For a fair comparison it is indispensable to synthesize the Stokes profiles of the 630 nm Fe I spectral line pair from the simulations and subsequently derive whatever parameters were derived from the actual observations. The analysis of the synthetic data must proceed in the very same manner as done with the observed profiles. Applying the appropriate point spread function (Wedemeyer-Böhm 2008) to the synthetic profiles and subjecting them to the same procedure for conversion to apparent flux densities as done by Lites et al. (2008) for the observed profiles, Steiner et al. (2008) obtain spatial and temporal averages for the transversal and longitudinal apparent magnetic flux densities, and of respectively 21.5 G and 5.0 G for run h20 and 10.4 G and 6.6 G for run v10. Thus, the ratio for h20 and for v10. Lites et al. (2008) obtain from Hinode SP data G and G resulting in . Run v10 was judged to rather reflect network fields because of its preference to produce vertically directed, unipolar magnetic fields, enforced by its initial and boundary conditions. For the internetwork field, h20 is more appropriate. Correspondingly, the -value of h20 better agrees with the measurements of Lites et al. (2008), which measures mainly internetwork magnetic fields. It should be cautioned that is quite dependent on spatial resolution in the sense that lower resolution overestimates this value. The reason for this behavior is that horizontal fields have a more patchy, smoother, and less intermittent character than the vertical fields and are therefore less subject to polarimetric cancellation.111Remember that polarimetric cancellation also occurs for independent field components of the horizontal field when they are perpendicular to each other within a single pixel area. Polarimetric cancellation occurs for horizontal fields in the same way as for vertical fields – transversal perpendicular fields lead to polarimetric cancellation just as antiparallel longitudinal fields do. For a comparison between synthetic and observed center-to-limb data see Steiner et al. (2009).

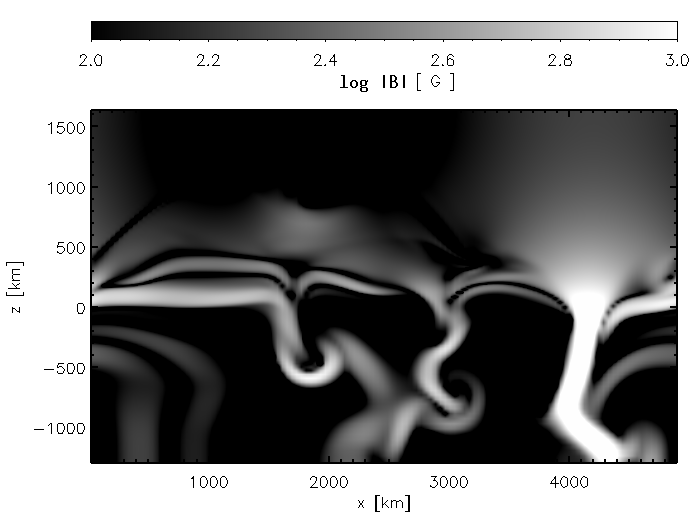
What kind of physical process produces the horizontal fields? Schüssler & Vögler (2008) and Steiner et al. (2008) offer two different but not necessarily exclusive explanations. Rather they emphasize two different aspects of the coupling of convection with magnetic fields that is at the origin of the horizontal fields. Steiner et al. (2008) emphasize the aspect of the flux expulsion process (Weiss 1966; Galloway & Weiss 1981), which describes the expulsion of magnetic field from the interior of an eddy flow like that of granules. Thus, the fact that the magnetic field tends to be located in the intergranular space and not within granules is considered a consequence of the flux expulsion process. However it should be noted that the granular flow is not bounded alone by intergranular lanes but also by the overlaying photosphere, which efficiently damps overshooting flow owing to its superadiabatic stratification. Hence, magnetic field tends not only to be expelled in the lateral direction to the intergranular lanes but also in the vertical direction, where it accumulates in the upper photosphere and lower chromosphere. In fact, vertical sections through the computational domain such as Fig. 1 of Schüssler & Vögler (2008) and Fig. 3 of Schaffenberger et al. (2005) show magnetic voids where the granular flow is most vigorous as a consequence of the flux expulsion process. The voids are arched by horizontally directed magnetic field. This can be nicely seen in the close-up shown in Fig. 2.

Schüssler & Vögler (2008) emphasize the aspect from the local dynamo that operates in the convectively unstable layers beneath the surface of continuum optical depth unity. Near the surface, weak magnetic field gets quickly stretched and thus amplified by the convective flow, in particular also by the small-scale turbulent flow of intergranular downflows.222There is nothing mystic about this amplification, which is a natural consequence of the field being tied to the plasma in (quasi) ideal MHD, which does work against the Lorentz force on the expense of kinetic energy. However, Vögler & Schüssler (2007) were able to demonstrate that a local dynamo operates in these layers, which means that a magnetic field of constant mean energy density is maintained without the need of continuous supply of a weak (seed) field. It even survives when downflows continuously pump magnetic field out of the simulation box. On the other hand, in the convectively stable photosphere above, the flows become weaker and field amplification rapidly drops with height. Thus, the magnetic field in the photosphere and its decay with height is mainly determined by the field distribution at the surface , in particularly by its energy spectrum as a function of horizontal wave number, which in turn is determined by the turbulent dynamo beneath this surface. This results in a steep decline of the absolute vertical magnetic flux with height as can be seen from Fig. 3. While many loops of small scales (where the energy spectrum is maximal) contribute to the vertical flux in the deep photosphere, fewer loops of large scales (where the energy is less) add to it in the higher layers. On the other hand, this configuration leads to a less steep decline of the horizontal field and hence, the mean horizontal field strength starts to dominate the mean absolute vertical field strength as a function of height. In this picture the dominance of the horizontal field component is a natural outcome of the dynamo-generated field.
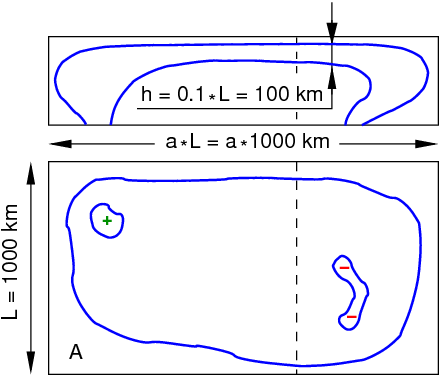
It was argued in the course of this conference by J.O. Stenflo that a predominance of the horizontal field over the vertical one was in contradiction with the solenoidality condition for the magnetic field. Leaving aside that the simulations strictly maintain solenoidality and still show a predominance of the horizontal over the vertical component, Fig. 4 provides another counter example to this conjecture. Assume that within an area of granular size there are two vertical flux concentrations of, say G, that occupy an area of , where . The two flux concentrations of opposite polarity are connected by a photospheric, solenoidal arch of thickness as it occurs in simulations (viz. the “small-scale canopies” of Schaffenberger et al. (2005)). Then flux conservation demands that in a cross section of the loop (as the one indicated by the dashed line) , where is the vertical field strength at and the strength of the horizontal field of the arch. It follows that . With we obtain G. When the horizontal field of the arch fills about of the area , we obtain a mean horizontal field of G while G. The ratio can be made arbitrarily large by increasing , i.e., by stretching the arch.
Confusion may arise because of misinterpreting transversal Zeeman measurements as being a measure of magnetic flux. It is true that for longitudinal Zeeman measurements, the measured mean flux density is directly proportional to the magnetic flux (disregarding polarimetric cancellation effects for now). Such a generalization is not valid for the transversal Zeeman effect, where the mean flux density is an average value over an area that is not perpendicular but parallel to the measured field component. In this case the apparent flux density is a spatially averaged flux density, not more. Assuming that the horizontal field has the vertical extent of the atmospheric scale height, , with a filling factor of 1, then the horizontal magnetic flux is , where is the scale of the field of view. The vertical flux is and consequently, using flux conservation . On granular scales , which again suggests that the predominance of the apparent horizontal flux density over the vertical one is a direct consequence of the anisotropic nature of convective turbulence in the highly stratified atmosphere of the Sun, where the granular scale is ten times larger than the pressure scale height. However, remember that this calculation does not apply to subgranular scales at which the field may still be isotropic.
3 Coupling of waves with magnetic fields
Acoustic waves are generated and emitted by the convectively unstable layers beneath the solar surface (). They couple to the magnetic field when they enter the atmospheric layers above. Such coupling can be seen to take place in Fig. 5, which shows a time instant of a two-dimensional simulation. Starting from a state where a magnetic flux concentration has formed at approximately km (left panel), a plane-parallel, monochromatic acoustic wave is introduced at the bottom of the computational domain (right panel), which propagates within a time span of about 200 s across the non-stationary atmosphere – from the convection-zone, km, through the photosphere, km, into the magnetically dominated chromosphere, km, where it gets partially refracted and reflected by interaction with the magnetic field.
The perturbation of the wave front in the convection zone in Fig. 5 is not due to the presence of a magnetic field, but rather to the vigurous intergranular downflows and associated temperature deficit. However, as soon as the wave front enters the magnetically dominated atmosphere where , coupling with the magnetic field kicks in and part of the wave gets primarily magnetically driven. ( is the ratio of magnetic to thermal pressure.) The major effects of this interaction are that (i) the wave front speeds up since the Alfvén velocity becomes the characteristic speed, which sharply increases with height when magnetic pressure drops less quickly than the gas pressure, and (ii) the waves refract because of the inhomogeneous magnetic field, defining an inhomogeneous refractive index for the magneto-acoustic wave.
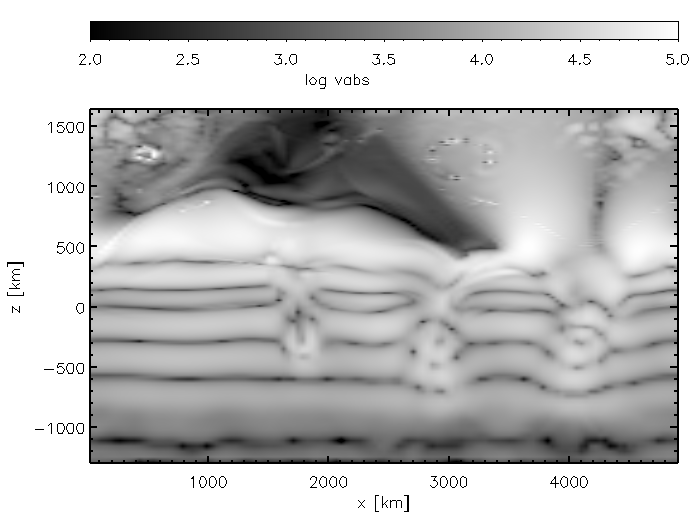
When measuring the wave travel time between two fixed geometrical height levels in the atmosphere (representing the formation height of two spectral lines) we observe a decrease at locations of strong magnetic field concentrations because of (i). Moreover, due to (ii) the wave behaves like evanescent because of the strong refraction that effectively leads to a reflection of the wave. Therefore, the wave travel time betrays the presence of the magnetic field concentration and it can be used to map the topography of the magnetic field in the solar atmosphere. In fact, this effect was employed by Finsterle et al. (2004) in order to obtain the three-dimensional topography of the “magnetic canopy” in and around active regions by determining the travel time of high-frequency acoustic waves in the solar chromosphere. Steiner et al. (2007), from where Fig. 5 is derived from, demonstrated with the help of numerical experiments that wave travel-times can indeed serve this purpose.
The theory and theoretical aspects of magneto-acoustic waves in a gravitationally stratified atmosphere, sometimes called magneto-acoustic-gravity (MAG) waves or magneto-atmospheric waves, have received much attention in recent years. Pioneering works include those of Thomas (1982) and Zhugzhda & Dzhalilov (1982); Zhugzhda & Dzhalilov (1984a, b, c). Shibata (1983) carried out initial numerical computer experiments with magneto-atmospheric waves. In more recent times, Rosenthal et al. (2002) and Bogdan et al. (2003) published two comprehensive papers on the subject. These works include several numerical experiments with non-uniform magnetic field equilibria in a two-dimensional, stratified atmosphere. They recognized and highlighted the role of refraction of fast magnetic waves and the role of the surface of equal Alfvén and sound speed as a wave conversion zone. Aiming at applications in local helio-seismology, Cally (2005) derives gravito-magneto-acoustic dispersion relations and then uses these to examine how acoustic rays entering regions of strong field split into fast and slow components and the subsequent fates of each. Cally (2007) presents the theory in a particularly instructive manner. Results from numerical simulations of MAG-wave propagation in three-dimensional space are presented by Cally & Goossens (2008) and Moradi et al. (2009).
Khomenko & Collados (2006) carried out numerical simulations of magneto-acoustic wave propagation in sunspots and found that the fast (magnetic) mode in the region where does not reach the chromosphere but reflects back to the photosphere due to wave refraction, caused primarily by the vertical and horizontal gradients of the Alfvén speed. For small-scale flux-tubes, Khomenko et al. (2008b) find that deep horizontal motions of the flux tube initially generate a slow (magnetic) mode and a surface mode that are efficiently transformed into a slow (acoustic) mode when the magnetic field starts to dominate. This slow mode propagates vertically along the magnetic field remaining always within the flux tube, where it steepens to a shock. Only a small part of the driver energy is returned to the photosphere by the fast magneto-acoustic mode. Khomenko et al. (2008a) demonstrate that photospheric five-minute oscillations can leak into the chromosphere inside small-scale vertical magnetic flux tubes as a consequence of radiative damping, which leads to a significant reduction of the cutoff frequency and they provide observational evidences of this effect. This effect is not to be confounded with the “ramp effect” (Cally 2007), which lowers the cutoff frequency when the flux tube is inclined with respect to the gravitational acceleration (Suematsu 1990; Jefferies et al. 2006). Both these works of Khomenko et al. suggest that vertical magnetic field concentrations play an essential role in coupling the dynamics of the photosphere to the chromosphere through efficient channeling and conversion of magneto-acoustic waves.
Figure 6 demonstrates the complexity of magneto-acoustic wave propagation in a magnetically structured, stratified atmosphere. A magnetic flux sheet (two-dimensional) of a strength of 1600 G at its base (where ) is shifted to the right in the transverse direction with a single impulse of 12 s duration and a maximal velocity of 0.75 km/s. As a consequence of this sudden movement, four types of waves emanate from the base of the flux sheet: (i) a fast (magnetic) wave in the low- regime of the flux-sheet interior, visible in the middle panel, (ii) a slow (acoustic) wave that propagates along the magnetic field within the flux sheet, visible in the left panel, (iii) a fast acoustic wave that propagates spherically into the ambient medium, visible in the right panel, and (iv) a slow magnetic wave that propagates in the boundary layer of the flux sheet. The predominantly acoustic waves show an antisymmetric pattern with respect to the sheet axis because of the movement to the right, which causes a compression at the leading edge and a decompression at the trailing edge of the flux sheet. However, as the slow wave propagates it becomes asymmetric (not visible in Fig. 6). On the left side the wave crest quickly steepens into a shock because of being preceded by a wave trough. On the right side the inverse sequence causes the wave to spread, which impedes at first the development of a shock.
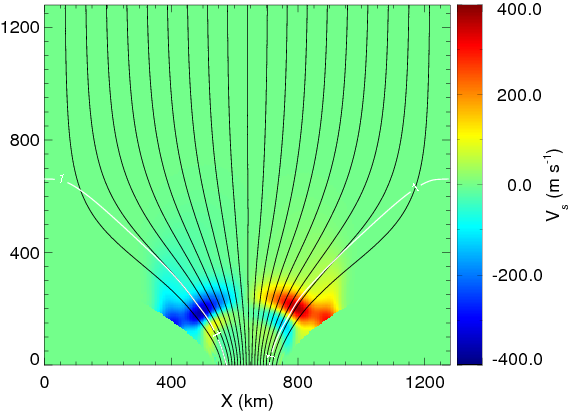
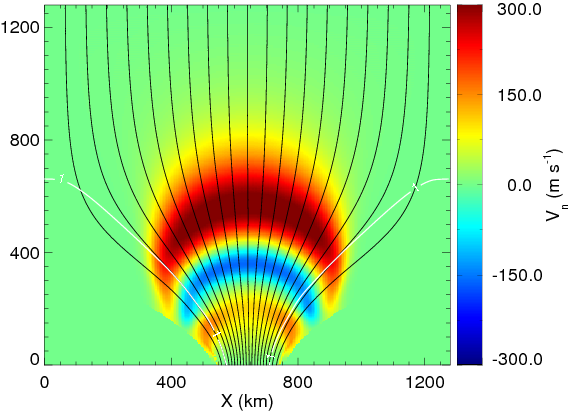
The shape of the fast (magnetic) wave becomes crescent (middle panel) because of the non-uniform Alfvén speed. As the tips of the crescents move essentially sideways, they enter the low- periphery of the flux sheet where they convert to predominantly acoustic (fast) and therefore become visible in (right panel) as the wing like feature that extends in the vertical direction. From a rough estimate of the acoustic energy flux generated by such impulsive transverse motions, Vigeesh et al. (2009) conclude that this flux would hardly balance the chromospheric energy requirements in the network. Previously, similar numerical experiments with impulsive and periodic driving have been carried out by Hasan et al. (2005) and Hasan & van Ballegooijen (2008).
Until here we have considered the coupling of waves with intense, small-scale magnetic flux concentrations like they occur in network and plage regions. The numerical experiments mentioned above, all make use of highly idealized wave drivers: typically a monochromatic transversal or longitudinal periodic motion, or a single impulsive motion is imposed on an initially static equilibrium configuration. Certainly for the internetwork, such quasi static states are unrealistic. Furthermore, magnetic flux concentrations in the intergranular lanes of the internetwork attain typically hectogauss not kilogauss field strength and they rather connect with the omnipresent horizontal field than vertically extending into the chromosphere. In this case, the strength of the internetwork field can be expected to exponentially decrease with height like the gas pressure and the density do, so that the magnetic field would not become dominant in the upper layers of the photosphere and the chromosphere and consequently no substantial coupling between waves and the magnetic field would occur in these layers. On the other hand if there is a predominance of one magnetic polarity, part of the magnetic flux can be expected to connect to the outer solar atmosphere or to a region of opposite polarity further away, in which case the field strength would decrease less steeply leading to in the chromosphere (but not yet in the photosphere). How do waves couple to the magnetic field under these circumstances?
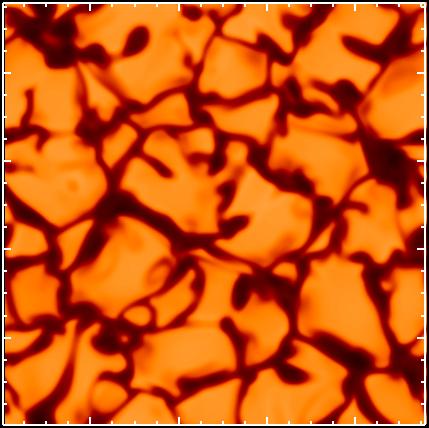
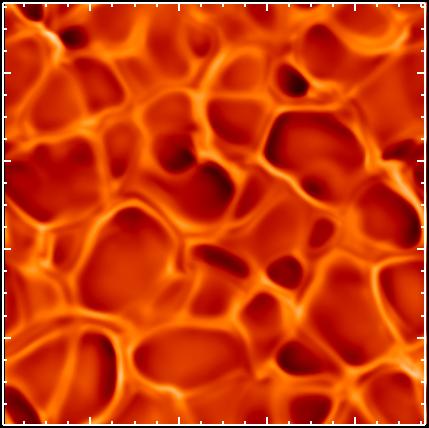

First to the waves. Figure 7 shows the temperature in three horizontal cross sections through the computational domain of 9.6 Mm side length. At 200 km below the surface we see the cool intergranular lanes and hot granules (left panel), at km the hot intergranular lanes and cool granules of the inverse granulation (seen a bit higher up in spectroscopic quantities). Both these patterns evolve on roughly the granular time scale. In the cross section at km we see a totally different pattern that evolves on a much shorter time scale and is due to shock waves that have formed at this height range and travel in all directions, forming a network of hot material. This shock-wave pattern that emerges from acoustic waves, which are generated by the convective granular motion at the base of the atmosphere was first shown to exist in three-dimensional simulations without magnetic field by Wedemeyer et al. (2004). It leads to large fluctuations in the tenuous atmosphere above the classical temperature minimum, to a veritable “fluctosphere” (Wedemeyer-Böhm et al. 2008), earlier termed the “clapotisphere” by Rutten & Uitenbroek (1991) and Rutten (1995) with regard to peak fluctuations caused by the interference of (shock-)waves.
In combination with magnetic fields, these disturbances give rise to a rich variety of magneto-acoustic wave phenomena. As detailed above, the gas pressure in the gravitationally stratified atmosphere may drop more quickly with height than the magnetic energy density does, giving rise to a height range where sound speed and Alfvén speed are of similar magnitude. Within this region, which forms a corrugated surface excursive over a wide height range in the three-dimensional atmosphere, propagating wave modes change nature from acoustic to magnetic and from slow to fast and vice versa. Above this surface there is a predominant tendency for magnetic modes to get refracted and reflected due to the dispersive nature of the inhomogeneous magnetic field.
Schaffenberger et al. (2005) have simulated this case with a field of a predominant polarity of constant mean net vertical flux density 10 G. Their three-dimensional simulation domain encompasses a height range from km to km (where zero corresponds to ). Immediately apparent from a movie that shows the field strength (http://www.kis.uni-freiburg.de/~steiner/vsec.mov) is that the surface of (where ) separates a region of highly dynamic magnetic fields with fast moving magnetosonic waves and shocks around and above it from the more slowly evolving field of high-beta plasma below it. This surface is located at roughly 1000 km in this case. It is corrugated and its local height strongly varies in time over a range of about 1000 km.
The magnetic field in the chromosphere of this simulation continuously rearranges itself on a time scale of less than 1 min, much shorter than in the photosphere or in the convection-zone layers. The field has a strength between 2 and 40 G. Different from the surface magnetic field, it is more homogeneous and fills practically the entire space so that the magnetic filling factor in the top layer is close to unity. There seems to be no spatial correlation between chromospheric flux accumulations and the small-scale field concentrations in the photosphere. Magnetoacoustic waves that form transient filaments of stronger than average magnetic field are a ubiquitous phenomenon in the chromosphere. They form in the compression zone downstream and along propagating shock fronts. These magnetic filaments that have a field strength rarely exceeding 40 G, rapidly move with the shock fronts and quickly form and dissolve with them. Hence, the coupling of waves with the magnetic field leads to a continuous agitation of the magnetic field in the chromosphere by shock waves. It is not yet clear what the significance and the consequences of these perturbations are, especially in view of electro-magnetic dissipation processes.
4 Coupling of radiation with magnetic fields
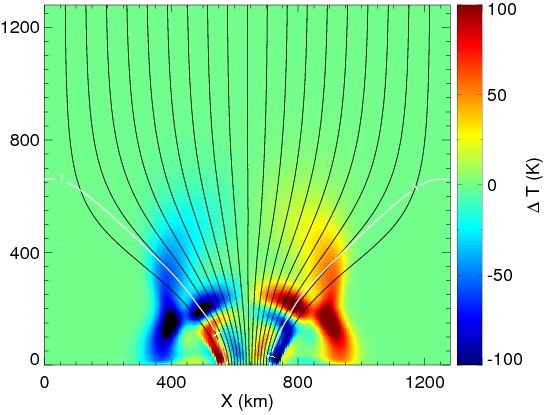
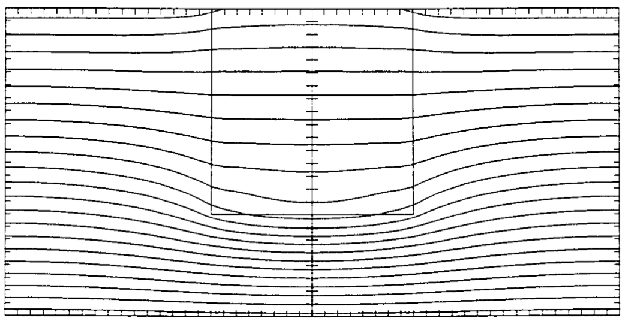
The radiative flux in the solar atmosphere couples to the magnetic field not only microscopically (changing polarization state) but also macroscopically through modification of the gas pressure and density by the magnetic field. The magnetic field has an energy density, , often called the magnetic pressure, like gas pressure has: . The ratio of the two is . In locations where , magnetic pressure substitutes gas pressure in the transversal direction, which at the same time lowers the material density (given thermodynamic equilibrium) and with it the opacity. Hence, as a rule of thumb, opacity is lower where the magnetic field is strong, which leads to a redirection of the radiative flux. This effect was called “flux channeling” by Cannon (1985), because the net radiative flux, which is strictly vertical and outwardly directed in a plane parallel stellar atmosphere, becomes partially and laterally redirected in the presence of a strong, vertically directed magnetic flux concentration. In radiative equilibrium this effect leads to a temperature perturbation in the sense that the temperature is slightly enhanced in the surface layers of the magnetic flux concentration but lowered in the deep layers as is shown in Fig. 8.
The coupling of the radiation field to the magnetic field via the channeling effect introduces a substantial anisotropy in the radiation field at the location of a magnetic flux concentration and in its surroundings. This anisotropy gives rise to the facular phenomenon.
Faculae can be explained in terms of the “hot wall model” (Spruit 1976). In this model the hot wall corresponds to the wall of the depression that is caused by a magnetic flux concentration, like the Wilson depression of a sunspot. The wall separates the magnetic flux concentration from the surrounding, practically field-free plasma. However, the term “hot wall” may be misleading as it is by far not as hot as the plasma in the same height range in the unperturbed ambient atmosphere. In fact, the rectangular wall of the low-opacity region of the radiative equilibrium model shown in Fig. 8 has in most parts a lower temperature. In the case of photospheric magnetic flux concentrations the temperature of the wall is determined by a delicate balance between radiative losses and the convective energy supply, where the latter is actually reduced in the transverse direction close to the flux concentration because the magnetic field acts like a solid wall to plasma motion in this direction. Equilibrium models and magnetohydrodynamic simulations, however, invariably show a bright edge where the wall of the “Wilson depression”, merges with the horizontal surface (Carlsson et al. 2004; Keller et al. 2004; Steiner 2005; De Pontieu et al. 2006). Seen at an oblique angle (corresponding to an observation off disk center) this “hot edge” leads to a characteristic center-to-limb variation in contrast.
It was only recently realized when analyzing high resolution filtergrams of faculae from the Swedish Solar Telescope (SST) that their contrast enhancement extends quite a distance in the limbward direction, typically for half a granular size, which is much further than the depth of the depression wall would possibly be (Lites et al. 2004; Hirzberger & Wiehr 2005). Berger et al. (2007) measure an average radial width of faculae of 400 km. This means that the contrast enhancement of faculae extends beyond the depression proper in the limbward direction. The reason for this behavior is explained with the help of Fig. 9 as follows.
[width=0.4]steiner_fig09.png
A material parcel located in the solar atmosphere lateral to a magnetic flux concentration “sees” a more transparent atmosphere in the direction toward the flux concentration as compared to a direction under equal zenith angle but pointing away from it because of its rarefied atmosphere. Consequently, from a wide area surrounding the magnetic flux concentration, radiation escapes more easily in the direction towards the flux sheet so that a single flux concentration impacts the radiative escape in a cross-sectional area that is much wider than the magnetic field concentration proper. This means that the presence of a magnetic flux concentration introduces an anisotropy in the radiation field such that when observed close to the limb, a granule limbward of (seen across) the flux concentration appears brighter than normal. Hence, a facula is not to be identified with bright plasma that sticks, as the name may insinuate, like a torch out of the solar surface. Rather is it the manifestation of photospheric granulation, seen across a magnetic flux concentration – granulation that appears brighter than normal in the form of so called “facular granules”.
Another consequence of the flux channeling effect is an enhancement of radiative loss from the solar surface at the location of the small-scale magnetic flux concentration. One could say that magnetic flux concentrations add a roughness to the solar surface that increases its effective area and thus increases the radiative loss from it. Therefore, the coupling between radiation and magnetic field, and with it faculae, play a key role in the solar irradiance variation over a solar cycle and on shorter time scales (Fligge et al. 2000; Wenzler et al. 2005; Foukal et al. 2006; Krivova & Solanki 2008).
5 Conclusion
Results obtained with the spectropolarimeter of the Solar Optical Telescope onboard the Hinode space observatory have greatly extended our knowledge of the magnetism of the quiet Sun. It has now become apparent that virtually every location on the surface of the Sun harbors magnetic field that can be detected in the 630 nm Fe I spectral line via the Zeeman effect, exceeding a noise level of 0.6 G and 20 G for the longitudinal and transversal magnetic field, respectively (Lites et al. 2008). At the scale of , this magnetic field has a preferential direction, which is parallel to the solar surface, i.e., it is anisotropic. It seems now that Hinode has discovered the majority of the hitherto “hidden” magnetic field that was known to us only through Hanle measurements, and it made it accessible to Zeeman analysis.
The predominantly horizontal direction of the weak internetwork magnetic field is also a robust result of magnetohydrodynamic simulations of the surface layers of the Sun. It can be explained in terms of the coupling between magnetic field and convective plasma motion. Two aspects of this interaction are evident. First, the process of flux expulsion, which displaces magnetic field from eddy cells. It leads to a concentration of predominantly vertical fields in the interganular lanes and predominantly horizontal fields in the stable layers above and at the edges immediately adjacent to granules. Second, the turbulent dynamo, which operates in the top surface layers of the convection zone, leads in the adjacent, stably stratified photospheric layer to a multi-scale system of magnetic loops. This loop system naturally leads to a stronger decline with height of the vertical than of the horizontal component of the magnetic field, hence, to a predominance of the horizontal fields in the height range where the spectral lines used for the Hinode observations are formed. It is still a matter of future research to find out to which degree the internetwork magnetic field is due to the turbulent surface dynamo, the remnants of pre-existing magnetic flux of active regions, and the emergence of magnetic flux from the deep convection zone, or due to yet other, additional sources. Also the role of the horizontal field in the heating of the chromosphere, e.g., by Ohmic dissipation of associated current sheets, needs yet to be clarified.
The study of the propagation of magnetoacoustic waves in a magnetically structured, stratified atmosphere is a relatively new field of research. It has applications in magnetoatmospheric seismology, for example, when determining the topography of the magnetic canopy by measuring wave travel times in the photosphere and chromosphere. The surface defined by equality between sound speed and Alfvén speed is a zone of mode conversion. It separates the magnetically dominated tenuous region of fast moving magnetic modes and magnetic shock waves from the more slowly evolving atmosphere beneath it. The strong gradients in the Alfvén speed of a magnetically structured atmosphere lead to refraction and reflection of the magnetically driven modes. Future research in this field is directed at improving diagnostics for magnetoatmospheric seismology. Measurement and theory of magnetoatmospheric wave propagation need to be improved and linked for a reliable interpretation and exploitation of observations. The role of wave mode conversion and the channeling of slow modes in magnetic flux concentrations for the heating of the outer atmosphere must yet be quantified.
Magnetic flux concentrations lead to radiative flux channeling and increased anisotropy in the radiation field. Faculae can be understood in terms of this effect, which is apparent from magnetohydrodynamic simulations in two and three spatial dimensions. Future research in this field should include a thorough statistical analysis of (synthetic) faculae of three-dimensional simulations in order to understand the role of magnetic field stength, size, shape, etc., for the center-to-limb behavior of the facular contrast and for the energy balance of faculae. The latter is crucial for a better understanding of solar radiance variability.
Acknowledgements.
I am grateful to Ch. Nutto, S. Wedemeyer-Böhm, and G. Vigeesh for help with the figures, M. Schüssler and J. Trujillo Bueno for clarifications regarding the turbulent dynamo and Hanle depolarization, and Ch. Bethge, J. Bruls, R. Hammer, and Ch. Nutto for proofreading individual sections. This work was supported by German Academic Exchange Service (DAAD) grant D/05/57687.References
- Abbett (2007) Abbett, W. P. 2007, ApJ, 665, 1469
- Bello González & Kneer (2008) Bello González, N., Kneer, F. 2008, A&A, 480, 265
- Bello González et al. (2008) Bello González, N., Okunev, O., Kneer, F. 2008, A&A, 490, L23
- Bello González et al. (2009) Bello González, N., Yelles Chaouche, L., Okunev, O., Kneer, F. 2009, A&A, 494, 1091
- Berdyugina & Fluri (2004) Berdyugina, S. V., Fluri, D. M. 2004, A&A, 417, 775
- Berger et al. (2007) Berger, T. E., Rouppe van der Voort, L. H. M., Löfdahl, M. 2007, ApJ, 661, 1272
- Berger et al. (2004) Berger, T. E., Rouppe van der Voort, L. H. M., Löfdahl, M. G., et al. 2004, A&A, 428, 613
- Bogdan et al. (2003) Bogdan, T. J., Carlsson, M., Hansteen, V. H., et al. 2003, ApJ, 599, 626
- Bommier et al. (2005) Bommier, V., Derouich, M., Landi degl’Innocenti, E., Molodij, G., Sahal-Bréchot, S. 2005, A&A, 432, 295
- Bovelet & Wiehr (2007) Bovelet, B., Wiehr, E. 2007, Solar Phys., 243, 121
- Cally (2005) Cally, P. S. 2005, MNRAS, 358, 353
- Cally (2007) Cally, P. S. 2007, Astron. Nachrichten/AN, 328, 286
- Cally & Goossens (2008) Cally, P. S., Goossens, M. 2008, Solar Phys., 251, 251
- Cannon (1985) Cannon, C. J. 1985, The transfer of spectral line radiation, (Cambridge University Press, 1985)
- Carlsson et al. (2004) Carlsson, M., Stein, R. F., Nordlund, Å., Scharmer, G. B. 2004, ApJ, 610, L137
- Carroll & Kopf (2007) Carroll, T. A., Kopf, M. 2007, A&A, 468, 323
- Centeno et al. (2007) Centeno, R., Socas-Navarro, H., Lites, B., et al. 2007, ApJ, 666, L137
- De Pontieu et al. (2006) De Pontieu, B., Carlsson, M., Stein, R., et al. 2006, ApJ, 646, 1405
- de Wijn et al. (2008) de Wijn, A. G., Lites, B. W., Berger, T. E., et al. 2008, ApJ, 684, 1469
- Domínguez Cerdeña et al. (2006a) Domínguez Cerdeña, I., Sánchez Almeida, J., Kneer, F. 2006a, ApJ, 636, 496
- Domínguez Cerdeña et al. (2006b) Domínguez Cerdeña, I., Sánchez Almeida, J. S., Kneer, F. 2006b, ApJ, 646, 1421
- Dunn & Zirker (1973) Dunn, R. B., Zirker, J. B. 1973, Solar Phys., 33, 281
- Faurobert & Arnaud (2003) Faurobert, M., Arnaud, J. 2003, A&A, 412, 555
- Faurobert et al. (2001) Faurobert, M., Arnaud, J., Vigneau, J., Frisch, H. 2001, A&A, 378, 627
- Faurobert-Scholl (1993) Faurobert-Scholl, M. 1993, A&A, 268, 765
- Faurobert-Scholl et al. (1995) Faurobert-Scholl, M., Feautrier, N., Machefert, F., Petrovay, K., Spielfiedel, A. 1995, A&A, 298, 289
- Finsterle et al. (2004) Finsterle, W., Jefferies, S., Cacciani, A., Rapex, P., McIntosh, S. 2004, ApJ, 613, L185
- Fligge et al. (2000) Fligge, M., Solanki, S. K., Unruh, Y. C. 2000, A&A, 353, 380
- Foukal et al. (2006) Foukal, P., Fröhlich, C., Spruit, H., Wigley, T. M. L. 2006, Nat, 443, 161
- Frisch (2006) Frisch, H. 2006, A&A, 446, 403
- Galloway & Weiss (1981) Galloway, D. J., Weiss, N. O. 1981, ApJ, 243, 945
- Grossmann-Doerth et al. (1998) Grossmann-Doerth, U., Schüssler, M., Steiner, O. 1998, A&A, 337, 928
- Harvey et al. (2007) Harvey, J. W., Branston, D., Henney, C. J., Keller, C. U. 2007, ApJ, 659, L177
- Hasan & van Ballegooijen (2008) Hasan, S. S., van Ballegooijen, A. A. 2008, ApJ, 680, 1542
- Hasan et al. (2005) Hasan, S. S., van Ballegooijen, A. A., Kalkofen, W., Steiner, O. 2005, ApJ, 631, 1270
- Hirzberger & Wiehr (2005) Hirzberger, J., Wiehr, E. 2005, A&A, 438, 1059
- Ishikawa et al. (2008) Ishikawa, R., Tsuneta, S., Ichimoto, K., et al. 2008, A&A, 481, L25
- Ishikawa et al. (2007) Ishikawa, R., Tsuneta, S., Kitakoshi, Y., et al. 2007, A&A, 472, 911
- Jefferies et al. (2006) Jefferies, S. M., McIntosh, S. W., Armstrong, J. D., et al. 2006, ApJ, 648, L151
- Keller et al. (2004) Keller, C. U., Schüssler, M., Vögler, A., Zakharov, V. 2004, ApJ, 607, L59
- Khomenko et al. (2008a) Khomenko, E., Centeno, R., Collados, M., Trujillo Bueno, J. 2008a, ApJ, 676, L85
- Khomenko & Collados (2006) Khomenko, E., Collados, M. 2006, ApJ, 653, 739
- Khomenko et al. (2008b) Khomenko, E., Collados, M., Felipe, T. 2008b, Solar Phys., 251, 589
- Kosugi et al. (2007) Kosugi, T., Matsuzaki, K., Sakao, T., et al. 2007, Solar Phys., 243, 3
- Krivova & Solanki (2008) Krivova, N. A., Solanki, S. K. 2008, J. Astrophys. Astron., 29, 151
- Langangen et al. (2007) Langangen, Ø., Carlsson, M., Rouppe van der Voort, L., Stein, R. F. 2007, ApJ, 655, 615
- Langhans et al. (2004) Langhans, K., Schmidt, W., Rimmele, T. 2004, A&A, 423, 1147
- Lites et al. (2008) Lites, B. W., Kubo, M., Socas-Navarro, H., et al. 2008, ApJ, 672, 1237
- Lites et al. (1996) Lites, B. W., Leka, K. D., Skumanich, A., Martinez Pillet, V., Shimizu, T. 1996, ApJ, 460, 1019
- Lites et al. (2004) Lites, B. W., Scharmer, G. B., Berger, T. E., Title, A. M. 2004, Solar Phys., 221, 65
- Lites & Socas-Navarro (2004) Lites, B. W., Socas-Navarro, H. 2004, ApJ, 613, 600
- Lites et al. (2007) Lites, B. W., Socas-Navarro, H., Kubo, M., et al. 2007, PASJ, 59, 571
- Martínez González et al. (2007) Martínez González, M. J., Collados, M., Ruiz Cobo, B., Solanki, S. K. 2007, A&A, 469, L39
- Mehltretter (1974) Mehltretter, J. P. 1974, Solar Phys., 38, 43
- Meunier et al. (1998) Meunier, N., Solanki, S., Livingston, W. 1998, A&A, 331, 771
- Moradi et al. (2009) Moradi, H., Hanasoge, S. M., Cally, P. S. 2009, ApJ, 690, L72
- Muller (1985) Muller, R. 1985, Solar Phys., 100, 237
- Nagendra et al. (2009) Nagendra, K., Anusha, L., Sampoorna, M., Frisch, H. 2009, in Magnetic coupling between the interior and the atmosphere of the Sun, eds. S. Hasan & R. Rutten, this volume
- Orozco Suárez et al. (2008) Orozco Suárez, D., Bellot Rubio, L. R., del Toro Iniesta, J. C., Tsuneta, S. 2008, A&A, 481, L33
- Orozco Suárez et al. (2007) Orozco Suárez, D., Bellot Rubio, L. R., del Toro Iniesta, J. C., et al. 2007, ApJ, 670, L61
- Rezaei et al. (2007a) Rezaei, R., Schlichenmaier, R., Beck, C. A. R., Bruls, J. H. M. J., Schmidt, W. 2007a, A&A, 466, 1131
- Rezaei et al. (2007b) Rezaei, R., Steiner, O., Wedemeyer-Böhm, S., et al. 2007b, A&A, 476, L33
- Rosenthal et al. (2002) Rosenthal, C. S., Bogdan, T. J., Carlsson, M., et al. 2002, ApJ, 564, 508
- Rouppe van der Voort et al. (2005) Rouppe van der Voort, L. H. M., Hansteen, V. H., Carlsson, M., et al. 2005, A&A, 435, 327
- Rutten (1995) Rutten, R. J. 1995, in Helioseismology, ESA-SP, 376, 151
- Rutten (1999) Rutten, R. J. 1999, in Third Advances in Solar Physics Euroconference: Magnetic Fields and Oscillations, eds. B. Schmieder, A. Hofmann, & J. Staude, ASP Conf. Ser., 184, 181
- Rutten et al. (2001) Rutten, R. J., Kiselman, D., Rouppe van der Voort, L., Plez, B. 2001, in Advanced Solar Polarimetry – Theory, Observation, and Instrumentation, ed. M. Sigwarth, ASP Conf. Ser., 236, 445
- Rutten & Uitenbroek (1991) Rutten, R. J., Uitenbroek, H. 1991, Solar Phys., 134, 15
- Sampoorna (2009) Sampoorna, M. 2009, in Magnetic coupling between the interior and the atmosphere of the Sun, eds. S. Hasan & R. Rutten, this volume
- Sampoorna et al. (2008) Sampoorna, M., Nagendra, K. N., Frisch, H., Stenflo, J. O. 2008, A&A, 485, 275
- Sánchez Almeida et al. (2001) Sánchez Almeida, J., Asensio Ramos, A., Trujillo Bueno, J., Cernicharo, J. 2001, ApJ, 555, 978
- Sánchez Almeida et al. (2004) Sánchez Almeida, J., Márquez, I., Bonet, J. A., Domínguez Cerdeña, I., Muller, R. 2004, ApJ, 609, L91
- Schaffenberger et al. (2005) Schaffenberger, W., Wedemeyer-Böhm, S., Steiner, O., Freytag, B. 2005, in Chromospheric and Coronal Magnetic Fields, eds. D. E. Innes, A. Lagg, & S. A. Solanki, ESA-SP, 596
- Schaffenberger et al. (2006) Schaffenberger, W., Wedemeyer-Böhm, S., Steiner, O., Freytag, B. 2006, in Solar MHD: Theory and Observations, eds. J. Leibacher, R. F. Stein, & H. Uitenbroek, ASP Conf. Ser., 354, 345
- Schüssler & Vögler (2008) Schüssler, M., Vögler, A. 2008, A&A, 481, L5
- Shapiro et al. (2007) Shapiro, A. I., Berdyugina, S. V., Fluri, D. M., Stenflo, J. O. 2007, A&A, 475, 349
- Shelyag et al. (2004) Shelyag, S., Schüssler, M., Solanki, S. K., Berdyugina, S. V., Vögler, A. 2004, A&A, 427, 335
- Shibata (1983) Shibata, K. 1983, PASJ, 35, 263
- Socas-Navarro & Lites (2004) Socas-Navarro, H., Lites, B. W. 2004, ApJ, 616, 587
- Spruit (1976) Spruit, H. C. 1976, Solar Phys., 50, 269
- Stein et al. (2003) Stein, R. F., Bercik, D., Nordlund, Å. 2003, in Current Theoretical Models and Future High Resolution Solar Observations: Preparing for ATST, eds. A. A. Pevtsov & H. Uitenbroek, ASP Conf. Ser., 286, 121
- Steiner (1991) Steiner, O. 1991, A&A, 242, 290
- Steiner (2005) Steiner, O. 2005, A&A, 430, 691
- Steiner et al. (2001) Steiner, O., Hauschildt, P. H., Bruls, J. 2001, A&A, 372, L13
- Steiner et al. (2008) Steiner, O., Rezaei, R., Schaffenberger, W., Wedemeyer-Böhm, S. 2008, ApJ, 680, L85
- Steiner et al. (2009) Steiner, O., Rezaei, R., Schlichenmaier, R., et al. 2009, in Second Hinode Science Meeting: Beyond Discovery – Toward Understanding, eds. M. Cheung, B. Lites, T. Magara, J. Mariska, & K. Reeves, ASP Conf. Ser., in press
- Steiner et al. (2007) Steiner, O., Vigeesh, G., Krieger, L., et al. 2007, Astronomische Nachrichten/AN, 328, 323
- Stenflo (1982) Stenflo, J. O. 1982, Solar Phys., 80, 209
- Stenflo et al. (1998) Stenflo, J. O., Keller, C. U., Gandorfer, A. 1998, A&A, 329, 319
- Suematsu (1990) Suematsu, Y. 1990, in Progress of Seismology of the Sun and Stars, eds. Y. Osaki & H. Shibahashi, Lecture Notes in Physics, Springer, Berlin, 367, 211
- Thomas (1982) Thomas, J. H. 1982, ApJ, 262, 760
- Tritschler et al. (2007) Tritschler, A., Schmidt, W., Uitenbroek, H., Wedemeyer-Böhm, S. 2007, A&A, 462, 303
- Trujillo Bueno et al. (2006) Trujillo Bueno, J., Asensio Ramos, A., Shchukina, N. 2006, in Solar Polarization 4, eds. R. Casini & B. W. Lites, ASP Conf. Ser., 358, 269
- Trujillo Bueno et al. (2004) Trujillo Bueno, J., Shchukina, N., Asensio Ramos, A. 2004, Nat, 430, 326
- Vigeesh et al. (2009) Vigeesh, G., Hasan, S. S., Steiner, O. 2009, A&A, to be submitted
- Vögler & Schüssler (2007) Vögler, A., Schüssler, M. 2007, A&A, 465, L43
- Wedemeyer et al. (2004) Wedemeyer, S., Freytag, B., Steffen, M., Ludwig, H.-G., Holweger, H. 2004, A&A, 414, 1121
- Wedemeyer-Böhm (2008) Wedemeyer-Böhm, S. 2008, A&A, 487, 399
- Wedemeyer-Böhm et al. (2008) Wedemeyer-Böhm, S., Lagg, A., Nordlund, Å. 2008, Sp. Sci. Rev., 171
- Weiss (1966) Weiss, N. O. 1966, Royal Soc. London Proc. Series A, 293, 310
- Wenzler et al. (2005) Wenzler, T., Solanki, S. K., Krivova, N. A. 2005, A&A, 432, 1057
- Wiehr et al. (2004) Wiehr, E., Bovelet, B., Hirzberger, J. 2004, A&A, 422, L63
- Zhugzhda & Dzhalilov (1982) Zhugzhda, Y. D., Dzhalilov, N. S. 1982, A&A, 112, 16
- Zhugzhda & Dzhalilov (1984a) Zhugzhda, Y. D., Dzhalilov, N. S. 1984a, A&A, 132, 45
- Zhugzhda & Dzhalilov (1984b) Zhugzhda, Y. D., Dzhalilov, N. S. 1984b, A&A, 132, 52
- Zhugzhda & Dzhalilov (1984c) Zhugzhda, Y. D., Dzhalilov, N. S. 1984c, A&A, 133, 333