Electronic structure and magnetism of the diluted magnetic semiconductor
Fe-doped ZnO nano-particles
Abstract
We have studied the electronic structure of Zn0.9Fe0.1O nano-particles, which have been reported to show ferromagnetism at room temperature, by x-ray photoemission spectroscopy (XPS), resonant photoemission spectroscopy (RPES), x-ray absorption spectroscopy (XAS) and x-ray magnetic circular dichroism (XMCD). From the experimental and cluster-model calculation results, we find that Fe atoms are predominantly in the Fe3+ ionic state with mixture of a small amount of Fe2+ and that Fe3+ ions are dominant in the surface region of the nano-particles. It is shown that the room temperature ferromagnetism in the Zn0.9Fe0.1O nano-particles is primarily originated from the antiferromagnetic coupling between unequal amounts of Fe3+ ions occupying two sets of nonequivalent positions in the region of the XMCD probing depth of 2-3 nm.
pacs:
74.25.Jb, 71.18.+y, 74.72.Dn, 79.60.-iI Introduction
There is growing interest in diluted magnetic semiconductors (DMSs), where magnetic ions are doped into the semiconductor hosts, due to the possibility of utilizing both charge and spin degrees of freedom in the same materials, allowing us to design a new generation spin electronic devices with enhanced functionalities Furdyna ; Ohno . Theoretical studies on the basis of Zener’s - exchange model have shown that wide-gap semiconductors such as ZnO doped with transition metal are promising candidates for room temperature ferromagnetic DMSs Dietl . First-principle calculations by Sato and Katayama-Yoshida Katayama have also predicted that ZnO-based DMSs exhibit ferromagnetism using LSDA calculation. Subsequently a number of experiments on ZnO-based DMSs in bulk, thin film and nano-particle forms revealed ferromagnetic properties Tuan ; Ueda ; KVRao ; Schwartz ; Radovanovic ; Melon , and among them ZnO-based DMSs nano-particles have attracted much attention Mandal1 ; Mandal2 . Current interest in such magnetic nano-particle systems is motivated by unique phenomena such as superparamagnetism Kittle , quantum tunneling of magnetization Gunther and particularly magnetism induced by surface effects Garcia . In the nano-particle form, the structural and electronic properties are modified at the surface as a result of the broken translational symmetry of the lattice or dangling bond formation, giving rise to weakened exchange coupling, site-specific surface anisotropy, and surface spin disorder Sun ; Kodama . That is, the modification of the electronic structure at the surface of the nano-particles plays a crucial role in the magnetism of this system.
Recently, Karmakar . Karmakar have reported room temperature ferromagnetism in Fe-doped ZnO nano-particles in the proposed core/shell structure, where Fe2+ ions are situated mostly in the core and Fe3+ ions in the surface region. However, LSDA+U calculation Gopal has indicated the insulating antiferromagnetic state to be more stable than the ferromagnetic state for Fe-doped ZnO system. In view of the presence of Fe3+ ions as indicated by local magnetic probes such as electron paramagnetic resonance (EPR) and Mössbauer measurements, Karmakar . Karmakar have proposed that the presence of surface Zn vacancies that dope hole into the system will be more effective to stabilize the ferromagnetism in this system. However, the correlation between magnetic properties and electronic structure of the Fe-doped ZnO nano-particle semiconductors has not been clarified yet. Thus, investigation of the electronic structure of the Fe-doped ZnO nano-particles is critical to achieve better understanding of this type of nano-materials and to perform new material design. In this paper, we have investigated the electronic structure of Zn0.9Fe0.1O nano-particles using x-ray photoemission spectroscopy (XPS), vacuum ultraviolet and soft-x-ray resonant photoemission spectroscopy (RPES), x-ray absorption spectroscopy (XAS) and x-ray magnetic circular dichroism (XMCD). RPES is a convenient tool to obtain the Fe 3 partial density of states (PDOS) in the valence-band spectra Davis . By performing RPES in the Fe 3-3 core-excitation region, we have studied the electronic states in the surface region with a probing depth of 0.5 nm Lindau of the nano-particles utilizing the surface sensitivity of the technique. On the other hand, RPES in the Fe 2-3 core-excitation region is more bulk sensitive with a probing depth of 1.5-2.0 nm Lindau and enables us to study the electronic structure in both the core and surface regions of the nano-particles. XAS and XMCD, whose probing depth are 2-3 nm, enable us to study the element specific electronic structure of the Zn0.9Fe0.1O nano-particles. In particular, XMCD is a powerful tool to study element-specific local magnetic states. Based on our experimental results, we shall discuss the origins of the ferromagnetic properties and magnetic interactions in the Zn0.9Fe0.1O nano-particles.
II Experiment
Zn0.9Fe0.1O nano-particles were prepared by the chemical pyrophoric reaction technique. Structural characterization was carried out using x-ray diffraction and transmission electron microscopy (TEM), demonstrating a clear nano-crystal phase. As observed by TEM, the average particle size was around 7 nm with the particle size distribution of 3.0-30.0 nm. Magnetization measurements on the same samples revealed a ferromagnetic-to-paramagnetic transition temperature 450 K. Details of the sample preparation were described in Ref. [18]. We measured a pressed pellet sample, which after grinding had been calcined at 350 . The ferromagnetic moment per Fe as deduced from the SQUID magnetization data was 0.05 B at room temperature Karmakar . XAS and XMCD measurements were performed at the Dragon Beamline BL11A of National Synchrotron Radiation Research Center (NSRRC) in the total-electron-yield (TEY) mode. The monochromator resolution was 10000 and the circular polarization of x-rays was 55 %. XPS measurements using the photon energy of = 1253.6 eV were performed at BL23-SU of SPring-8. RPES measurements in the Fe 2-3 and 3-3 core-excitation regions were performed at BL23-SU of SPring-8 and at BL-18A of Photon Factory (PF), respectively. For the photoemission measurements, all binding energies (B) were referenced to the Fermi level (F) of the sample holder which was in electrical contact with the sample. The total energy resolutions of the XPS and RPES measurements were 400 meV and 170 meV, respectively. All the experiments were performed at room temperature.
III Results and discussion
Figure 1 shows the Fe 2 core-level XPS spectrum of the Zn0.9Fe0.1O nano-particles in comparison with those of -Fe2O3 (Fe3+) Graat , FeO (Fe2+) Graat and Fe3O4 (Fe3+-Fe2+ mixed-valence) Fujii . The Fe 23/2 peak of the Zn0.9Fe0.1O nano-particles is split into two peaks at B 710 eV and 708 eV, corresponding to the energy positions of -Fe2O3 and FeO. The XPS spectrum of the Zn0.9Fe0.1O nano-particles therefore reflects an Fe3+-Fe2+ mixed-valent state of the Fe ions in agreement with the previous Mössbauer report Karmakar .
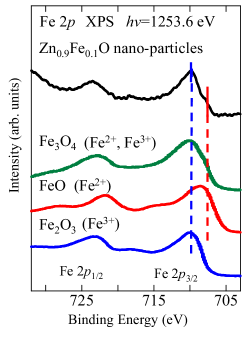
In a Fe-doped ZnO system, the valence state of Fe is expected to be +2 if Fe simply substitutes for Zn. The presence of Fe3+ ions in this sample has been suggested due to surface Zn vacancies Karmakar or excess oxygens of the nano-particles.
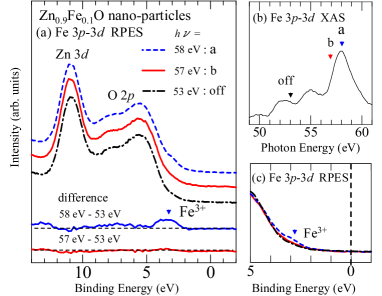
In order to study the electronic states in the surface region of the nano-particles, we performed RPES measurements in the Fe 3-3 core-excitation region. RPES in 3 transition metals and their compounds are caused by interference between direct photoemission from the 3 level and Auger-electron emission following the 3 (2)-3 core-excitation Davis . Therefore, the difference between valence-band spectra measured on- and off-resonance is used to extract the resonantly enhanced Fe 3 contributions to the valence-band region. Figure 2(a) shows the valence-band photoemission spectra of the Zn0.9Fe0.1O nano-particles taken with various photon energies in the Fe 3-3 core-excitation region marked on the Fe 3-3 XAS spectrum [Fig. 2(b)]. Figure 2(c) shows a magnified view near the valence-band maximum. In Fig. 2(b), one can see that a peak appears at 58 eV, representing the Fe 3-3 absorption. The same peak is found at 58 eV for -Fe2O3 (Fe3+) Lad . For FeO (Fe2+), on- and off-resonance energies are reported to be 57 and 53 eV, respectively Fujimori . From this comparison, we conclude that 3-3 absorption is mainly due to Fe3+ ions. In Fig. 2(c), one can see that in going from the off-resonance spectrum ( = 53 eV) to 58 eV, the tale at B 3-4 eV grows in intensity. By subtracting the off-resonance spectrum from the on-resonant ones of Fe3+ ( = 58 eV) and Fe2+ ( = 57 eV), respectively, we have extracted the Fe 3 partial density of states (PDOS) of Fe3+ and Fe2+ as shown in the bottom panel of Fig. 2(a). The Fe3+ 3 PDOS reveals a feature at B 3-4 eV. On the other hand, the Fe2+ 3 PDOS reveals no clear feature. We therefore conclude that the Fe3+ ions are dominant in the surface region of the Zn0.9Fe0.1O nano-particles probed by Fe 3-3 RPES. This, together with the bulk-sensitive Fe 2-3 RPES result described below, may support the core/shell model of the Zn0.9Fe0.1O nano-particles proposed in the previous report Karmakar .
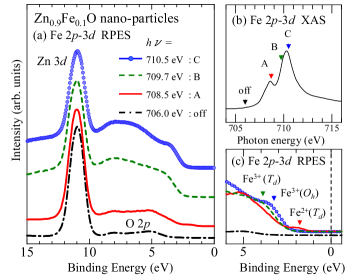
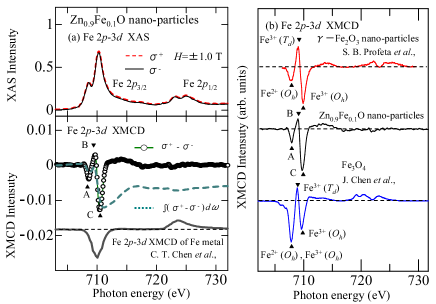
Figure 3(a) shows the Fe 2-3 XAS and XMCD spectra of the Zn0.9Fe0.1O nano-particles for opposite magnetization directions recorded using circular polarized x-rays, their difference spectrum, i.e., XMCD spectrum, and its integration. Here, the XAS spectra obtained in the magnetic field of +1.0 T and -1.0 T are denoted by + and -, respectively. The bottom panel shows the XMCD spectrum of Fe metal Chen . In the XMCD spectrum of the nano-particles, three sharp peaks around = 708.5, 709.7 and 710.5 eV, denoted by A, B and C, respectively, are observed. The XMCD spectral line shape of the Zn0.9Fe0.1O nano-particles is different from that of Fe metal, indicating that the magnetism in this sample is not due to segregation of metallic Fe clusters but due to the ionic Fe atoms with localized 3 electrons.
Figure 3(b) shows the Fe 2-3 XMCD spectrum of the Zn0.9Fe0.1O nano-particles in comparison with those of -Fe2O3 nano-particles, where Fe3+ ions are both at the tetrahedral (d) and octahedral (h) sites Profeta , and Fe3O4, where Fe3+ ions at the d and h sites and Fe2+ ions at the h sites coexist JChen . The XMCD spectrum of the Fe3O4, which displays the overlapping contributions from the Fe3+ and Fe2+ ions, is different from that of the Zn0.9Fe0.1O nano-particles. On the other hand, the spectral line shape of the -Fe2O3 nano-particles, where XMCD signals are due to Fe3+, is similar to that of the Zn0.9Fe0.1O nano-particles. This indicates that the magnetism of the Zn0.9Fe0.1O nano-particles is originated mainly from Fe3+ ions and contribution from Fe2+ ions appears to be small. By comparison with the Fe 2-3 XMCD spectral shape of the -Fe2O3 nano-particles, peaks B and C for the Zn0.9Fe0.1O nano-particles are assigned to Fe3+ ions at the d and h sites, respectively. Although it is likely that peak A arises mainly from Fe3+ (h) ions, the present Fe 2-3 RPES result, which is described below, suggests that peak A may be attributed not only to Fe3+ (h) but also to a small amount of Fe2+ (d) ions.
Figure 4(a) shows the valence-band photoemission spectra of the Zn0.9Fe0.1O nano-particles taken with various photon energies in the Fe 2-3 core-excitation region. The Fe 2-3 XAS spectrum in the same energy region is shown in Fig. 4(b). The photoemission spectra were taken using photon energies denoted by A, B and C in Fig. 3 and Fig. 4(b) and at off-resonance ( = 706.0 eV). For all the spectra, no photoemission intensity was observed at , indicating the localized nature of the carriers. The off-resonant spectrum of the Zn0.9Fe0.1O nano-particles is similar to that of ZnO showing a sharp peak at about B 11.0 eV due to the Zn 3 states as well as a broad feature at B 4.0-9.0 eV due to the O 2 band Gabas .
If the photon energy is tuned to peak A ( = 708.5 eV), one can see a feature at B 2.0 eV in the on-resonant spectrum [Fig. 4(c)], indicating that the intensity of photoelectrons arising from Fe2+ ions (the minority-spin state of Fe2+ ions Kobayashi ) is enhanced. For the spectra excited by photons with energies corresponding to peaks B ( = 709.7 eV) and C ( = 710.5 eV), one can see a broad structure around B 3.0-9.0 eV [Fig. 4(a) and (c)]. The spectral line shapes excited by photons corresponding to B and C are similar to each other, indicating that on-resonant spectral line shape strongly depends on the valency of Fe ions rather than coordination as anticipated. To clarify the electronic structure associated with the Fe 3 ion in each valence state and crystallographic site in the Zn0.9Fe0.1O nano-particles, we have performed configuration-interaction cluster-model calculations to deduce the Fe 3 PDOS of each component Tanaka1 ; Tanaka2 .
![[Uncaptioned image]](/html/0904.1838/assets/x6.png)
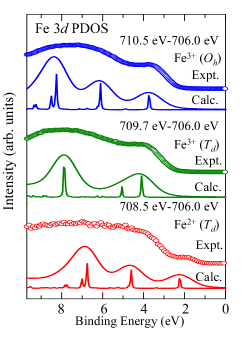
Figure 5 shows the Fe 3 PDOS (open circles) of the Zn0.9Fe0.1O nano-particles, which has been obtained by subtracting the off-resonance spectrum from the on-resonance ones of Fe3+ (h), Fe3+ (d) and Fe2+ (d), respectively. Calculated spectra (solid curves) are also shown in the same figure. Electronic structure parameters used in the calculations are listed in Table 1. For the Fe3+ (d and h sites) ions in the Fe-doped ZnO nano-particles, the values of the on-site 3-3 Coulomb energy dd and the 3-2 Coulomb energy dc on the Fe ion have been taken from the literature on the photoemission study of Fe3O4 JChen , where Fe3+ ions at the d and h sites and Fe2+ ions at the h sites coexist. In addition to this, based on the RPES results, we have chosen reasonable values for the charge-transfer energy of the Fe3+ (d and h sites) ions. The electronic structure parameters (dd, dc and ) of the Fe2+ (d) ions were appropriately chosen to reproduce the RPES result since there is no information in the literature about the electronic structure parameters of the Fe2+ (d) ions. The value of the Fe2+ (d) ions thus employed is large compared to those of the Fe3+ (d) ions, consistent with the systematic decrease in the value as the ionic charge increases Bocquet . The calculated spectra have been broadened with a Gaussian having a full width at half maximum (FWHM) of 0.6 eV and with a Lorentzian having a FWHM of 0.2 eV. The spectral line shapes of the calculated results agree with those of experimental results, confirming the presence of the Fe3+ (h), Fe3+ (d) and Fe2+ (d) ions.
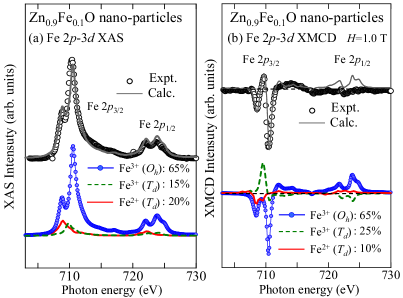
Figure 6(a) and (b) shows the Fe 2-3 XAS and XMCD spectra of the Zn0.9Fe0.1O nano-particles compared with the calculated spectra of the Fe3+ (h), Fe3+ (d) and Fe2+ (d) ions. The calculations have been made using parameters listed in Table 1. One observes shifts of the peaks in the XAS and XMCD spectra for the three kinds of the Fe ions, Fe3+ (d), Fe3+ (h) and Fe2+ (d) ions. The center of gravity of each spectrum is affected by Madelung energy, dd and dc at the Fe site, whereas the peak position may be shifted by crystal-field splitting JChen . Therefore, both the coordination and the valence state of the Fe ion affect the XAS and XMCD peak positions. Thus one can clearly distinguish between the valence and crystal-field of Fe ion [Fe3+ (d), Fe3+ (h) and Fe2+ (d)]. In Fig. 6(a), the weighted sum of the calculated Fe3+ (h: 65 %), Fe3+ (d: 15 %) and Fe2+ (d: 20 %) XAS spectra shown at the bottom of panel (a) approximately reproduces the measured XAS spectrum. These ratios indicate that Fe ions are predominantly in the Fe3+ state with mixture of a small amount of Fe2+. In Fig. 6(b), the weighted sum of the calculated Fe3+ (h: 65 %), Fe3+ (d: 25 %) and Fe2+ (d: 10 %) XMCD spectra shown at the bottom of panel (b) approximately reproduces the measured XMCD spectrum.
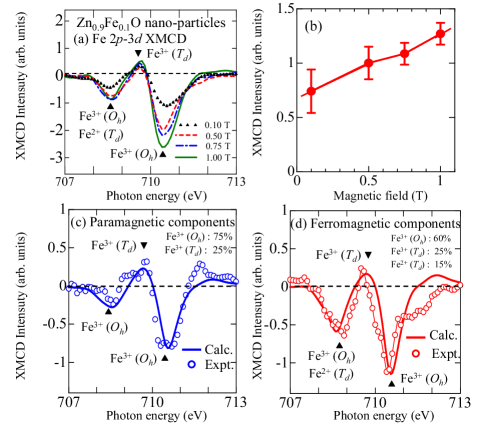
Figure 7(a) shows the Fe 2-3 XMCD spectra of the Zn0.9Fe0.1O nano-particles measured at various magnetic fields. One can observe the XMCD intensity down to 0.1 T as shown in Fig. 7(a) and (b), indicating that the ferromagnetism in this sample is originated from the ionic Fe atoms. The difference between the XMCD spectra at = 1.0 and 0.5 T reflects the paramagnetic components as shown in Fig. 7(c). From the line shape of the paramagnetic components analysed with the cluster-model calculation, we conclude that the paramagnetism in the Zn0.9Fe0.1O nano-particles is originated from the Fe3+ ions (h: 75 % and d: 25 %) and contributions from the Fe2+ ions are negligible, consistent with the proposal by Karmakar Karmakar . The ferromagnetic components obtained by subtracting the paramagnetic components from the XMCD spectrum at = 0.5 T is shown in Fig. 7(d). From the line-shape analysis, we conclude that the ferromagnetic components are originated from both predominant Fe3+ and a small amount of Fe2+ ions, where the composition ratios of the Fe3+ (h), Fe3+ (d) and Fe2+ (d) are about 60 %, 25 % and 15 %, respectively. In Fig. 7(d), peaks due to the Fe3+ ions at the d and h sites occur in the opposite directions. This clearly implies the presence of Fe3+ (d)-Fe3+ (h) antiferromagnetic coupling. Therefore, it is possible that this sample exhibits ”weak ferrimagnetism” due to the Fe3+ ions occupying two sets of nonequivalent positions (d and h sites) in unequal numbers and in antiparallel configurations so that there is a net moment Gilleo . That is, the ferromagnetism is caused by the difference in the electron numbers between up and down spins at d (h) and h (d) sites. Indeed, the room temperature ferromagnetism of the ferrite -Fe2O3 due to such Fe3+-Fe3+ antiferromagnetic coupling has been reported Boa . In addition to this, Fe2+-Fe2+, Fe3+-Fe3+ exchange interactions and Fe3+-Fe2+ double exchange interaction are considered to exist.
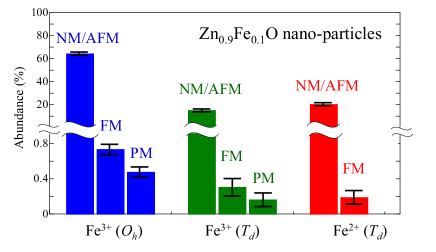
From the experimental and cluster-model calculation results, we have estimated the relative abundance of the nonmagnetic/antiferromagnetic (NM/AFM), ferromagnetic (FM) and paramagnetic (PM) components of the Fe ions [Fe3+ (h), Fe3+ (d) and Fe2+ (d)] as shown in Fig. 8. The NM/AFM components are originated from the strongly antiferromagnetic coupled Fe ions and are dominant in this sample. On the other hand, the weak ferromagnetic and paramagnetic components are originated mainly from Fe3+ as well as from a small amount of Fe2+ ions and uncoupled Fe3+ ions, respectively. In addition, our analysis confirms the predominance of the Fe3+ (h and d) ions in this sample. Considering that the Fe3+ ions are dominant in the surface region of the nano-particles probed by surface-sensitive Fe 3-3 RPES, the presence of the Fe3+ must be a surface effects. If Zn vacancies, which dope the system with holes, are present near Fe2+ (d) ions substituting Zn sites, the Fe2+ (d) ions will be converted to Fe3+ (d) Karmakar . This will occur mostly in the surface region of the nano-particles, where the probability of the presence of vacancies is higher. The Fe ions should be at the d sites if Fe simply substitutes for Zn site in the Fe-doped ZnO system. One possible origin for the presence of the Fe (h) ions is due to the interstitial impurities. However, Karmakar . have performed EPR, x-ray diffraction (XRD) and Mössbauer measurements on the same samples and the presence of interstitial impurities has been excluded Karmakar . The other possible origin for the presence of the Fe (h) ions is due to excess oxygen at the surface of the nano-particles. According to the literature about the molecular dynamics simulations of Fe2O3 nano-particles B.T.H.L.Khanh , to achieve local charge neutrality, it is expected that oxygen atoms have a tendency to concentrate on the surface of the Zn0.9Fe0.1O nano-particles. Due to the excess oxygen, the Fe ions in the surface region of the Zn0.9Fe0.1O nano-particles are coordinated to a larger number of oxygen atoms as if they were at the h sites. Indeed, Chen . LXChen have reported that Fe (d) ions in the surface region of Fe3O4 nano-particles have a tendency to be converted to Fe (h). In the nano-particle systems, the surface modification may dramatically affect the electronic structure and magnetic properties.
IV Conclusion
In summary, we have performed XPS, RPES, XAS and XMCD measurements on Zn0.9Fe0.1O nano-particles, which exhibit ferromagnetism at room temperature. From the experimental and cluster-model calculation results, we find that Fe atoms are predominantly in the Fe3+ ionic state with mixture of a small amount of Fe2+ and that Fe3+ ions are dominant in the surface region of the nano-particles. It is shown that the room temperature ferromagnetism in the Zn0.9Fe0.1O nano-particles is primarily originated from the antiferromagnetic coupling between unequal amounts of Fe3+ ions occupying two sets of nonequivalent positions in the region of the XMCD probing depth of 2-3 nm.
Acknowledgement
We thank T. Koide and D. Asakura for useful discussion and comments. We thank T. Okuda and A. Harasawa for their valuable technical support for the experiment at PF. The experiment at SPring-8 was performed under the approval of the Japan Synchrotron Radiation Research Institute (JASRI) (proposal no. 2007B3825). The experiment at PF was approved by the Photon Factory Program Advisory Committee (Proposal No. 2006G002). This work was supported by a Grant-in-Aid for Scientific Research in Priority Area ”Creation and Control of Spin Current” (19048012) from MEXT, Japan and a Global COE Program ”the Physical Sciences Frontier”, from MEXT, Japan and an Indo-Japan Joint Research Project ”Novel Magnetic Oxide Nano-Materials Investigated by Spectroscopy and -initio Theories” from JSPS, Japan.
References
- (1) J. K. Furdyna, J. Appl. Phys. 64, R29 (1988).
- (2) H. Ohno, Science 281, 951 (1998).
- (3) T. Dietl, H. Ohno, F. Matsukura, J. Cibert and D. Ferrand, Science 287, 1019 (2000).
- (4) K. Sato and H. Katayama-Yoshida, Jpn. J. Appl. Phys. 40, L334 (2001).
- (5) A. C. Tuan, J. D. Bryan, A. B. Pakhomov, V. Shutthanandan, S. Thevuthasan, D. E. McCready, D. Gaspar, M. H. Engelhard, J. W. Rogers, Jr., K. Krishnan, D. R. Gamelin and S. A. Chambers, Phys. Rev. B 70, 054424 (2004).
- (6) K. Ueda, H. Tabata and T. Kawai, Appl. Phys. Lett. 79, 988 (2001).
- (7) P. Sharma, A. Gupta, K. V. Rao, F. J. Owens, R. Sharma, R. Ahuja, J. M. Osorio, G. B. Johansson and G. A. Gehring, Nat. Mater. 2, 673 (2003).
- (8) D. A. Schwartz and D. R. Gamelin, Adv. Mater. 16, 2115 (2004).
- (9) P. V. Radovanovic and D. R. Gamelin, Phys. Rev. Lett. 91, 157202 (2003).
- (10) T. Melon and G. Markovich, J. Phys. Chem. B 109, 20232 (2005).
- (11) S. K. Mandal, A. Das, T. N. Nath, D. Karmakar and B. Satpati, J. Appl. Phys. 100, 104315, (2006).
- (12) S. K. Mandal, T. N. Nath, A. Das and R. K. Kremer, Appl. Phys. Lett. 89, 162502 (2006).
- (13) C. Kittel, Phys. Rev. 70, 965 (1946).
- (14) E. M. Chudnovsky and L. Gunther, Phys. Rev. Lett. 60, 661 (1988).
- (15) M. A. Garcia, J. M. Merino and E. Fernandez, Nano Lett. 7, 1489 (2007).
- (16) C. Q. Sun, Progress in Solid State Chem. 35, 1 (2007).
- (17) R. H. Kodama, A. E. Berkowitz, Jr E. J. McNiff and S. Foner, Phys. Rev. Lett. 77, 394 (1996).
- (18) D. Karmakar, S. K. Mandal, R. M. Kadam, P. L. Paulose, A. K. Rajarajan, T. K. Nath, A. K. Das, I. Dasgupta, and G. P. Das, Phys. Rev. B. 75, 144404 (2007).
- (19) P. Gopal and N. A. Spaldin, Phys. Rev. B 74, 094418 (2006).
- (20) L. C. Davis, J. Appl. Phys. 59, R25 (1986).
- (21) I. Lindau and W. E. Spicer, J . Electron Spec. Rel. Phen. 3, 409 (1974).
- (22) P. Graat and M. A. J. Somers, Surf. Interface Anal. 26, 773 (1998).
- (23) T. Fujii, F. M. F. de Groot, and G. A. Sawatzky, F. C. Voogt, T. Hibma and K. Okada, Phys. Rev. B 59, 3195 (1999).
- (24) R. J. Lad and V. E. Henrich, Phys. Rev. B 39, 13478 (1989).
- (25) A. Fujimori, M. Saeki, N. Kimizuka, M. Taniguchi and S. Suga, Phys. Rev. B 34, 7318 (1986).
- (26) C. T. Chen, Y. U. Idzerda, H.-J. Lin, N. V. Smith, G. Meigs, E. Chaban, G. H. Ho, E. Pellegrin and F. Sette, Phys. Rev. Lett. 75, 152 (1995).
- (27) S. B. Profeta, M. A. Arrio, E. Tronc, I. Letard, C. C. D. Moulin and P. Sainctavit, Phys. Scripta. T115, 626 (2005).
- (28) J. Chen, D. J. Huang, A. Tanaka, C. F. Chang, S. C. Chung, W. B. Wu and C. T. Chen, Phys. Rev. B 69, 085107 (2004).
- (29) M. Gabas, S. Gota, J. R. R.-Barrado, M. Sanchez and N. T. Barrett, Appl. Phys. Lett. 86, 042104 (2005).
- (30) J. Takaobushi, M. Ishikawa, S. Ueda, E. Ikenaga, J.-J. Kim, M. Kobata, Y. Takeda, Y. Saitoh, M. Yabashi, Y. Nishino, D. Miwa, K. Tamasaku, T. Ishikawa, I. Satoh, H. Tanaka, K. Kobayashi and T. Kawai, Phys. Rev. B 76, 205108 (2007).
- (31) A. Tanaka and T. Jo, J. Phys. Soc. Jpn. 63, 2788 (1994).
- (32) A. Tanaka and T. Jo, J. Phys. Soc. Jpn. 61, 2669 (1992).
- (33) A. E. Bocquet, T. Mizokawa, T. Saitoh, H. Namatame and A. Fujimori, Phys. Rev. B 46, 3771 (1992).
- (34) M. A. Gilleo, Phys. Rev. 109, 777 (1958).
- (35) X. Boa, G. Lia, X. Qiua, Y. Xueb and L. Li, J. Solid State Chem. 180, 1038 (2007).
- (36) B. T. H. L. Khanh, V. V. Hoang and H. Zung, Eur. Phys. J. D. 49, 325 (2008).
- (37) L. X. Chen, T. Liu, M. C. Thurnauer, R. Csencsits and T. Rajh, J. Phys. Chem B 106, 8539 (2002).