Magnetic anisotropy in (Ga,Mn)As: Influence of epitaxial strain and hole concentration
Abstract
We present a systematic study on the influence of epitaxial strain and hole concentration on the magnetic anisotropy in (Ga,Mn)As at 4.2 K. The strain was gradually varied over a wide range from tensile to compressive by growing a series of (Ga,Mn)As layers with 5% Mn on relaxed graded (In,Ga)As/GaAs templates with different In concentration. The hole density, the Curie temperature, and the relaxed lattice constant of the as-grown and annealed (Ga,Mn)As layers turned out to be essentially unaffected by the strain. Angle-dependent magnetotransport measurements performed at different magnetic field strengths were used to probe the magnetic anisotropy. The measurements reveal a pronounced linear dependence of the uniaxial out-of-plane anisotropy on both strain and hole density. Whereas the uniaxial and cubic in-plane anisotropies are nearly constant, the cubic out-of-plane anisotropy changes sign when the magnetic easy axis flips from in-plane to out-of-plane. The experimental results for the magnetic anisotropy are quantitatively compared with calculations of the free energy based on a mean-field Zener model. An almost perfect agreement between experiment and theory is found for the uniaxial out-of-plane and cubic in-plane anisotropy parameters of the as-grown samples. In addition, magnetostriction constants are derived from the anisotropy data.
pacs:
75.50.Pp, 75.30.Gw, 75.47.–m, 61.05.–aI Introduction
Spin-related phenomena in semiconductors, such as spin polarization, magnetic anisotropy (MA), and anisotropic magnetoresistance (AMR), open up new concepts for information processing and storage beyond conventional electronics.Zut04 ; Pea05 Being compatible with the standard semiconductor GaAs, the dilute magnetic semiconductor (Ga,Mn)As has proven to be an ideal playground for studying future spintronic applications.Mac05 ; Jun06 In particular, the pronounced MA and AMR, largely arising from the spin-orbit coupling in the valence band,Die01 ; Abo01 potentially apply in novel non-volatile memories and magnetic-field-sensitive devices. Ferromagnetism is implemented in (Ga,Mn)As by incorporating high concentrations (1%) of magnetic Mn2+ ions into the Ga sublattice. The ferromagnetic coupling between the S=5/2 Mn spins is mediated by itinerant holes provided by the Mn acceptor itself. Curie temperatures up to 185 K, i.e. well above the liquid-N2 temperature, have been reportedWan08 ; Nov08 and there is no evidence for a fundamental limit to higher values.Jun05
The magnetic properties of (Ga,Mn)As are strongly temperature dependent and can be manipulated to a great extent by doping, material composition, and strain. In (Ga,Mn)As grown on GaAs substrates, however, hole density , Mn concentration , and strain are intimately linked to each other and cannot be tuned independently by simply varying the growth parameters. and sensitively depend on the concentration and distribution of the Mn atoms which are incorporated both on Ga lattice sites (Mn) and, to a lower extent, on interstitial sites (Mn), where they act as compensating double donors. Post-growth treatment techniques such as annealing or hydrogenation are frequently used to increase or decrease the hole concentration due to outdiffusion and/or rearrangement of MnPot01 ; Yu02 ; Edm04 ; Zha05 ; Lim05 or due to the formation of electrically inactive (Mn,H) complexes,Goe04 ; The07 ; Bih08c respectively. In both cases, however, the treatment concurrently leads to a decrease or increase of the lattice parameter, respectively, and thus to a change of the strain.
The epitaxial strain in the (Ga,Mn)As layers, arising from the lattice mismatch between layer and substrate, can be adjusted by tailoring the lattice parameter of the substrate. While (Ga,Mn)As grown on GaAs is under compressive strain, tensily strained (Ga,Mn)As can be obtained by using appropriate (In,Ga)As/GaAs templates.Jun06 ; She97 ; Liu03 ; The06 Experimental studies addressing this issue, however, have so far been restricted to merely a limited number of representative samples.
In this work, the influence of epitaxial strain and hole concentration on the MA at 4.2 K is analyzed in a systematic way by investigating a set of (Ga,Mn)As layers grown on relaxed (In,Ga)As/GaAs templates with different In concentration. Keeping the Mn content at 5% and changing the maximum In content in the (In,Ga)As buffer layers from 0% to 12%, the vertical strain in the as-grown (Ga,Mn)As layers could be gradually varied over a wide range from =0.22% in the most compressively strained sample to =% in the most tensily strained sample without substantially changing . Post-growth annealing leads to an increase in , yielding a second series of samples with nearly the same range of but higher hole concentrations. The strain dependence of the anisotropy parameters for the as-grown and the annealed samples was determined by means of angle-dependent magnetotransport measurements.Lim06a ; Lim08 Part of the experimental data has already been published in conference proceedings.Dae08 Here, we combine the earlier with the present extensive experimental findings advancing a quantitative comparison of the intrinsic anisotropy parameters with model calculations for the MA, performed within the mean-field Zener model introduced by Dietl et al.Die01 Note that several samples analyzed in Ref. Dae08, have been substituted by new samples grown under optimized conditions and that the sample series has been expanded by one specimen with =-0.38%.
II Experimental details
A set of differently strained (Ga,Mn)As layers with constant Mn concentration of 5% and thickness of 180 nm was grown by low-temperature molecular-beam epitaxy (LT-MBE) on (In,Ga)As/GaAs templates with different In content in a RIBER 32 MBE machine. Indium-mounted semi-insulating VGF GaAs(001) wafers were used as substrates. After thermal deoxidation, a 30-nm-thick GaAs buffer layer was deposited at a substrate temperature of 580 ∘C. Then the growth was interrupted, was lowered to 430 ∘C, and a graded (In,Ga)As buffer with a total thickness of up to 5 m was grown. Starting with In0.02Ga0.98As, the temperature of the In cell was first continuously raised to increase the In content up to a value of 12% and was then kept constant until the required thickness of the buffer layer was reached. The growth was again interrupted, was lowered to 250 ∘C, and the (Ga,Mn)As layer was grown in As4 mode at a growth rate of 200 nm/h. The growth was monitored by reflection high-energy electron diffraction showing no indication of a second-phase formation. The use of a graded (In,Ga)As bufferHar89 minimizes the deterioration of the (Ga,Mn)As layer caused by threading dislocations in the relaxed (In,Ga)As/GaAs template. The resulting (Ga,Mn)As layers exhibit nearly the same quality as conventional samples directly grown on GaAs.The06 After the growth, the samples were cleaved into several pieces and some of the pieces were annealed in air for 1 h at 250 ∘C. The structural properties of the (Ga,Mn)As layers were analyzed by means of high-resolution x-ray diffraction (HRXRD) measurements performed with a Siemens D5000HR x-ray diffractometer using the Cu-K radiation at 0.154 nm. Hall bars with current directions along the and crystallographic axes were prepared from the samples by standard photolithography and wet chemical etching. The width of the Hall bars is 0.3 mm and the longitudinal voltage probes are separated by 1 mm. The hole densities were determined by high-field magnetotransport measurements (up to 14.5 T) at 4.2 K using an Oxford SMD 10/15/9 VS liquid-helium cryostat with superconducting coils. The Curie temperatures were estimated from the peak positions of the temperature-dependent sheet resistivities at 10 mT.Nov08 ; Esc97 ; Mat98 The MA of the samples was probed by means of angle-dependent magnetotransport measurements at 4.2 K using a liquid-He bath cryostat equipped with a rotatable sample holder and a standard LakeShore electromagnet system with a maximum field strength of 0.68 T. To determine the saturation magnetization, we employed a Quantum Design MPMS-XL-7 superconducting quantum interference device (SQUID) magnetometer using the Reciprocating Sample Option (RSO). The measured SQUID curves were corrected for the diamagnetic contribution of the substrate.
As discussed in detail in Ref. Bih08b, , our samples exhibit spin wave resonances which are most pronounced for the external magnetic field oriented perpendicular to the sample plane. These spin wave excitations have been traced back to an inhomogeneous free-energy density profile, or more precisely to a linear variation of the MA parameters along the growth direction, presumably arising from a vertical gradient in the hole density.Koe03 ; Lim05 Therefore, all physical parameters derived via magnetotransport in this study have to be considered as effective parameters representing the averaged electronic and magnetic properties of the layers.
III Theoretical considerations
In the present context, MA represents the dependence of the free-energy density on the orientation of the magnetization .rem In the absence of an external magnetic field, is determined by the minimum of the free energy. Since for reasons of crystal symmetry usually exhibits several equivalent minima, more than one stable orientation of exists. This symmetry-induced degeneracy of can be lifted by the application of an external magnetic field .
The theoretical considerations on the AMR and the MA in this paper are based on a single-domain model with a uniform magnetization . While the direction of is controlled by the interplay of and , its magnitude is assumend to be constant under the given experimental conditions. For sufficiently high field strengths , this assumption can be considered as a good approximation. Hence, the normalized quantity = is considered instead of , allowing for a concise description of the MA.
III.1 Phenomenological description of the MA
There are several contributions to which we refer to as intrinsic (magnetocrystalline) or extrinsic:
| (1) |
The intrinsic part = originates from the holes in the valence band () (see Sec. III.2) and from the localized Mn spins ().Die01 Whereas is strongly anisotropic with respect to the magnetization orientation, reflecting the anisotropy of the valence band, the localized-spin contribution = is isotropic and therefore irrelevant for the following considerations. In a phenomenological description, can be expressed in terms of a series expansion in ascending powers of the direction cosines , , and of the magnetization with respect to the cubic axes [100], [010], and [001], respectively. Considering terms up to the fourth order in , for cubic systems with tetragonal distortion along the [001] growth direction is given byLim08
| (2) |
In the case of a perfect cubic crystal, symmetry requires =0 and =.
The extrinsic part comprises the demagnetization energy due to shape anisotropy and a uniaxial in-plane anisotropy along []. The origin of the latter anisotropy is controversially discussed. It is traced back either to highly hole-concentrated (Ga,Mn)As clusters formed during the growth,Ham06 to the anisotropy of the reconstructed initial GaAs (001) substrate surface,Wel04 or to a trigonal-like distortion which may result from a nonisotropic Mn distribution, caused, for instance, by the presence of surface dimers oriented along [] during the epitaxy.Saw05 Approximating the (Ga,Mn)As layer by an infinite plane, we write the total extrinsic contribution as
| (3) |
where =.
In the presence of an external magnetic field =, the normalized Zeeman energy has to be added to the total free-energy density. This corresponds to a transition from to the normalized free-enthalpy density
| (4) | |||||
The anisotropy parameters and are both related to and are therefore combined into a single parameter . Given an arbitrary magnitude and orientation of , the direction of is determined by the minimum of .
III.2 Microscopic theory
For a microscopic description of the intrinsic part , we adopt the mean-field Zener model of Dietl et al. introduced in Ref. Die01, . The objective of the microscopic calculations discussed below is first, to justify the approximation in Eq. (2), made by considering only terms up to the fourth order, and second, to compare the experimentally found dependence of the intrinsic anisotropy parameters , , and on and (see Sec. IV.3) with that predicted by the mean-field Zener model.
According to the effective Hamiltonian theory presented in Ref. Die01, , the Hamiltonian of the system is given by
| (5) |
Here, represents the 66 Kohn-Luttinger Hamiltonian for the valence band and = accounts for the strain in the (Ga,Mn)As layer via the deformation potential operator . = describes the p-d hybridization of the p-like holes and the localized Mn d-shell electrons, which results in an interaction between the hole spin and the Mn spin carrying a magnetic moment . Here, =2 is the Landé factor, the Bohr magneton, and and denote the p-d exchange integral and the concentration of cation sites, respectively. In terms of the virtual crystal and mean-field approximation, the exchange interaction can be written as =. Explicit expressions for the individual contributions in Eq. (5) can be found in Ref. Die01, . As an approximation, the values of the Luttinger parameters (=1,2,3), the spin-orbit splitting , and the valence band shear deformation potential are chosen as those of GaAs. Explicit values are =6.85, =2.1, =2.9, =0.34 eV and = eV, respectively.Die01 The quantity parameterizing the exchange splitting of the valence subbands is given by
| (6) |
with the Fermi liquid parameter . In contrast to Ref. Die01, , we restrict our calculations to zero temperature (=0) and zero magnetic field (=0). In this approximation, the Fermi distribution is represented by a step function and the Zeeman as well as the Landau splitting can be neglected. These simplifications are justified, as our measurements were carried out at =4.2 K and T, where the Zeeman and Landau splittings of the valence band are expected to be much smaller than the splitting caused by the p-d exchange coupling. Diagonalization of the Hamilton matrix yields the sixfold spin-split valence band structure in the vicinity of the point, depending on the magnetization orientation and the strain in the (Ga,Mn)As layer.
The - and -dependent normalized free-energy density of the carrier system is obtained by first summing over all energy eigenvalues within the four spin-split heavy-hole and light-hole Fermi surfaces and then dividing the resulting energy density by . The two split-off valence bands do not contribute to because they lie energetically below the Fermi energy for common carrier concentrations. For biaxially strained (Ga,Mn)As layers grown pseudomorphically on (001)-oriented substrates, the tetragonal distortion of the crystal lattice along [001] can be fully described by the component of the strain tensor using continuum mechanics.
In order to compare the microscopic theory with the phenomenological description of the MA in Sec. III.1, we consider the dependence of on with respect to the reference direction =[100]. Accordingly, we write the anisotropic part of the intrinsic contribution as
| (7) |
In terms of the anisotropy parameters from Eq. (2), reads as
| (8) |
For rotated in the (001) and the (010) plane, Eq. (8) can be rewritten as
| (9) |
and
| (10) |
respectively, where we have introduced the azimuth angle and the polar angle with =, =, and =. We proceed by calculating numerically in the microscopic model as a function of and with varied in the range , using typical values for , , and . Equations (9) and (10) are then fitted to the resulting angular dependences using , , and as fit parameters. For the hole density we use the value = cm-3, for the exchange-splitting parameter = meV, and for the magnetization =40 mT. Inserted into Eq. (6), the latter two values yield = eV, in good agreement with the parameters used in Ref. Die01, .

The results of the microscopic calculations are depicted by the solid symbols in Figs. 1(a) and 1(b). Since the variation of with is found to be marginal, only one representative curve calculated with = is shown in Fig. 1(a). It clearly reflects the fourfold symmetry of within the (001) plane. By contrast, in Fig. 1(b) strongly depends on . The solid lines in Figs. 1(a) and 1(b) are least-squares fits to the calculated data using Eqs. (9) and (10), respectively. The perfect agreement between the microscopic results and the fit curves demonstrates that the intrinsic part of the free energy calculated within the microscopic theory can be well parameterized by , , and . It thus justifies the phenomenological approach in Eq. (2), taking into account only terms up to the fourth order in . Whereas the cubic anisotropy parameters mT obtained from the fit are not substantially affected by , the uniaxial parameter exhibits a pronounced linear dependence on , as shown in Fig. 1(c). The slope of () is strongly influenced by the exchange-splitting parameter and the hole density , as will be discussed in more detail in Sec. IV.3, Fig. 8(b).
The microscopic calculations show that for (tensile strain) exhibits two equivalent minima for oriented along [001] and [00], which become more pronounced with increasing tensile strain. In contrast, in the regime of compressive strain (), the minima occur for along [100], [00], [010], and [00]. Thus, the theoretical model correctly describes the well known experimental fact that for sufficiently high hole densities and low temperatures the magnetically hard axis along [001] in compressively strained layers turns into an easy axis in tensily strained layers. Note, however, that for a quantitative comparison between experiment and theory the extrinsic contributions to have also to be taken into account.
IV Results and discussion
In the following, the experimental data obtained for the (Ga,Mn)As samples under study are discussed.
IV.1 Lattice parameters and strain
In order to study the structural properties of the (Ga,Mn)As/(In,Ga)As/GaAs samples, reciprocal space maps (RSM) of the asymmetric (224), (4), (24), and (24) reflections were recorded using HRXRD. Figure 2 exemplarily shows an RSM contour plot of the (224) reflection for a nearly unstrained (Ga,Mn)As layer with =%, depicting separate peaks for the GaAs substrate, the (In,Ga)As buffer, and the (Ga,Mn)As layer.

From the peak positions (,) and their shifts (,) relative to that of the substrate the lateral and vertical lattice parameters of (Ga,Mn)As and (In,Ga)As can be determined using the relations
| (11) |
where denotes the lattice constant of the GaAs substrate. and are the coordinates in -space referring to the reciprocal lattice vectors of GaAs along the [100] and [001] directions, respectively. In Fig. 2, the peaks of (Ga,Mn)As and (In,Ga)As are centered at the same value of , confirming that the (Ga,Mn)As layer has been grown lattice matched to the (In,Ga)As buffer. The lateral lattice parameters are therefore the same in the (In,Ga)As and (Ga,Mn)As layers. The shift from the substrate peak at =2 to lower values is due to the strain relaxation in the buffer layer (). The lattice parameters of the (In,Ga)As templates in the as-grown and annealed samples are plotted against the In content in Fig. 3(a). Apparently, post-growth annealing had no significant influence on , which linearly increases with the In content.
For both (Ga,Mn)As and (In,Ga)As, the HRXRD measurements yielded different values of (,) for the (224) and (4) reflections, revealing a tilt of the lattice towards the [110] direction.Kro96 The tilt of the (Ga,Mn)As layer originates from an equal tilt in the (In,Ga)As buffer pointing to an anisotropic relaxation of the (In,Ga)As templates, typically found in layers grown on vicinal substrates.Aye91 The samples under investigation, however, were grown on non-miscut (001) wafers. As can be seen in Fig. 3(b), the measured tilt angles tend to higher values with increasing In fraction. It should be emphasized that it is imperative to take the tilt into account when determining the lattice parameters in order to avoid erroneous results. This can be done by inserting into Eq. (11) the averaged values of the peak positions and shifts obtained from the (224) and (4) reflections. For the angle-dependent magnetotransport measurements, the influence of the tilt is negligible since the tilt angles observed are smaller than 0.06 degree.


The relaxed lattice parameter of a biaxially strained layer on (001)-oriented substrate is obtained from the relation
| (12) |
where and are elastic stiffness constants. As an approximation, we use the values =11.90 Pa and =5.34 Pa of GaAs for both the (Ga,Mn)As and the (In,Ga)As layers.Lev96 In Fig. 4(a), is shown for the (Ga,Mn)As layers as a function of the In content in the (In,Ga)As buffer. It is found to be nearly unaffected by the (In,Ga)As template underneath. The fluctuations in the values of are mainly attributed to slight variations of the growth temperature. For all (In,Ga)As templates under study, the degree of relaxation defined by = was above 80%. Once the vertical and relaxed lattice parameters of the (Ga,Mn)As layers are known, the vertical strain can be calculated from the relation
| (13) |
In Fig. 4(b), is plotted against the In content. The slight decrease of and upon annealing is supposed to arise from the outdiffusion and/or rearrangement of the highly mobile Mn.Pot01 ; Yu02 ; Edm04 ; Zha05 ; Lim05
IV.2 Hole density and Curie temperature
Determination of the hole concentrations in (Ga,Mn)As is complicated by a dominant anomalous contribution to the Hall effect proportional to the normal component of the magnetization (anomalous Hall effect). To overcome this problem, magnetotransport measurements were performed at high magnetic fields up to 14.5 T. Assuming the magnetization to be saturated perpendicular to the layer plane at magnetic fields 4 T, the measured transverse resistivity was fitted using the equation
| (14) |
for the ordinary and anomalous Hall effect with , , and as fit parameters. Here = is the ordinary Hall coefficient and the measured field-dependent longitudinal resistivity. The second term on the right hand side arises from skew scatteringSmi55 ; Smi58 and the third term from side jump scatteringBer70 and/or Berry phase effects.Jun02 As mentioned in Sec. II, the Curie temperatures were inferred from the peak positions of the temperature-dependent resistivities .Esc97 ; Mat98 Considering that the values thus obtained generally differ from those determined by temperature-dependent magnetization measurements,Nov08 we estimate an error margin of up to 20%. Similar to , neither nor are significantly influenced by the strain as shown in Figure 5.

The values scatter around =3.5 cm-3 and =65 K for the as-grown samples and =5.8 cm-3 and =91 K for the annealed samples. It is well known that the lattice constant, the hole density, and the Curie temperature strongly depend on the concentration of Mn acceptors, Mn double donors, and other compensating defects such as As antisites. The insensitivity of , , and to strain in the as-grown and annealed samples under study suggests the assumption that strain has no significant influence on the incorporation of Mn, Mn, and As. At least the sum of the changes caused by the different constituents seems to be unaltered. Moreover, the insensitivity of with respect to supports theoretical predictions that the magnetic coupling should be unaffected by strain, since the corresponding deformation energies are expected to be too small to significantly enhance or reduce the p-d kinetic exchange interaction.Die01 ; Jun06
IV.3 Anisotropy parameters
Experimental values for the anisotropy parameters =+, , , and were determined by means of angle-dependent magnetotransport measurements. A detailed description of the corresponding procedure is given in the Refs. Lim06a, and Lim08, . It can be briefly summarized as follows. The longitudinal and transverse resistivities and , respectively, are measured as a function of the magnetic field orientation at fixed field strengths of =0.11, 0.26, and 0.65 T. At each field strength, is rotated within three different crystallographic planes perpendicular to the directions , , and , respectively. The corresponding configurations, labeled I, II, and III, are shown in Fig. 6.
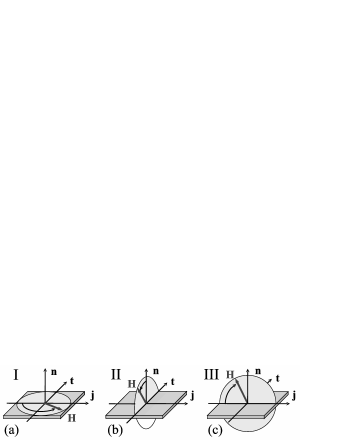
The vectors form a right-handed coordinate system, where defines the current direction, the surface normal, and the transverse direction. For current directions and , the resistivities can be written asLim08
| (15) |
| (16) |
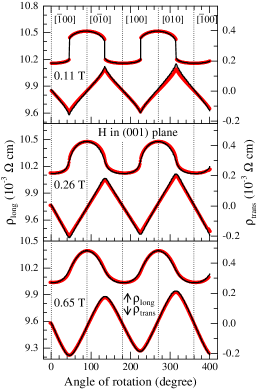
where , , and denote the components of along , , and , respectively. At sufficiently high magnetic fields, the Zeeman energy in dominates and the magnetization direction follows the orientation of the external field. The resistivity parameters (=1,…,9) are then obtained from a fit of the Eqs. (15) and (16) to the experimental data recorded at 0.65 T. With decreasing field strength, the influence of the MA increases and more and more deviates from . Controlled by the magnetic anisotropy parameters, the shape of the measured resistivity curves changes and , , , and are obtained from a fit to the data recorded at =0.26 and 0.11 T. In the fit procedure, is calculated for every given magnetic field by numerically minimizing with respect to . Figure 7 exemplarily shows the angular dependence of and for a nearly unstrained (Ga,Mn)As layer (=%) with rotated in the (001) plane (configuration I) and . The experimental data are depicted by red solid circles and the fits by black solid lines.


Applying the procedure described above to the whole set of (Ga,Mn)As layers under study, the resistivity parameters (=1,…,9) and the anisotropy parameters =+, , , and were determined as functions of the vertical strain . The results for the resistivity parameters were extensively discussed in Ref. Lim08, . In the present work, we exclusively focus on the anisotropy parameters.
Figure 8(a) shows the values of the parameter =+ describing the uniaxial out-of-plane anisotropy. For both the as-grown and the annealed samples, a pronounced linear dependence on is found in qualitative agreement with the microscopic model calculations presented in Fig. 1(c). For zero strain, the cubic symmetry requires =0 and the extrinsic parameter 60 mT is inferred from the intersections between the regression lines (dotted lines) and the vertical axis. If shape anisotropy was the only extrinsic contribution to the term of , as assumed in Sec. III.1, the value 60 mT would correspond to a sample magnetization of =120 mT. This value, however, exceeds the saturation magnetization determined by SQUID measurements by a factor of 3. Figure 9 shows as an example the SQUID curves obtained for the as-grown and annealed samples with 0.2%. At the moment, the reason for this discrepancy is not yet understood. We suspect, however, that it might be related to the vertical gradient in the MA mentioned at the end of Sec. II. Assuming the value of to be nearly the same for all samples under consideration, the strain-dependent intrinsic parameter is obtained by subtracting from the measured data. In Fig. 8(b), the values of derived in this way are shown together with model calculations performed within the microscopic theory (see Sec. III.2). Using for the mean values =3.5 cm-3 and =5.8 cm-3 (see Sec. IV.2), the calculated values of are found to be in quantitative agreement with the experimental data if = meV is chosen for the as-grown samples and = meV for the annealed samples. The corresponding curves are depicted by the solid and dashed lines in Fig. 8(b). Comparing the exchange-splitting parameters with the respective hole densities, we find
| (17) |
For the annealed samples, theoretical results are also shown for meV and meV, demonstrating that the slope of () is drastically reduced with decreasing . Remarkably, normalization of the experimentally derived values of to the corresponding hole concentration yields the same linear dependence of on for both the as-grown and the annealed samples as shown in Fig. 8(c). We thus find, at least for the range of hole densities and strain under consideration, the experimental relationship
| (18) |
with =1.5710-19 T cm3. If we assume a linear relation =, in accordance with Eq. (17), Eq. (18) can be reproduced by the microscopic theory. Note however, that this is not trivial, since explicitly depends on both and . Anyhow, the relation demands a future detailed investigation.
The experimental values of the fourth-order parameters and are presented in Figs. 10(a) and 10(b), respectively. Whereas only slightly varies between and mT, exhibits positive values close to 10 mT for % and negative values of about mT for %. The lines depicted in Fig. 10 were calculated using the same values for and as in Fig. 8(b). Obviously, the change of sign of does not appear in the theoretical curves. Apart from this disagreement, the experimental data of the as-grown samples are again well reproduced for = meV. In the case of the annealed samples, now the splitting parameter = meV yields a much better description of the measured data than = meV, found to fit the strain dependence of .
In view of the perfect quantitative interpretation of by the mean-field Zener model, this small discrepancy and the fact that the change of sign of is not reproduced by the calculations, should not be overestimated. The experimentally observed change of sign of may be caused by extrinsic influences, not accessible by the model, such as the increasing density of threading dislocations in the (Ga,Mn)As/(In,Ga)As layers with increasing In concentration. Moreover, we cannot rule out that the change of sign is an artifact of the experimental method for determining the relatively small anisotropy parameter . The same problem has also been reported in Ref. Liu03, , where the authors did not extract information on the fourth-order out-of-plane anisotropy parameters from their ferromagnetic resonance measurements, since the corresponding contributions to the MA were masked by the much larger contributions of the second-order out-of-plane term. As to the differing values of meV and meV for in the case of the annealed samples, it should be pointed out that for high hole densities the Fermi energy shifts deep into the valence band. Therefore, the values of the free energy obtained by using a 66 effective Hamiltonian become increasingly unreliable when analyzing higher order contributions to the free energy. One should not jump to the conclusion that this has to be interpreted as a deficiency of the Zener model itself.
In agreement with the data presented in Refs. Liu03, , Wan05, , and Yam06, , the experimental values of the extrinsic uniaxial in-plane parameter are much smaller than those of the cubic in-plane parameter at 4.2 K. As shown in Fig. 11, they scatter around zero with mT10 mT.
Due to the strong dependence of on , the out-of-plane axis [001] becomes magnetically harder with increasing from % to 0.2%. Neglecting the small influence of in our samples at 4.2 K, the critical strain , where a reorientation of the easy axis from out-of-plane to in-plane occurs, can be estimated from the condition +=. We obtain for the as-grown (Ga,Mn)As layers under study =% and for the annealed layers =%. Remarkably, these values are very close to the values in Fig. 10 where changes sign.
Since the MA sensitively depends on the individual growth conditions, care has to be taken when comparing the values of anisotropy parameters published by different groups. Keeping this restriction in mind, the data presented in this work are in reasonable agreement, e.g., with the results obtained by Liu et al.Liu03 for a representative pair of compressively and tensily strained (Ga,Mn)As samples with 3% Mn.
IV.4 Magnetostriction constant
Changing the magnetization of a ferromagnet, e.g. by an external magnetic field, leads to a variation of its geometrical shape. For crystals with cubic symmetry, the relative elongation in a given direction can be expressed in terms of the magnetization orientation and the magnetostriction constants and along [100] and [111], respectively, according to Von74
| (19) | |||||
Starting from Eq. (18), we are able to determine defined by Von74
| (20) |
where denotes the magnetoelastic coupling constant. First-order expansion of the free-energy density with respect to and continuum mechanics yield the relation =. Thus, Eq. (20) can be rewritten as
| (21) |
Inserting the experimental values for , , and , we obtain ppm for the as-grown samples and ppm for the annealed samples. In Ref. Bih08a, , we already deduced an approximately constant value of 5 ppm below 40 K decreasing to zero at higher temperatures (40 KT85 K) via applying piezo stress along the [110] direction of a piezoelectric actuator/(Ga,Mn)As hybrid structure. Our results for both magnetostriction constants are close to the values = ppm and =8.1 ppm reported by Masmanidis et al.Mas05
V Summary
A series of (Ga,Mn)As layers with 5% Mn was grown on relaxed graded (In,Ga)As/GaAs templates with In contents up to 12%. In this way, the vertical strain in the (Ga,Mn)As layers could be gradually varied over a wide range from % (tensile strain) to 0.22% (compressive strain). The strain was found to have no significant influence on the hole concentration, the Curie temperature, and the relaxed lattice parameter. Angle-dependent magnetotransport measurements were performed to determine the uniaxial and cubic anisotropy parameters. turned out to be proportional to both the strain and the hole concentration. From this linear dependence, the magnetostriction constant was determined. While and are nearly strain independent, changes sign when the magnetic easy axis flips from in-plane to out-of-plane.
Microscopic calculations of the free-energy density were performed based on the mean-field Zener model of Dietl et al.Die01 They justify the approximations made in the parameterization of the free energy by considering only terms up to the fourth order. The strain-dependent anisotropy parameters derived from the calculations were found to be in good quantitative agreement with the experimental results. In the case of the as-grown samples, the values of and are even perfectly reproduced. The quantitative comparison between the comprehensive set of experimental data and the microscopic calculations may be considered a valuable contribution to the ongoing controversy on impurity band versus valence band in (Ga,Mn)As.Jun07 ; Bur08
Using the orientation of the magnetization as the basic information bit of a non-volatile memory, the tayloring and manipulation of the MA is of special importance. As shown in this work, the choice of an appropriate (In,Ga)As template allows for an adjustment of close to the critical value . Then, the magnetization direction can be switched from in-plane to out-of-plane or vice versa, e.g., by minute variation of the piezo stress in a piezoelectric actuator/(Ga,Mn)As hybrid structureBih08a .
Acknowledgements.
This work was supported by the Deutsche Forschungsgemeinschaft under Contract No. Li 988/4.References
- (1) I. Zutic, J. Fabian, and S. Das Sarma, Rev. Mod. Phys. 76, 323 (2004).
- (2) S. J. Pearton, D. P. Norton, R. Frazier, S. Y. Han, C. R. Abernathy, and J. M. Zavada, IEE Proc.: Circuits Devices Syst. 152, 312 (2005).
- (3) A. H. MacDonald, P. Schiffer, and N. Samarth, Nature Materials 4, 195 (2005).
- (4) T. Jungwirth, J. Sinova, J. Mašek, J. Kučera, and A. H. MacDonald, Rev. Mod. Phys. 78, 809 (2006), and references therein.
- (5) T. Dietl, H. Ohno, and F. Matsukura, Phys. Rev. B 63, 195205 (2001).
- (6) M. Abolfath, T. Jungwirth, J. Brum, and A.H. MacDonald, Phys. Rev. B 63, 054418 (2001).
- (7) M. Wang, R. P. Campion, A. W. Rushforth, K. W. Edmonds, C. T. Foxon, and B. L. Gallagher, Appl. Phys. Lett. 93, 132103 (2008).
- (8) V. Novák, K. Olejník, J. Wunderlich, M. Cukr, K. Vyborny, A. W. Rushforth, K. W. Edmonds, R. P. Campion, B. L. Gallagher, J. Sinova, and T. Jungwirth, Phys. Rev. Lett. 101, 077201 (2008).
- (9) T. Jungwirth, K. Y. Wang, J. Mašek, K. W. Edmonds, J. König, Jairo Sinova, M. Polini, N. A. Goncharuk, A. H. MacDonald, M. Sawicki, A. W. Rushforth, R. P. Campion, L. X. Zhao, C. T. Foxon, and B. L. Gallagher, Phys. Rev. B 72, 165204 (2005).
- (10) S. J. Potashnik, K. C. Ku, S. H. Chun, J. J. Berry, N. Samarth, and P. Schiffer, Appl. Phys. Lett. 79, 1495 (2001).
- (11) K. M. Yu, W. Walukiewicz, T. Wojtowicz, I. Kuryliszyn, X. Liu, Y. Sasaki, and J. K. Furdyna, Phys. Rev. B 65, 201303(R) (2002).
- (12) K. W. Edmonds, P. Bogusławski, K. Y. Wang, R. P. Campion, S. N. Novikov, N. R. S. Farley, B. L. Gallagher, C. T. Foxon, M. Sawicki, T. Dietl, M. Buongiorno Nardelli, and J. Bernholc, Phys. Rev. Lett. 92, 037201 (2004).
- (13) L. X. Zhao, C. R. Staddon, K. Y. Wang, K. W. Edmonds, R. P. Campion, B. L. Gallagher, and C. T. Foxon, Appl. Phys. Lett. 86, 071902 (2005).
- (14) W. Limmer, A. Koeder, S. Frank, V. Avrutin, W. Schoch, R. Sauer, K. Zuern, J. Eisenmenger, P. Ziemann, E. Peiner, and A. Waag, Phys. Rev. B 71, 205213 (2005).
- (15) S. T. B. Goennenwein, T. A. Wassner, H. Huebl, M. S. Brandt, J. B. Philipp, M. Opel, R. Gross, A. Koeder, W. Schoch, and A. Waag, Phys. Rev. Lett. 92, 227202 (2004).
- (16) L. Thevenard, L. Largeau, O. Mauguin, A. Lemaître, K. Khazen, and H. J. von Bardeleben, Phys. Rev. B 75, 195218 (2007).
- (17) C. Bihler, G. Ciatto, H. Huebl, G. Martinez-Criado, P. J. Klar, K. Volz, W. Stolz, W. Schoch, W. Limmer, F. Filippone, A. Amore Bonapasta, and M.S. Brandt, Phys. Rev. B 78, 235208 (2008).
- (18) A. Shen, H. Ohno, F. Matsukura, Y. Sugawara, N. Akiba, T. Kuroiwa, A. Oiwa, A. Endo, S. Katsumoto, and Y. Iye, J. Cryst. Growth 175–176, 1069 (1997).
- (19) X. Liu, Y. Sasaki, and J. K. Furdyna, Phys. Rev. B 67, 205204 (2003).
- (20) L. Thevenard, L. Largeau, O. Mauguin, G. Patriarche, A. Lemaître, N. Vernier, and J. Ferré, Phys. Rev. B 73, 195331 (2006).
- (21) W. Limmer, M. Glunk, J. Daeubler, T. Hummel, W. Schoch, R. Sauer, C. Bihler, H. Huebl, M. S. Brandt, and S. T. B. Goennenwein, Phys. Rev. B 74, 205205 (2006).
- (22) W. Limmer, J. Daeubler, L. Dreher, M. Glunk, W. Schoch, S. Schwaiger, and R. Sauer, Phys. Rev. B 77, 205210 (2008).
- (23) J. Daeubler, S. Schwaiger, M. Glunk, M. Tabor, W. Schoch, R. Sauer, and W. Limmer, Physica E 40, 1876 (2008).
- (24) J. C. Harmand, T. Matsuno, and K. Inoue, Jpn. J. Appl. Phys., Part 2 28, L1101 (1989).
- (25) A. Van Esch, L. Van Bockstal, J. De Boeck, G. Verbanck, A.S. van Steenbergen, P.J. Wellmann, B. Grietens, R. Bogaerts, F. Herlach, and G. Borghs, Phys. Rev. B 56, 13103 (1997).
- (26) F. Matsukura, H. Ohno, A. Shen, and Y. Sugawara, Phys. Rev. B 57, R2037 (1998).
- (27) C. Bihler, W. Schoch, W. Limmer, S. T. B. Goennenwein, and M. S. Brandt, Phys. Rev. B. 79, 045205 (2009).
- (28) A. Koeder, S. Frank, W. Schoch, V. Avrutin, W. Limmer, K. Thonke, R. Sauer, A. Waag, M. Krieger, K. Zuern, P. Ziemann, S. Brotzmann, and H. Bracht, Appl. Phys. Lett. 82, 3278 (2003).
- (29) Throughout this work, unit vectors are denoted by bold lower-case letters.
- (30) K. Hamaya, T. Watanabe, T. Taniyama, A. Oiwa, Y. Kitamoto, and Y. Yamazaki, Phys. Rev. B 74, 045201 (2006).
- (31) U. Welp, V. K. Vlasko-Vlasov, A. Menzel, H. D. You, X. Liu, J. K. Furdyna, and T. Wojtowicz, Appl. Phys. Lett. 85, 260 (2004).
- (32) M. Sawicki, K.-Y. Wang, K. W. Edmonds, R. P. Campion, C. R. Staddon, N. R. S. Farley, C. T. Foxon, E. Papis, E. Kamińska, A. Piotrowska, T. Dietl, and B. L. Gallagher, Phys. Rev. B 71, 121302(R) (2005).
- (33) X. Liu and J. K. Furdyna, J. Phys.: Condens. Matter 18, R245 (2006).
- (34) A. Krost, G. Bauer, and J. Woitok, in Optical Characterization of Epitaxial Semiconductor Layers, edited by G. Bauer and W. Richter (Springer, Berlin Heidelberg, 1996), pp. 287–391.
- (35) J. E. Ayers, S. K. Ghandhi, and L. J. Schowalter, J. Cryst. Growth 113, 430 (1991).
- (36) M. Levinshtein and S. Rumyantsev, in Handbook Series On Semiconductor Parameters, edited by M. Levinshtein, S. Rumyantsev, and M. Shur (World Scientific, Singapore, 1996), Vol. 1.
- (37) J. Smit, Physica (Amsterdam) 21, 877 (1955).
- (38) J. Smit, Physica (Amsterdam) 24, 39 (1958).
- (39) L. Berger, Phys. Rev. B 2, 4559 (1970).
- (40) T. Jungwirth, Q. Niu, and A. H. MacDonald, Phys. Rev. Lett. 88, 207208 (2002).
- (41) K.-Y. Wang, M. Sawicki, K. W. Edmonds, R. P. Campion, S. Maat, C. T. Foxon, B. L. Gallagher, and T. Dietl, Phys. Rev. Lett. 95, 217204 (2005).
- (42) T. Yamada, D. Chiba, F. Matsukura, S. Yakata, and H. Ohno, Phys. Stat. Sol. (c) 3, 4086 (2006).
- (43) S. V. Vonsovskii, Magnetism (Wiley, New York, 1974), Vol. 2, Chap. 23.
- (44) C. Bihler, M. Althammer, A. Brandlmaier, S. Geprägs, M. Weiler, M. Opel, W. Schoch, W. Limmer, R. Gross, M. S. Brandt, and S. T. B. Goennenwein, Phys. Rev. B 78, 045203 (2008).
- (45) S. C. Masmanidis, H. X. Tang, E. B. Myers, Mo Li, K. De Greve, G. Vermeulen, W. Van Roy, and M. L. Roukes, Phys. Rev. Lett. 95, 187206 (2005).
- (46) T. Jungwirth, Jairo Sinova, A. H. MacDonald, B. L. Gallagher, V. Novák, K. W. Edmonds, A. W. Rushforth, R. P. Campion, C. T. Foxon, L. Eaves, E. Olejník, J. Mašek, S.-R. Eric Yang, J. Wunderlich, C. Gould, L. W. Molenkamp, T. Dietl, and H. Ohno, Phys. Rev. B 76, 125206 (2007).
- (47) K. S. Burch, D. D. Awschalom, and D. N. Basov, J. Magn. Magn. Mat. 320, 3207 (2008).