Anomalies in the transcriptional regulatory network of the yeast Saccharomyces cerevisiae
Abstract
We investigate the structural and dynamical properties of the transcriptional regulatory network of the yeast Saccharomyces cerevisiae and compare it with two “unbiased” ensembles: one obtained by reshuffling the edges and the other generated by mimicking the transcriptional regulation mechanism within the cell. Both ensembles reproduce the degree distributions (the first -by construction- exactly and the second approximately), degree-degree correlations and the -core structure observed in Yeast. An exceptionally large dynamically relevant core network found in Yeast in comparison with the second ensemble points to a strong bias towards a collective organization which is achieved by subtle modifications in the network’s degree distributions. We use a Boolean model of regulatory dynamics with various classes of update functions to represent in vivo regulatory interactions. We find that the Yeast’s core network has a qualitatively different behaviour, accommodating on average multiple attractors unlike typical members of both reference ensembles which converge to a single dominant attractor. Finally, we investigate the robustness of the networks and find that the stability depends strongly on the used function class. The robustness measure is squeezed into a narrower band around the order-chaos boundary when Boolean inputs are required to be nonredundant on each node. However, the difference between the reference models and the Yeast’s core is marginal, suggesting that the dynamically stable network elements are located mostly on the peripherals of the regulatory network. Consistently, the statistically significant three-node motifs in the dynamical core of Yeast turn out to be different from and less stable than those found in the full transcriptional regulatory network.
keywords:
Boolean dynamics , attractor distribution , robustness , dynamical core network , canalizing functionsPACS:
89.75.-k , 64.60.Fr , 36.20.Ey1 Introduction
Transcriptional regulatory network (TRN) describes the connective structure of the gene-gene interactions that regulate most physiochemical activities in a cell (Thomas, 1998; Albert & Barabási, 2002). This is particularly valid for Saccharomyces cerevisiae (from here on referred to as “Yeast”), an eukaryote which lacks miRNA and RNAi capability. Survival of the cell under changing external conditions requires both a responsive and a robust regulatory mechanism (Kauffman, 1993). The two key ingredients that contribute to the dynamics of regulatory activity are the network’s topology and the character of the regulatory interactions (Kauffman et al., 2003). It is natural to attempt to identify the respective roles of these two components on the dynamical properties of the system. For this purpose, we consider here two neutral network ensembles and compare their representative members with the yeast’s transcriptional regulation network. The first ensemble (E1) is generated by reshuffling the edges on the Yeast’s TRN. This ensemble is suitable for identifying features that fall beyond those implied by the node connectivities. The second ensemble (E2) was developed in a recent study by Balcan et al. (2007) and was shown to mimic with high accuracy the global structural properties of the network of transcriptional regulatory interactions (Lee et al., 2002; Teixeira et al., 2006) found in Yeast. By comparing the characteristic features of the regulatory dynamics on Yeast’s TRN with those of the two ensembles, we discuss the relevance of in/out-degree statistics and the functional character of the interactions to the regulatory dynamics.
Below, we first focus on the structure of the TRN found in Yeast and those of the typical members of the two ensembles. Next, we investigate the differences between their dynamics in terms of their attractor statistics and robustness, both within the framework of a synchronous, Boolean time-evolution model.
2 Structure of Yeast’s TRN
A reasonably complete picture of the architecture of the TRN in Yeast is now available due to the collective effort of many experimental groups and the recent development of high-throughput techniques (Spellman et al., 1998; Lee et al., 2002; Teixeira et al., 2006). The structure is radically different from a random collection of nodes connected by edges, where the quoted numbers are those of the genes and known regulatory interactions in the Yeastract database (Teixeira et al., 2006) adopted by Balcan et al. (2007). In particular, the regulating nodes (transcription factors, or TFs) which constitute of all genes have a skewed out-degree distribution which has been suggested to follow a power-law (Guelzim et al., 2002; Bergmann et al., 2003; Maslov & Sneppen, 2005), and a roughly exponential in-degree distribution (Maslov & Sneppen, 2005), although the ranges of both distributions are somewhat narrow to make a strong case. Nevertheless, the deviation from a randomly wired network is strong and independent of the database used. A similar trend is observed in other structural aspects, such as degree-degree correlations and the -core organization which appear to follow from the in- and out-degree distributions (Balcan et al., 2007). Note that the numbers quoted above continue to increase as new experimental data pours in. However, for the sake of a fair comparison with the earlier study we stick to the same reference data and pay attention that our conclusions are based on observations (such as normalized distributions) that are likely to change little with further incoming data.
2.1 Reference ensembles
The ensemble E1 is an “unbiased” set of networks generated from Yeast’s TRN by shuffling the edges among the nodes while keeping the in- and out-degrees of each node unaltered. This is achieved simply by switching the end terminals of two randomly picked edges to obtain two new edges , where we impose in order to keep the number of self-regulating genes fixed (see below). In spite of its frequent use in the literature, one should consider E1 a biologically inappropriate reference point. There is no good reason to assume that Nature selected Yeast’s TRN out of a pool of networks with identical degree distributions. Furthermore, such a reference simply ignores the question pertaining to the origin of the observed degree distribution for which several mechanisms have been proposed (Wagner, 1994; Van Noort et al., 2004; Balcan et al., 2007). Nevertheless, stastically significant deviations from E1 found in Yeast (features with a high z-score) allowed past studies to point out a high abundance of stability enhancing local motifs, such as feed-forward loops. On the other hand, the highest z-score 3-node motif thus found by Prill et al. (2005) can be reproduced with the right frequency by means of a simple model which we also consider here to generate a second reference ensemble E2 as descibed below.
E2 is generated from a biologically motivated model introduced by Balcan et al. (2007). In this null model, two binary strings are associated with each yeast gene: first () representing the promoter site of the gene that regulates its transcription, second () representing the DNA sequence (motif) that the gene’s product binds. The lengths of the two sequences are chosen randomly from the associated length distributions determined from the available biological data provided by Harbison et al. (2004). A gene is said to regulate gene if . No such exists unless the product of is a TF. For more details, we refer the reader to the original article.
Repeated generation of model networks with the same number of genes as in Yeast and different random number generator seeds forms the ensemble E2. Its typical members agree to very good accuracy with Yeast in terms of the in-, out-, and total-degree distributions, degree-degree correlation and the rich-club coefficient distributions. This ensemble further captures the hierarchical organization of Yeast’s TRN given by its -core analysis, as well as the frequencies of most 3-node motifs observed in Yeast (see Section 4.3). Due to its success in simultaneously reproducing several distributional features of Yeast’s TRN from a single mechanism and without any reference to the genetic sequence, E2 appears a meaningful alternative to E1. It is a null-hypothesis constructed by a bottom-up approach, providing a microscopic explanation for a number of “anomalous” distributions observed in Yeast’s TRN and taken for granted in randomized ensembles such as E1. However, as shown below, even a quantitative agreement on those frequently quoted features may veil some significant differences between the actual Yeast and the two ensembles.
3 Dynamics
3.1 Boolean network model
Several methods can be employed for simulating the time evolution of gene expression within a cell (Norrell et al., 2007). We here use a Boolean network model first proposed by Kauffman (1969), where the expression level of the gene at time is assumed (silent) or (expresed). The interaction between the regulatory genes and the regulated gene is deterministic and the time evolution is synchronous, so that
where is the number of edges incoming to the node (number of TFs regulating the gene), are the nodes connected to with incoming edges, and is a Boolean function determining the state of gene in presence of possibly multiple regulators.
Boolean dynamics of generic (such as, fixed in-degree (Kauffman, 1969), random (Aldana & Cluzel, 2003), power-law (Aldana, 2003)) networks have been of considerable interest for some time. Applications to biological systems include TRN models of Arabidopsis thaliana by Mendoza et al. (1999), Drosophila melanogaster by Albert & Othmer (2003), and the Yeast’s cell-cycle network studied by Li et al. (2004). Unlike most past work which focused on part of the TRN associated with a particular function, we here focus on the global dynamical behavior of yeast and yeast-like regulatory networks. A recent work by (Lee & Rieger, 2007) in the same spirit compares Yeast and E. coli on a full-scale.
Determining the time evolution of the network starting from a given initial state is straightforward once the regulatory functions are fixed. However, the nature of these interactions in the actual organism are too complex and far from being well understood. Therefore, instead of attempting to identify the functions that best describes the behavior of the yeast cell, we investigated the generic dynamical properties of the known architecture arising from a random choice of picked from a suitable collection.
It has been suggested that may be further restricted, based on the available experimental evidence, to certain subclasses of Boolean functions (Kauffman, 1993; Kauffman et al., 2003; Nikolajewa et al., 2007). These are
Simple Random Functions (RF): Each input is randomly assigned an output value of with a probability and otherwise.
Canalizing Functions (CF): It has at least one canalizing input, say , such that . and are called the canalizing value and the canalized output, respectively (Kauffman, 1993). For consistency, we set with probability and let be a simple random function of the remaining variables.
Nested Canalizing Functions (NCF): Also called Hierarchical Canalizing Functions, they were proposed by Kauffman et al. (2003) based on an earlier analysis due to Harris et al. (2002) and claimed to more closely mimic actual biological systems. All input variables of a NCF are canalizing and ordered in rank. The canalized output is determined by the highest ranking node at its canalizing value and is chosen to be with probability .
Special Nested Canalizing Functions (SNCF): Recently, gene regulation dynamics was observed to be consistent with a more restricted subclass of NCFs given by the Boolean expressions
| and | (1) |
where and the probability of occurance of the two functions were found to be and , respectively (Nikolajewa et al., 2007). The function classes above satisfy SNCF NCF CF RF.
A constraint on these functions is that each input variable should be relevant, so that they have an experimentally detectable regulatory signature. Accordingly, for each input of a function with inputs, there exists at least one input set , such that,
| (2) |
with . We ensure that the condition in Eq. (2) is satisfied in all cases.
Let be the fraction of inputs to that satisfy Eq. (2) for which the output equals calculated over all genes:
| (3) |
with total number of genes and is the Kronecker delta function. For the SNCF class, is not a free parameter but determined by the in-degree distribution of the network. For the rest of the function types we have in general, because Eq. (2) filters out some function assignments. In fact, the fraction of the Boolean functions satisfying Eq. (2) with inputs is well-known (Harrison, 1965):
| (4) |
where the denominators are : number of Boolean functions with inputs. For a fair comparison (except in the discussion on robustness), we adjusted the parameter for RF, CF, and NCF, so that , the value one obtains both for Yeast and the two ensembles with a SNCF assigned to each gene.
We will compare the impact of each function class on the system’s dynamics when implemented on the dynamically relevant core network of the TRN described in the next section.
3.2 Dynamically Relevant Core
The number of the dynamical attractors in a Boolean network is determined by a dynamically relevant core network (DRC) involving TFs only. DRC in Yeast is much smaller than the full transcriptional regulatory network and allows one to perform time-efficient simulations of the regulatory dynamics.
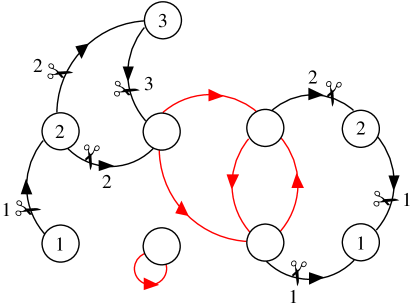
We define a global DRC for Yeast by recursively pruning all the nodes with zero in-degree or zero out-degree (see Fig. 1). Most of the genes in the transcriptional regulatory network of Yeast are “slave” genes that do not take part in the regulation process or do so merely in a downstream fashion. Their presence may effect the transient behavior or the size of the dynamical cycles the network eventually falls into, however they do not change the number of distinct steady-states (or attractors, see below) and their probabilities of occurance under different function assignments. These genes can be pruned by recursively eliminating nodes with zero out-degree.
In a similar fashion there exist a set of genes with zero in-degree, whose expression levels remain unchanged throughout the dynamics. Some of these are ’housekeeping’ genes that are always expressed to perform routine functions (such as RNA production) while others are fixed by the environmental conditions. We will consider the regulatory dynamics when the states of these genes are fixed and prune them as well, assuming that the averaging over different state assignments to such genes is properly accounted for by different function assignments on the remaining network. See the recent work by Lee & Rieger (2007) for an earlier implementation of this procedure on Yeast, while for a different reductionist approach see Paul et al. (2006).
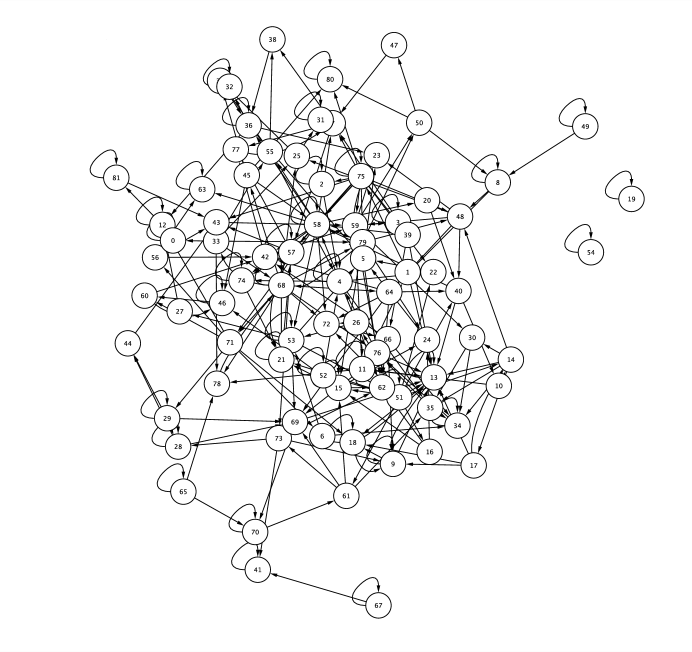
The end product (shown in Fig. 2 for Yeast) is a subnetwork where each node is a TF regulated by other genes in the DRC and/or by itself. Given that only of all the genes in Saccharomyces cerevisiae are TFs, described pruning process brings a sizeable reduction in the computation time. We found that Yeast’s dynamically relevant subnetwork contains TF genes and interactions between them.
Comparison of DRC sizes in Yeast vs reference ensembles
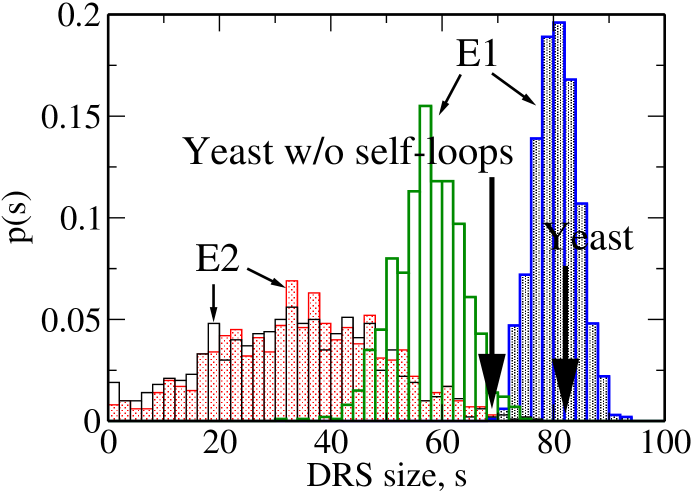
We also obtained the DRC for networks chosen from each ensemble. In the case of E2, ensuring that the samples before pruning have, on average, the same number of nodes and edges as Yeast’s TRN . The comparison of the three cases is shown in Fig. 3. The outcome is instructive: The distribution of the DRC size on E2 shows a big contrast with Yeast while the agreement with the edge-reshuffled ensemble E1 (with exactly the same in- and out-degrees at each node) is perfect when self-regulating genes are included and still better than E2 otherwise. (See next section for a discussion on self-regulating genes.) A similar situation is observed also for the number of interactions in the DRC. In view of the quantitative agreement of in- and out- degree-distributions between Yeast and E2 (Balcan et al., 2007), this result points to a subtle difference between the two ensembles that translates into a three-fold size difference in the respective DRCs.
There is no doubt that, a complete model of the regulatory dynamics should include the environmental inputs carried by the signaling pathways and the post-transcriptional regulatory interactions (Thomas, 1998; Samal & Jain, 2008). Accordingly, a complete DRC should include of both TFs and non-TF proteins (see, e.g. Li et al. (2004)). Nevertheless, the “transcriptional regulatory” DRC defined as above remains an intrinsic property of the organism, which in the case of Yeast appears to be significantly out of proportion.
3.3 Number of Attractors
The dynamical characterization of a TRN is complete once all the interactions (the network’s architecture) and the update functions of all genes are specified. The network state at the discretized time after update cycles can be expressed symbolically as
| (5) |
The time unit is assumed to be large enough to encompass all protein production related processes. Since the time evolution is deterministic, the number of possible dynamical trajectories is , i.e., the number of distinct initial conditions. is also the size of the state space, therefore each initial condition eventually ends up in a cycle which is called the for that initial state. A state is a member of the attractor if and only if for some integer . Minimal such is called the of the attractor cycle. The attractor is a fixed point if and a limit-cycle otherwise. Note that the attractor lengths (except those of the fixed points) are modified after the pruning process describe above, but the number of attractors is not. Therefore we focus on the statistics of their number below.
We note in passing that, the attractors of a transcriptional regulation network may be associated with the observable features of the organism. For example, the expression pattern of the segment polarity genes in Drosophila melanogaster can be mapped to the fixed point of the relevant regulatory subnetwork (Albert & Othmer, 2003). In Arabidopsis thaliana, the attractors of the regulatory subnetwork responsible from cell differentiation have been shown to correspond to different phenotypes (Mendoza et al., 1999).
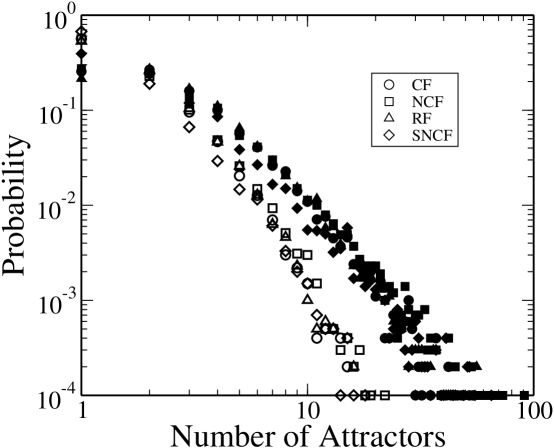
The number of attractors, , remains invariant as we switch from the full-size network to the DRC, but estimating its exact value is difficult due to the vast number of initial conditions that should be checked. However, by randomly sampling a small number of initial conditions, another - and possibly more relevant - measure of the number of attractors, , can be easily calculated. is obtained by properly weighting the attractor by its basin of attraction , the number of initial conditions that end up in . This procedure allows one to distinguish between, e.g. two network realizations (network + function assignments) with two attractors each, whose relative basin sizes are in the first case and in the second. It is fair to say that the first network realization has a single dominant attractor, while the second one has two. The generalization of this argument gives , where is the standard dynamical entropy of the network (see, e.g., Krawitz & Shmulevich (2007)):
| (6) |
where is the probability that a uniformly selected initial condition is in the basin of attraction of the attractor. Note that . The difference between the two attractor counts is demonstrated in Fig. 4 over the E2 ensemble.
We estimated the average number of attractors for Yeast’s DRC and the model DRCs. Since an exact enumeration is out of question with possible initial states (and unnecessary for estimating ), we randomly sampled initial conditions and followed their trajectories in time until an attractor was reached. The attractor was then characterized by the sequence of states in the cycle (or by the state id for fixed points) and the number of initial conditions that end up in each state were counted.
thus found for the networks were further averaged over different structures, with each structure analyzed using independent Boolean function assignments chosen from each of the classes above. Mean attractor numbers thus found for the E2 ensemble are , , and when the update functions were chosen from the classes RF, CF, NCF and SNCF, respectively. We deliberately omitted the error bars in the values reported above, because the distribution of the attractor number is highly skewed and has a fat tail, as shown in Fig. 4. A fair comparison with Yeast and E1 requires some more work and is presented below. However, except for a somewhat smaller average attractor count observed for SNCFs, neither on Yeast nor on the reference ensembles did we find a significant difference among the attractor statistics of different function classes.
3.4 Robustness of the dynamics
The survival of a cell relies on the continuously and reliable production of a vast amount of proteins in proper quantities. Therefore, the “equilibrium” gene expression profile (encoded here by an attractor) is expected to possess a certain level of stability, i.e., robustness to perturbations such as random fluctuations in expression levels or temporary malfunction of a gene. On the other hand, a certain level of responsiveness is also necessary in order to be able to cope with the environmental changes in longer time scales. This trade-off suggests that living organisms function in the vicinity of the order-chaos boundary, a hypothesis originally formulated by Kauffman (1993).
A dynamical system is said to be chaotic if a small perturbation introduced into one of its two, otherwise identical, copies drives them away from each other exponentially fast. Adopted to TRN dynamics, this amounts to monitoring in time the normalized “Hamming distance”
between the two copies and . The network’s robustness is then determined by
| (7) |
where the first limit ensures that the measured quantity is a steady-state property (a function of the attractors only), the second reflects that is a linear response function. is chosen to be a small time interval (one time step in our case) and the averaging is over possible perturbations (Aldana, 2003). The network is said to be chaotic if and ordered if (both in an average sense, for there may be particular perturbations in each case that result in the opposite behavior.) We will show below that, RF, CF, NCF and SNCF display significant variability in robustness on the Yeast and the model networks.
4 Yeast vs model networks
4.1 Attractor statistics
Performing the same analysis on Yeast’s TRN and E1, one finds that the average number of attractors is orders of magnitude larger for RF type functions. In fact, most of the initial conditions end up in different attractors, so that is capped by the number of initial conditions used for averaging. Such disagreement is too large to be explained by the mismatch in DRC sizes shown in Fig. 3. For an estimate of the network-size dependence of see, e.g., Drossel (2005) and Balcan & Erzan (2006).
Upon closer inspection, the excessive attractor number turns out to be due to another structural anomaly in Yeast: the presence of a large number of self-regulating genes. of all genes in the DRC ( out of ) are self-regulating (Teixeira et al., 2006) as opposed to (less than out of an average of - see Fig. 3) in E2 model. Note that a self-regulating gene is by definition a member of the DRC and is preserved under the edge shuffling process used for generating E1 networks. Each such node under synchronous Boolean dynamics potentially doubles the attractor count due to a parity effect. The excess of such nodes in Yeast’s TRN is well known (see, e.g., (Lee & Rieger, 2007)), although it can easily be missed in a structural comparison as in Balcan et al. (2007) unless specifically looked for. Its dynamical signature, however, is difficult to overlook. This example serves as a demonstration for how a comparative study of the dynamics may lead to the discovery of structural features specific to Yeast.
We next eliminate the self-loops from Yeast and both model networks, and reconstruct the DRCs. By doing so, we temporarily depart from a faithful representation of Yeast. On the other hand, we ensure that further discrepancies we may encounter originate from structural differences other than the high frequency of self-regulating genes in Yeast. The self-interactions will be restored in the next section.
| RF | CF | NCF | SNCF | |
|---|---|---|---|---|
| E1 | 1.9 | 1.8 | 1.8 | 1.7 |
| E2 | 1.6 | 1.6 | 1.6 | 1.5 |
| E2∗ | 1.7 | 1.6 | 1.7 | 1.6 |
| Yeast | 4.8 | 4.2 | 4.1 | 3.4 |
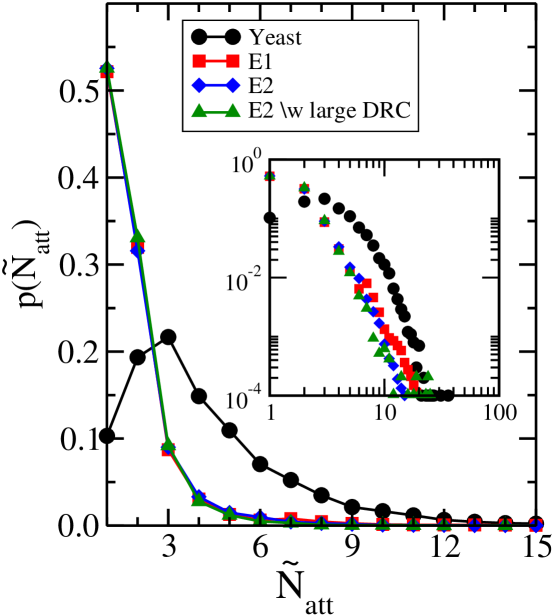
Interestingly, the histograms obtained from Yeast now differ significantly from those of both reference ensembles. Fig. 5 displays the contrast for RF type functions, while qualitatively the same picture is obtained also for other function classes. Majority of E1 and E2 model networks are dominated by a single attractor, while Yeast’s DRC typically has multiple attractors and and a nonmonotonous . The contrast between the average attractor numbers is shown in Table 1. The tail of the attractor number distribution obtained from Yeast is also markedly different, as shown in the inset of Fig. 5.
It is not possible to understand this dynamical anomaly of Yeast in terms of the
difference in the DRC sizes shown in Fig. 3. Because, first, the
mismatch in persists between E1 and Yeast which have
identical DRC sizes. Second, although a smaller “random” network is expected
to have a smaller number of attractors on average
(Drossel, 2005; Balcan & Erzan, 2006), we observed above that E1 and E2 networks
(without self-regulating nodes) which have approximately a factor of two size
difference come with almost the same number of attractors. We further
confirmed this second observation by repeating our analysis on a filtered
subset of E2 networks (again, without self-loops) whose number of TFs and the
number of interactions in the DRC are within of Yeast’s.
is essentially the same as before (also shown in Fig. 5). Therefore, we conclude that
1. Synchronous Boolean dynamics on DRC-type networks has an attractor
statistics with a much weaker size dependence than random networks,
2. Yeast’s TRN has certain structural elements that amount to a significant modification of its attractor statistics and
are not captured by either of the two model ensembles E1 & E2.
4.2 Robustness
We performed the analysis outlined above on Yeast and also on E1 and E2 networks with similar DRC sizes (and with self-interactions untouched) as described earlier. We found that, the robustness depends significantly on the type of the update function: the more restrictive the function set, the more robust is the dynamics (see Fig. 6). Maybe more relevant is the fact that, under fully random functions (RF) Yeast’s regulatory dynamics is chaotic for a wide range of values. In contrast, the nested canalizing functions ensure that the dynamics is stable, although it may be functioning close to the order-chaos boundary if one effectively has .
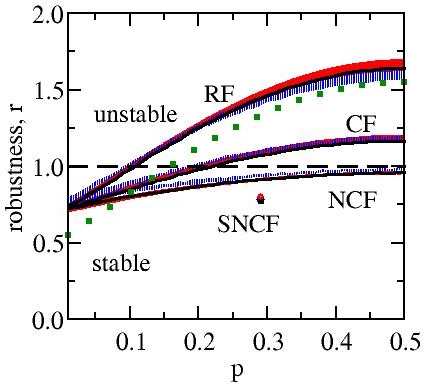
It is worthwhile pointing out that, results in Fig. 6 differ from the approximate analytical form formulated by Aldana (2003) and Derrida & Pomeau (1986):
| (8) |
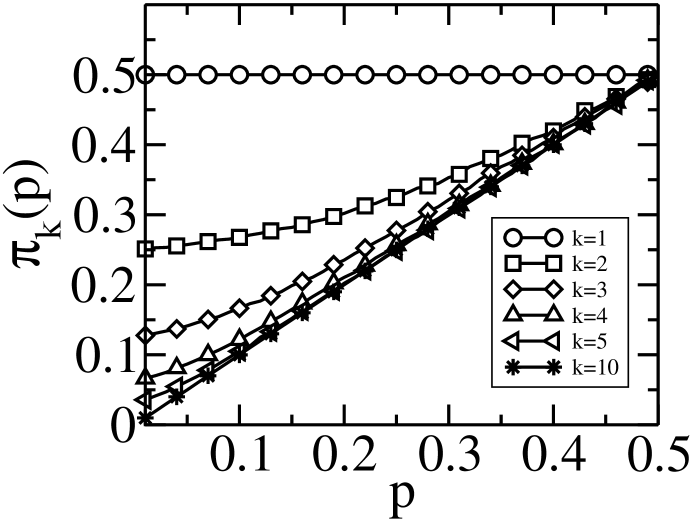
where is the average in-degree of the network. The disagreement is due to the condition given in Eq. (2). This experimentally imposed constraint renders the system relatively less robust with respect to an unbiased choice of the update functions, because functions filtered by Eq. (2) are insensitive to at least one of the input variables. As a result, the range of the robustness measure is squeezed into a narrower interval around the order-chaos boundary , conforming to the edge-of-chaos hypothesis of Kauffman (1993). Furthermore, as seen in Eq. (3.1), the constraint in Eq. (2) is not equally restrictive on all nodes. For example, a node with has independent of input value , whereas for we have . Generalizing Eq. (8) accordingly, we obtain
| (9) |
where is the fraction of nodes with in-degree . on the RF class is shown in Fig. 7. The CF and NCF classes give qualitatively similar behavior. The prediction of Eq. (9) on model networks with the RF-type functions is also plotted in Fig. 6 for comparison.
4.3 Motifs
Regulatory networks are known to exhibit an abundance of certain subgraphs (Milo et al., 2002). Prill et al. (2005) list the high frequency subgraphs for several organisms by comparing the TRN with an ensemble obtained by reshuffling the edges while keeping the total degree of each node fixed. They establish a connection between the network structure and its dynamics through the stability properties of each motif. In particular, the motifs (b),(f) and (g) in Table 2 were found relatively abundant (with a high z-score) in Yeast.
A similar investigation comparing Yeast’s (unpruned) TRN with the two reference ensembles E1 & E2 was reported earlier in Supplement 1 of (Balcan et al., 2007) and is worth re-examining here. Interestingly, the relatively high content of the motif (b) in Table 2 reported by (Prill et al., 2005) is found to be reproduced not only by E1 but also by the E2 ensemble (the relative frequency of the motif’s occurance is in the unpruned Yeast and E1 networks and in E2). Therefore, this feature should be associated with the basic matching mechanism of the transcriptional regulation process exploited in E2, and its high occurance rate in Yeast is guaranteed by the in- and out-degree statistics (hence the agreement with E1) that is encoded into the transcription factor binding sequence statistics.
On the other hand, cascaded regulation motif (a) and the feed-forward loop motif (f) of Table 2 appear respectively and more frequently in the unpruned Yeast network relative to E2. The excess of these two motifs in Yeast therefore require a different explanation, such as the stability considerations given by (Prill et al., 2005).
![[Uncaptioned image]](/html/0904.1515/assets/x7.png)
The discrepancy in the attractor statistics (or the lack of it in respective robustnesses) observed between Yeast and the reference model DRCs are likely to be related to their motif statistics. On the other hand, there is no a priori reason that the motif frequencies on the unpruned network quoted above should also apply to the DRC. Therefore we performed a similar analysis on the core networks of Yeast, E1 and E2 using Mfinder, the free motif-finder software from Alon Lab (Kashtan et al., 2004). The results are shown in Table 2.
Interestingly, the strong bias towards an excess of dynamically stable motifs such as (b) and (f) in Yeast does not persist in the DRC. At the same time, (d) and (e) in Table 2 involving mutually regulating TF pairs are 60-350% more frequent in Yeast in comparison to reference DRCs. These two motifs were labelled as partially stable by (Prill et al., 2005). Our results on network robustness shown in Fig. 6, where no significant difference can be seen between Yeast and the reference models under Boolean dynamics, are consistent with such motif statistics.
5 SUMMARY and DISCUSSION
We have investigated the dynamical properties of Yeast’s transcriptional regulatory network by means of Boolean functions with parallel (synchronous) update rules and compared them with two null-models that capture many of the global structural features found in Yeast. We found that, the core of the Yeast network (DRC) that determines the steady-state features of the dynamics is much larger than the unbiased model (E2) whose sole premise is that the regulation mechanism is based on sequence-specific binding of transcription factors.
Comparison of the average number of attractors (properly weighted by the basin size) reveals not only the well-known abundance of many self-regulating genes, but also further differences between the Yeast and model networks. In particular, we find that the architecture of the Yeast DRC typically permits several attractors, whereas the model networks -even after the differences in the number of self-regulating TFs and the core network sizes are eliminated- come typically with a single attractor. The tail of the attractor number distribution in Yeast is also noticably different. An important question is whether these features survive under a more realistic asynchronous time-evolution model, although our observations relating to the network structure remain valid independent of this choice.
A comparison of the network stability under minor perturbations reveals that the Yeast’s dynamical core is not more robust than either of the two reference models, in (apparent) contrast with earlier results. This observation is also supported by the presence of a different set of 3-node motifs that are found in relatively high proportions in Yeast when the DRC (rather than the whole regulatory network) is taken into account. The significantly frequent motifs in the DRC are dynamically less stable than those found in abundance in the full TRN of Yeast.
Upon visual inspection, it is not all too unexpected that the stable motifs (a-c)&(f) are found mostly on the “peripherals” of the network eliminated by the pruning process. However, it is interesting to observe how topology itself supports the robustness-responsiveness dichotomy in transcriptional regulation process. Robustness is associated with the peripheral components that carry the environmental signals downstream, i.e., small variations are filtered out before they reach the DRC. On the other hand, DRC itself is relatively more responsive than the embedding network to changes in the expression levels of its constituent genes. Favorably so, since such changes are likely to reflect shifts in operational conditions that are persistent enough to survive the downstream filtering.
Acknowledgements
We would like to thank A. Erzan, M. Mungan and D. Balcan for valuable discussions that led to the present work and a critical reading of the manuscript. We appreciate the help of D. Balcan for providing the model networks at an initial stage. This project was supported by TUBITAK through the grant TBAG-106T553.
References
- Albert & Barabási (2002) Albert, R. & Barabási, A. L. (2002). Statistical mechanics of complex networks. Rev. Mod. Phys. 74(1), 47–97.
- Albert & Othmer (2003) Albert, R. & Othmer, H. G. (2003). The topology of the regulatory interactions predicts the expressions pattern of the segment polarity genes in drosophila melanogaster. Journal of Theoretical Biology 223, 1–18.
- Aldana (2003) Aldana, M. (2003). Boolean dynamics of networks with scale-free topology. Physica D 185, 45–66.
- Aldana & Cluzel (2003) Aldana, M. & Cluzel, P. (2003). A natural class of robust networks. PNAS 100(15), 8710–8714.
- Balcan & Erzan (2006) Balcan, D. & Erzan, A. (2006). Dynamics of content based networks. In: ICCS 2006, Part III, LNCS 3993 (et al., V. N. A., ed.), Springer-Verlag. Berlin.
- Balcan et al. (2007) Balcan, D., Kabakçıoğlu, A., Mungan, M. & Erzan, A. (2007). The information coded in the yeast response elements accounts for most of the topological properties of its transcriptional regulation network. PLoS ONE 2(6), e501.
- Bergmann et al. (2003) Bergmann, S., Ihmels, J. & Barkai, N. (2003). Similirities and differences in genome-wide expression data of six organisms. PLOS Biology 2(1), 1–9. Www.plosone.org.
- Derrida & Pomeau (1986) Derrida, B. & Pomeau, Y. (1986). Random networks of automata: A simple annealed approximation. Europhysics Letters 1(2), 45–49.
- Drossel (2005) Drossel, B. (2005). Number of attractors in random boolean networks. Phys. Rev E 72, 016110.
- Guelzim et al. (2002) Guelzim, N., Bottani, S., Bourgine, P. & Kepes, F. (2002). Topological and causal structure of the yeast transcriptional regulatory network. Nature Genetics 31, 60–63.
- Harbison et al. (2004) Harbison, C., Gordon, D., Lee, T., Rinaldi, N., Macisaac, K. & et. al. (2004). Transcriptional regulatory code of a eukaryotic genome. Nature 431, 99–104.
- Harris et al. (2002) Harris, S. E., Sawhill, B. K., Wuensche, A. & Kauffman, S. (2002). A model of transcriptional regulatory networks based on biases in the observed regulation rules. Complexity 7(4), 23–40.
- Harrison (1965) Harrison, M. A. (1965). Introduction to Switching and Automata Theory. McGraw Hill, NY.
- Kashtan et al. (2004) Kashtan, N., Itzkovitz, S., Milo, R. & Alon, U. (2004). Efficient sampling algorithm for estimating subgraph concentrations and detecting network motifs. Bioinformatics 20(11), 1746–1758.
- Kauffman (1969) Kauffman, S. A. (1969). Metabolic stability and epigenesis in randomly connected nets. Journal Of Theoretical Biology 22, 437.
- Kauffman (1993) Kauffman, S. A. (1993). The Origins of Order. Oxford University Press, 1 ed.
- Kauffman et al. (2003) Kauffman, S. A., Peterson, C., Samuelsson, B. & Troein, C. (2003). Random boolean network models and the yeast transcriptional network. PNAS 100(25), 14796–14799.
- Krawitz & Shmulevich (2007) Krawitz, P. & Shmulevich, I. (2007). Basin entropy in boolean newtork ensembles. Physical Review Letters 98(15), 158701.
- Lee & Rieger (2007) Lee, D. & Rieger, H. (2007). Comparative study of the transcriptional regulatory networks of E. coli and yeast: Structural characteristics leading to marginal dynamic stability. Journal of Theoretical Biology 248(4), 618–626.
- Lee et al. (2002) Lee, T. I., Rinaldi, N. J., Robert, F., Odom, D. T., Bar-Joseph, Z., Gerber, G. K., Hannett, N. M., Harbison, C. T., Thompson, C. M., Simon, I., Zeitlinger, J., Jennings, E. G., Murray, H. L., Gordon, D. B., Ren, B., Wyrick, J. J., Tagne, J. B., Volkert, T. L., Fraenkel, E., Gifford, D. K. & Young, R. A. (2002). Transcriptional regulatory networks in saccharomyces cerevisiae. Science 298(5594), 799–805.
- Li et al. (2004) Li, F., Long, T., Lu, Y., Ouyang, Q. & Tang, C. (2004). The yeast cell-cycle network is robustly designed. PNAS 101(14), 4781–4786.
- Maslov & Sneppen (2005) Maslov, S. & Sneppen, K. (2005). Computational architecture of the yeast regulatory network. Phys. Biol. 2(4), S94–S100.
- Mendoza et al. (1999) Mendoza, L., Thieffry, D. & Alvarez-Buyyla, E. (1999). genetic control of flower morphogenesis in arabidopsis thaliana: a logical analysis. Bioinformatics 15(7/8), 593–606.
- Milo et al. (2002) Milo, R., Shen-Orr, S., Itzkovitz, S., Kashtan, N., Chklovskii, D. & Alon, U. (2002). Network motifs: simple building blocks of complex networks. Science 298(5594), 824–827.
- Nikolajewa et al. (2007) Nikolajewa, S., Friedel, M. & Wilhelm, T. (2007). Boolean networks with biologically relevant rules show ordered behavior. BioSystems 90(1), 40–47.
- Norrell et al. (2007) Norrell, J., Samuelsson, B. & Socolar, J. E. S. (2007). Attractors in continuous and Boolean networks. Phys. Rev. E 76(4), 046122.
- Paul et al. (2006) Paul, U., Kaufman, V. & Drossel, B. (2006). Properties of attractors of canalyzing random boolean networks. Phys. Rev. E 73, 026118.
- Prill et al. (2005) Prill, R. J., Iglesias, P. A. & Levchenko, A. (2005). Dynamic properties of network motifs contribute to biological network organization. PLOS Biology 3(11), 1881–1892.
- Samal & Jain (2008) Samal, A. & Jain, S. (2008). The regulatory network of e. coli metabolism as a boolean dynamical system exhibits both homeostasis and flexibility of response. BMC Systems Biology 2(21), 1–18.
- Spellman et al. (1998) Spellman, P. T., Sherlock, G., Zhang, M. Q., Vishwanath, R., Anders, K., Eisen, M. B., Brown, P. O., Futcher, B. & Fink, G. R. (1998). Comprehensive identification of cell cycle-regulated genes of the yeast saccharomyces cerevisiae by microarray hybridization. Molecular Biology of the Cell 12, 3273–3297.
- Teixeira et al. (2006) Teixeira, M. C., Monteiro, P., Jain, P., Tenreiro, S., Fernandes, A. R., Mira, N. P., Alenquer, M., Freitas, A. T., Oliveira, A. L. & Correia, I. S. (2006). The yeastract database: a tool for the analysis of transcription regulatory associations in saccharomyces cerevisiae. Nucl. Acids Res. 34, D446–D451.
- Thomas (1998) Thomas, R. (1998). Laws for the dynamics of regulatory networks. Int. J. Dev. Biol. 42, 479–485.
- Tuğrul & Kabakçıoğlu (2009) Tuğrul, M. & Kabakçıoğlu, A. (2009). Robustness of transcriptional regulation in yeast-like model boolean networks. International Journal of Bifurication and Chaos Accepted.
- Van Noort et al. (2004) Van Noort, V., Snel, B. & Huynen, M. (2004). The yeast coexpression network has a small-world, scale-free architecture and can be explained by a simple model. EMBO reports 5(3), 280.
- Wagner (1994) Wagner, A. (1994). Evolution of gene networks by gene duplications: a mathematical model and its implications on genome organization. Proceedings of the National Academy of Sciences 91(10), 4387–4391.
CAPTIONS
Figure 1: Extraction of DRC. A depiction of the pruning procedure used for extracting the
dynamically relevant core of Yeast. Numbers refer to the stage
of the recursive process at which the nodes/edges are removed. The red
edges are the interactions left in the DRC.
Figure 2: DRC of Yeast. The dynamically relevant subnetwork of the Yeast’s TRN obtained by
the pruning procedure described above.
Figure 3: DRC sizes: models vs. Yeast. The probability distribution function of the number of genes in the
DRC with (red and blue) and without (green and black) self-regulating genes.
Figure 4: Bare vs. weighted attractor count. The difference
between the probability distribution functions for (full)
obtained by plain counting and (empty) defined in the
text reflects the network’s preference towards an uneven basin-size
distribution. (By Eq. (6), if
attactors have equal basin sizes.) Presented data is obtained from the E2
ensemble only for reasons discussed in the text.
Figure 5: Number of attractors: models vs. Yeast. Probability distribution functions for the number of attractors in
Yeast () vs. model ensembles with update rules of type RF
after the self-loops are removed. Data obtained from E1 () and E2
() ensembles are shown together with those over a subset of the
E2 networks whose DRC sizes are in the same ballpark as that of Yeast’s
(). Inset shows the tails of the distibutions on a log-log
scale. Unit size bins were used for the histograms.
Figure 6: Robustness of Yeast and model networks. Robustness
of Yeast vs. model networks with equal DRCs. Horizontal
axis spans , since in Eq. (7) is symmetric with
respect to . Shaded regions indicate the range within one standard
deviation of E1 (red) and E2 (blue) reference results. Solid curves
represent Yeast. Horizontal dashed line is the border between ordered and
chaotic behavior. Dotted curve corresponds to the theoretical prediction for
the RF case obtained from Eq. (9).
Figure 7: Impact of the “relevance” condition. The unconditional
probability for a node with in-degree to be 1 obtained when
the Random Boolean functions (RF) with bias are subjected to the
constraint in Eq. (2). These functions are fed into
Eq. (9) in order to obtained an analytical estimate for the
network robustness. The larger the deviation from the diagonal the
stronger is the impact of the constraint.
Table 1: Average attractor number. Average attractor number obtained for each function class on the DRC
of the Yeast and the two reference ensembles. E2∗ refers to the E2
ensemble networks which have the same DRC size as Yeast.
Table 2: 3-node Motif statistics. Top 3-node motifs ordered according to their frequency of appearance in Yeast DRC. Lower percentages are those obtained from model networks with the same DRC size as Yeast’s.