Sulphur in the Globular Clusters 47 Tucanae and NGC 6752 ††thanks: Based on observations made with the ESO VLT-Kueyen telescope at the Paranal Observatory, Chile, in the course of the ESO-Large Programme 165.L-0263
Abstract
Context. The light elements Li, O, Na, Al, and Mg are known to show star to star variations in the globular clusters 47 Tuc and NGC~6752. Such variations are interpreted as due to processing in a previous generation of stars.
Aims. In this paper we investigate the abundances of the -element sulphur, for which no previous measurements exist. In fact this element has not been investigated in any Galactic globular cluster so far. The only globular cluster for which such measurements are available is Terzan 7, which belongs to the Sgr dSph.
Methods. We use high resolution spectra of the S i Mult. 1, acquired with the UVES spectrograph at the 8.2m VLT-Kueyen telescope, for turn-off and giant stars in the two globular clusters. The spectra are analysed making use of ATLAS static plane parallel model atmospheres and SYNTHE spectrum synthesis. We also compute 3D corrections from hydrodynamic models and apply corrections due to NLTE effects taken from the literature.
Results. In the cluster NGC 6752 sulphur has been measured only in four subgiant stars. We find no significant star to star scatter and a mean , consistent with what observed in field stars of the same metallicity. In the cluster 47 Tuc we measured S in 4 turn-off and 5 subgiant stars with a mean . While this result is compatible with no star to star scatter we notice a statistically significant correlation of the sulphur abundance with the sodium abundance and a tentative correlation with the silicon abundance.
Conclusions. The sulphur – sodium correlation is not easily explained in terms of nucleosynthesis. An origin due to atomic diffusion can be easily dismissed. The correlation cannot be easily dismissed either, in view of its statistical significance, until better data for a larger number of stars is available.
Key Words.:
Stars: abundances – Galaxy: globular clusters: individual: NGC 104 – Galaxy: globular clusters: individual: NGC 67521 Introduction
There is substantial consensus that the so-called -elements (O, Ne, Mg, Si, S, Ar, Ca, and Ti) are synthesized essentially during hydrostatic and explosive burning phases in massive stars, and then released in the interstellar medium when such stars undergo type II Supernova (SN) explosion (Chieffi & Limongi, 2004). As such, -elements provide crucial information to reconstruct the star formation history of stellar populations. O, Mg, Si, Ca, and Ti are easily measured in stellar spectra and are thus the most frequent choice in stellar abundance studies. S on the other hand is the natural choice when abundances are determined in the Interstellar Medium (ISM), Planetary Nebulae (PN), or extragalactic absorption systems (e.g. Damped Lyman Alpha systems, DLA) due to the ease of measuring it and its weak tendency to form dust. The extent to which stellar and ISM / PN / DLA -element enrichments are comparable is thus dependent on wether or not S is supposed to vary in lockstep with the other -elements.
Sulphur abundances in Milky Way (MW) stars have been obtained by several authors in the latest years (Nissen et al., 2007; Caffau et al., 2007; Ryde, 2006; Caffau et al., 2005b; Korn & Ryde, 2005; Nissen et al., 2004; Ryde & Lambert, 2004, among the most recent), but agreement on its behavior at low metallicities is not reached yet. While some of the cited authors (e.g. Nissen et al., 2007) find S to follow the same trend as other -elements ([S/Fe] showing a plateau at low metallicities), others point towards a steady growth of [S/Fe] with decreasing metallicity (Israelian & Rebolo, 2001; Takada-Hidai et al., 2002), or an increase in the scatter of [S/Fe] at low [Fe/H] (Caffau et al., 2005b). The cited debate can in fact be extended to the overall behavior of -elements: while the standard view of [/Fe] evolution with metallicity has for some time now assumed the presence of a plateau below [Fe/H]–1 (McWilliam, 1997), observations as well as models suggest the possibility of a continuing rise down to the lowest observed metallicities, at least for Mg and O (first pointed out by Abia & Rebolo 1989, and more recently by François et al. 2004, and González Hernández et al. 2008).
It is perhaps surprising that sulphur has been studied up to now almost exclusively in field stars. To our knowledge, the only analysis of the S abundance in globular clusters is also the only one for extragalactic stars (Caffau et al., 2005a, in Terzan 7, one of the globular clusters of the Sagittarius dwarf Spheroidal Galaxy), where it behaves consistently with the rest of the -elements studied in the cluster, showing a low ratio with iron typical of dwarf spheroidal systems (Tautvaišienė et al., 2004; Sbordone et al., 2007). But on the other hand, S measurements are totally missing in MW Globular Clusters (GC). Globular Clusters are somewhat peculiar environments regarding chemical enrichment, displaying some peculiar abundance anomalies and abundance correlations which have never been found elsewhere (for a review see Gratton et al., 2004). Among them the most well known is likely the so-called O-Na anticorrelation, which appears to be widespread in MW globular cluster stars, and the Mg-Al anticorrelation. The nucleosynthetic processes responsible for this are believed to be essentially understood, since the chemical yields match well the ones derived from p-capture processes occurring in (or near) regions where H is being burned via the CNO cycle at sufficiently high temperatures (Gratton et al., 2004). On the other hand, such a condition is reached during different phases of stellar evolution, so that the actual processing site is still debated, as well as the mechanism through which the enriched gas is dispersed inside the cluster (Ventura et al., 2002; D’Antona et al., 2005; Decressin et al., 2007). There is nevertheless some consensus that the yields should be released through slow moving ejecta, thus allowing the GC gravitational potential to retain them more easily.
2 Observational Data
The spectra analysed in this paper have been acquired in the course of the ESO-Large Programme 165.L-0263. Observations, atmospheric parameters and abundances for elements other than S have been presented in Gratton et al. (2001), Carretta et al. (2004), and Bonifacio et al. (2007). We are here concerned only with the dichroic #2, CD4 cross-disperser UVES@VLT (Dekker et al., 2000) spectra (setting centered at 760 nm). For most observations the slit width was of for a resolution of R43000. For the purpose of the sulphur measurement, only upper-red CCD data were used. Typical Signal-to-Noise ratios (S/N) in the range were of about 15-20 per resolution element. Sulphur abundances were determined for nine stars observed in 47 Tuc, four of them being turn off (TO) stars, 5 subgiants (SG). Four stars, all subgiants, were considered in NGC 6752. Typical exposure times were 1h per star for NGC 6752 SG stars, 2h per stars for 47 Tuc SG and 4h per stars (in both cases performing multiple 1h exposures) for 47 Tuc TO stars. An example of S i mult. 1 region is shown in fig. 1.
3 Analysis
The atmospheric parameters have been taken from Gratton et al. (2001) for the stars in NGC 6752 and from Carretta et al. (2004) and Bonifacio et al. (2007) (for star 952) for the stars in 47 Tuc. 47 Tuc stars have a typical temperature of 5800 K for the TO stars ( g=4.05) and of 5100 K for the subgiants ( g=3.84), the four NGC 6752 share the same atmosphere parameters, =5347 K g=3.54. For each star we computed a model atmosphere using version 9 of the ATLAS code (Kurucz, 1993b, 2005a) running under Linux (Sbordone, 2005; Sbordone et al., 2004). We used the updated Opacity Distribution Functions of Castelli & Kurucz (2003) with microturbulent velocity of 1 and enhancement of -elements. The synthetic spectra were computed using the SYNTHE suite (Kurucz, 1993b, 2005a) running under Linux (Sbordone, 2005; Sbordone et al., 2004).
The strongest lines of S i in the optical range are the lines of Mult. 1 (three lines around 923 nm) and of Mult.6 (two lines at 869 nm, see Table 1). We were unable to convincingly detect the lines of Mult. 6 in any of our spectra, we therefore did not even search for Mult. 8 ( around 675 nm) which is weaker. Our analysis is therefore based exclusively on the lines of Mult. 1. We adopt the values of the NIST database, which holds the values of Wiese et al. (1969), which are experimental but of D quality, corresponding to a possible error up to 50 % (see Table 1 for the values). A thorough discussion of the available values for S i atomic data is avilable Caffau et al. (2005b).
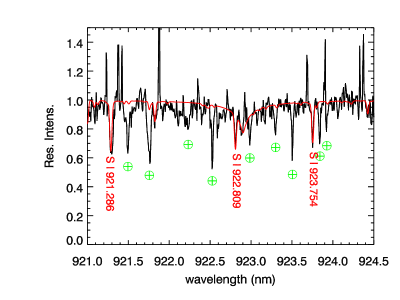
The lines are in a spectral range contaminated by telluric absorption, so that they are rarely all free from telluric contamination. Moreover, due to the low metallicity of the two clusters examined and to the low S/N ratio of the spectra, in most cases, only one of the S i lines of Mult. 1 is detectable. Due to the radial velocity of the clusters, the line which happens to be the most often unblended is the one at 922.8 nm, that is the line laying on the wing of the hydrogen Paschen line. The measurement of the equivalent width (EW) of lines falling on the wings of broad features is not easy, and produces a value which is usually lower, with respect to the true EW, by about 5% (Caffau et al., 2005b). To determine the sulphur abundance a line profile fitting procedure, taking into account the profile of the Paschen is to be preferred. The other two lines of Mult. 1 are far enough from the Paschen not to be affected by it, so that for these lines the EW measurement would be a good choice. To keep the analysis as homogeneous as possible we nevertheless decided to determine the sulphur abundance using line profile fitting for all the unblended features. Such fitting was performed by means of the code described in Caffau et al. (2005b). In the fitting procedure, the line broadening was kept fixed at the instrumental level (7 km/s). At this resolution, and with this S/N ratio, typical macroturbulent and/or rotational broadening would not affect the measurement significantly. We discarded the lines contaminated by telluric absorption because the telluric line subtraction from a spectrum decreases the S/N that is already low. Also, we did not possess fast rotator spectra taken at the same time as the science exposures, which would have imposed to rescale the telluric features, an operation which would add further uncertainty to the measurement. Line-by-line S abundances are listed in Table 1.
| 921.286 nm | 922.809 nm | 923.754 nm | |
|---|---|---|---|
| gf | 0.42 | 0.26 | 0.04 |
| NGC 6752 | |||
| 1406 | 5.80 | 6.07 | 6.04 |
| 1665 | – | 6.35 | 6.29 |
| 1461 | – | 6.35 | 6.37 |
| 1481 | – | 6.35 | 6.36 |
| 47 Tuc | |||
| 1012 | – | 6.56 | – |
| 1081 | – | 6.68 | – |
| 952 | – | 6.63 | – |
| 975 | – | 6.72 | – |
| 201075 | 6.65 | 6.86 | 6.43 |
| 206415 | 6.73 | – | – |
| 429 | – | 6.87 | – |
| 433 | – | 6.87 | – |
| 482 | – | 6.80 | – |
The S i lines of Mult. 1 are known to suffer from departures from LTE (Takeda et al., 2005). We therefore applied the NLTE corrections, interpolated in table 2 of Takeda et al. (2005) to take this effect into account. For our programme stars these are all negative and range between –0.1 and –0.3 dex.
3.1 Estimation of analysis uncertainties
Uncertainty in the S abundance determination stems from both the limited S/N ratio of the spectra and the systematics of the analysis. To determine the effect of S/N we followed the same method described in Caffau et al. (2005b), namely by performing Monte Carlo simulations. In that paper the error estimates are obtained for a sample of dwarf stars with [Fe/H]=–1.5. We have performed additional Monte Carlo tests to assess the sensitivity of the S lines in the SG stars ( being the only parameter showing a significant difference between TO and SG stars), and to ascertain that such uncertainties apply to the more metal rich objects of 47 Tuc and came up with values which are essentially identical to the ones in Caffau et al. (2005b), which we will then assume from now on.
Concerning random errors, the result of a 1000-events simulations, for a parameter set compatible with the TO stars set, indicates an 1 uncertainty (for a single line) of 0.12 dex for S/N=30, and 0.22 dex for S/N=15. The same values hold for the SG stars. Given the typical S/N of our spectra, we will assume henceforth a typical uncertainty of 0.2 dex to be due to the S/N.
For the TO sample, a change in of 0.25 dex causes a 0.08 dex variation in A(S), 100 K in temperature cause a variation of 0.06 dex in A(S), while [Fe/H]0.2 dex induces a 0.03 dex variation in A(S). Comparing with table 3 of Carretta et al. (2004) one notices that both and variations act in opposite senses on [Fe/H] and on A(S). On the one hand, has a maximum stated error in Carretta et al. (2004) of 0.08 dex. Taking into account both the effect on metallicity and the one on A(S), this would lead to a variation of 0.03 dex in [S/Fe], negligible in the present scope.
On the other hand, Carretta et al. (2004) claim a maximum error of 90 K for TO stars and 60 K for subgiants. Shifting the whole temperature scale rigidly would not make or break the [S/Fe] spread we observe, but one could argue that the Carretta et al. (2004) scale might be excessively “compressed”. By lowering the TO stars temperature and rising the one of the subgiants by the maximum amount stated, one would reduce significantly the observed [S/Fe] spread. A 90 K lower temperature for the TO stars would lower their [Fe/H] by 0.08 dex. The effect on S would then be due both to the reduced and to the decreased metallicity, the total effect being roughly A(S)=+0.04 dex. A similar calculation for the SG stars leads to A(S)=–0.03, which become [S/Fe]=+0.12 for the TO and –0.09 for the SG. This would reduce the [S/Fe] spread by 0.21 dex, eliminating something less than half of it. On the other hand, such a change would lead [Fe/H] to differ between TO and SG stars. Currently, the two subgroups give precisely the same metallicity (–0.67) with a dispersion of 0.02 dex among TO stars and 0.01 dex among SG stars. Applying the aforementioned opposite temperature differences would separate the TO and SG stars by 0.14 dex in metallicity, roughly five times the quadratic sum of the two group uncertainties. We therefore suggest that any bias is very likely to be a simple additive shift to both TO and SG stars temperature. It is also worth noting that some imbalance (0.13 dex) exists between Fe i and Fe ii abundances in the giants sample of Carretta et al. (2004). According to Carretta and collaborators’ error budget, this would be entirely solved by rigidly increasing the in subgiants by 100 K. Again, a rigid shift of the scale would not affect the spread in A(S) nor in [S/Fe], and would also break the ionization equilibrium in the TO sample. Shifting the giant sample only would reduce the spread in sulphur abundance, but generate a Fe abundance spread. Besides, any increase in the subgiants would mainly affect Fe i, raising its abundance. A discrepancy already exists between Carretta et al. (2004) and Koch & McWilliam (2008) [Fe/H] scales, Koch & McWilliam (2008) deriving an average [Fe/H] lower by 0.09 dex. Such a discrepancy would be worsened, should the temperature for the Carretta et al. (2004) subgiants be increased.
3.2 3D corrections
We computed 3D corrections for the S i 922.8 nm line, for a set of atmosphere models encompassing the parameters of our program stars. In Table 2 we present the resulting values. Assuming an equivalent width of 12 pm (typical for the observed stars), we tabulate the difference between the abundance needed to reproduce the Equivalent Width (EW) in the 3D CO5BOLD model (Freytag et al., 2002; Wedemeyer et al., 2004) and the one needed when using the comparison 1DLHD model (Caffau et al., 2007). As such, the 3D abundance is obtained by adding the correction to our 1D abundances. Table 2 reports the model parameters as well. 3D corrections appear to be on average 0.15 dex and positive, and appear highly homogeneous across the explored parameter space. In particular, the differences in the corrections for TO and SG stars are small. They have not been added to our measurements in the table and in the figures, since comparison elements, in this and other studies do not have 3D corrections applied.
| [Fe/H] | Corr. | ||
|---|---|---|---|
| 5000 | 4.0 | 0.0 | 0.141 |
| 5000 | 4.0 | –1.0 | 0.140 |
| 4920 | 3.5 | 0.0 | 0.146 |
| 4930 | 3.5 | –1.0 | 0.167 |
4 Results
| Star | N | [S/Fe] | [Na/Fe] | [Mg/Fe] |
|---|---|---|---|---|
| 1406 | 3 | +0.19 | +0.02 | |
| 1665 | 2 | +0.54 | +0.10 | |
| 1461 | 2 | +0.58 | +0.29 | |
| 1481 | 2 | +0.57 | +0.54 |
| Star | log g | N | [S/Fe] | [Fe/H] | [Na/Fe] | [Mg/Fe] | [Si/Fe] | |
|---|---|---|---|---|---|---|---|---|
| K | cgs | dex | dex | dex | dex | dex | ||
| 1012 | 5832 | 4.05 | 1 | |||||
| 1081 | 5832 | 4.05 | 1 | |||||
| 952 | 5832 | 4.05 | 1 | |||||
| 975 | 5832 | 4.05 | 1 | |||||
| 201075 | 5165 | 3.84 | 3 | |||||
| 206415 | 5112 | 3.84 | 1 | |||||
| 429 | 5081 | 3.84 | 1 | |||||
| 433 | 5106 | 3.84 | 1 | |||||
| 482 | 5090 | 3.84 | 1 |
Our results are summarised in Tables 3 and 4. For the reader’s information we report there also some information on our program stars extracted from Gratton et al. (2001) and Carretta et al. (2004). The other abundances coming from these papers are always 1D-LTE values, with the exception of Na, which had NLTE corrections applied according to Gratton et al. (1999). We adopted a solar sulphur abundance of A(S)=7.21 in the [S/Fe] determination.
In NGC 6752, due to its low metallicity ([Fe/H]=1.43), we were only able to measure the sulphur abundance in the four subgiant stars. In the fainter TO stars the S/N ratio was too low to detect the S i lines. From the four subgiants we derive . Our estimated error on the sulphur abundances is 0.2 dex, dominated by the noise in the observed spectra. Thus the dispersion around the mean is fully compatible with the errors. Moreover, [S/Fe] in NGC 6752 is fully compatible with the value found among field stars at this metallicity (see Caffau et al. 2005b figure 10).
For the more metal-rich cluster, 47 Tuc, we have been able to measure at least one S i line for all the stars. In star 201075 all the three lines of Mult. 1 were measurable. The [S/Fe] ratio varies by almost 0.5 dex, with an average value of . Given that the uncertainty in the S abundance in each star is estimated at 0.2 dex, the observed spread can in fact simply reflect the measurement uncertainty. Moreover, as in the case of NGC 6752, the mean [S/Fe] is totally compatible with the value displayed by field stars of abundance comparable to 47 Tuc (Caffau et al., 2005b).
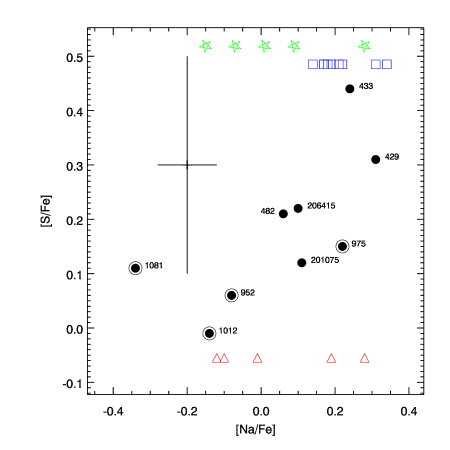
47 Tuc is believed to display Na-O as well as Mg-Al abundance anti-correlations (Carretta et al., 2004). We thus decided to check for possible correlations between S and some of the cited elements. Sulphur has never been measured before in 47 Tuc but interesting insight can be gained regarding other elements by comparing Carretta et al. (2004) with the ones obtained by Brown & Wallerstein (1992), Alves-Brito et al. (2005), and Koch & McWilliam (2008). In Fig. 2 [S/Fe] is plotted against [Na/Fe]. Black filled circles represent our data, points surrounded by a slightly larger circle indicate TO stars, and every data point is flagged with the corresponding star number. The typical size for the error is also indicated. Brown & Wallerstein (1992), Alves-Brito et al. (2005), and Koch & McWilliam (2008) do not measure sulphur, but for reference we add their values for [Na/Fe]: blue open squares for Koch & McWilliam (2008) red open triangles for Brown & Wallerstein (1992), and green open stars for Alves-Brito et al. (2005). The correlation between Na and S abundance is clearly apparent in our data, and a Kendall rank correlation test in fact determines that the likelihood of [Na/Fe] and [S/Fe] to be correlated is 97.8%111 This is equivalent to say that the likelihood of the null hypothesis is 2.2 %. This is the likelihood that random errors applied to otherwise uncorrelated distributions might produce a level of correlation () equal or superior to the observed one.. Another interesting thing to notice is how all the studies with the exception of Koch & McWilliam (2008) detect a significant spread in the Na abundance.
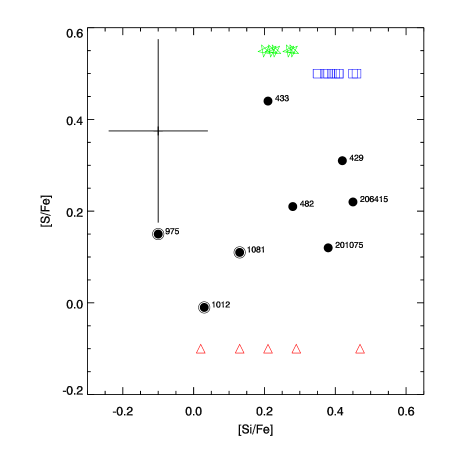
In Fig. 3 we instead plot [S/Fe] versus [Si/Fe], all the symbols being the same as in Fig. 2. Again, there is an evident suggestion of a correlation, with the exception of star 433 which, while having a very high S abundance, presents a less extreme [Si/Fe]. Likelihood of the correlation from Kendall test is here about 79%, but grows to 91% if star 433 is removed from the sample. By removing star 433 from the [Na/Fe] vs [S/Fe] correlation test, one gets on the other hand a slight decrease of the correlation likelihood, down to 94%. It is worth noting how star 433 has, according to Carretta et al. (2004), an unusually low [Fe/H] (0.14 dex below the average, way beyond the scatter of the Fe i abundances), and an unsatisfactory Fe i-Fe ii ionization equilibrium (0.21 dex difference). Since no evidence ever emerged of 47 Tuc showing a spread in iron abundance, one might regard these results as suggestive of some problem in the analysis of star 433. If we tentatively assign the average Fe abundance ([Fe/H]=–0.66) to star 433, we obtain [S/Fe]=0.32, more in line with the rest of the sample. In fact, star 433 has a [S/H] exceeding by just 0.14 dex the average value (=–0.48. [S/H]433=–0.34).
Given the fact that most low-S stars (and low-Na stars) are TO stars, it is worth investigating whether diffusion in the stellar atmosphere might be responsible for the observed abundance spread and its correlation with the Na abundance. One would in this case expect TO stars to be most affected by diffusion, while SG stars should not display them anymore due to the deeper reach of their atmospheric convective zone. According to current models this is not a viable explanation of the observed spreads. According to Korn et al. (2007) (fig. 1), by using a model with radiative acceleration and turbulent mixing, an old [Fe/H]=–2 TO star shows photospheric depletion of about 0.25 dex in Na, 0.20 dex in S and 0.15 dex in Fe. The effect would be then 0.05 dex on [S/Fe] and 0.1 dex in [Na/Fe], too small to explain the observations.
5 Discussion
The sulphur abundance in NGC 6752 agrees with the general trend of -elements in the field, and does not present any significant spread. In 47 Tuc the situation is less clear. The presence of a significant correlation between the S and Na abundance, and the hint of a S/Si correlation, suggest that the S abundance spread might indeed be real.
Recently Koch & McWilliam (2008), in a thorough analysis of 47 Tuc, based on high quality spectra of bright giants, found only a very limited spread in abundances, and were unable to confirm the presence of a significant spread in O, Na, Al and Mg. Such discrepancy with the results of Brown & Wallerstein (1992), Carretta et al. (2004), Alves-Brito et al. (2005), and Bonifacio et al. (2007) has not found to date a satisfactory explanation. This is not the venue to reassess in detail the work of the cited authors. Suffice to say that, applying an error analysis similar to the one above sketched for sulphur, the reality of the spreads in 47 Tuc as well as their correlation appear difficult to dismiss.
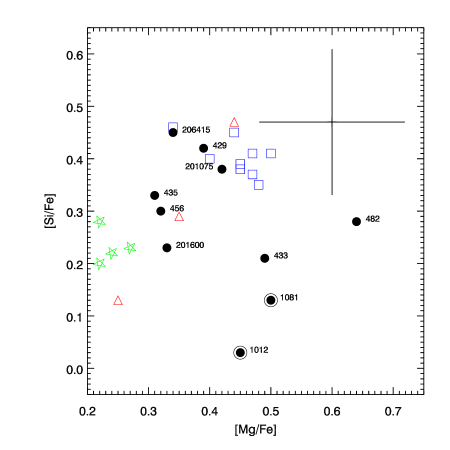
In Fig.4 we plot [Si/Fe] versus [Mg/Fe] for our stars (abundances are taken from Carretta et al., 2004), the sample of Brown & Wallerstein (1992) and the one of Koch & McWilliam (2008). Symbols are the same as in Fig. 2 and 3. The first thing that can be noted here is that, with the exception of star 482222 star 482 is indeed suspect in a more general way, presenting the largest Fe i - Fe ii imbalance of the whole Carretta et al. (2004) sample. , our sample and the one of Koch & McWilliam (2008) present in fact the same spread in [Mg/Fe], but a very different one in [Si/Fe]. A word of caution should be here given regarding silicon: it appears that Si shows a systematic discrepancy between TO and RGB in extremely metal poor stars (McWilliam, 1997; Cohen et al., 2004; Bonifacio et al., 2009). The reasons of the discrepancy are not known, NLTE effects being a possibility. The sense and amount of the discrepancy is compatible with the one seen here, so there exists the possibility that the Si spread is not real. On the other hand, such an effect has never been reported on stars as metal rich as the ones in 47~Tuc. Another element for which the various authors do not reach a satisfactory agreement is Ca. Average [Ca/Fe] is 0.34 in Koch & McWilliam (2008), 0.18 in Carretta et al. (2004), but solar according to Brown & Wallerstein (1992) and Alves-Brito et al. (2005).
Another important aspect is of course constituted by the existence of significant correlations among the abundances. One might consider as worrying the fact that all the TO stars of the sample exhibit a low S abundance. On the other hand, star 201075, which is a subgiant, and the one star where all the three lines of Mult. 1 were measured, shows low S as well. By examining Table 1 one might notice that the line at 922.8 nm gives the highest abundance for star 201075. Since this line is the one most frequently measured in the other stars, one might object that, had it been the only one measured, the star would have assigned an higher abundance, compatible with the other subgiants. It has although to be noted that in NGC 6752 both this line and the one at 923.7 nm are systematically measured, and no sign exist of the latter giving a lower abundance. As detailed in sect. 3.1, the quoted uncertainty would in principle be sufficient to remove the spread between TO and subgiant stars, if TO stars temperature was lowered and SGB stars temperature increased. On the other hand, this would make star 201075 even more discrepant, and induce a Fe abundance spread between TO and SGB stars.
Furthermore, a Monte Carlo simulation of 1000 events has been performed to check the likelihood that a significant correlation might emerge in the [S/Fe] vs. [Na/Fe] plot when the quoted errors are superimposed to a constant [S/Fe] for all the stars. Unsurprisingly, the result (2% likelihood) confirms the result of the Kendall null-hypothesis probability. It is very unlikely that random errors might have produced the observed Na / S correlation.
In short, we believe that strong hints of a S abundance inhomogeneity in 47 Tuc do exist. It is nevertheless clear that the currently available data do not allow, due to a combination of low statistics and significant uncertainties, to clarify the matter. Further study would thus be in order, specifically targeting a large number of stars from TO to RGB, and focusing on the elements that show significant spreads. Still, being unable to justify the current observations by means of either random or systematic uncertainties, we feel compelled to look for a nucleosynthetic explanation. The Na-O anticorrelation is usually explained by self pollution within the cluster by slow Na-rich winds, either from AGB stars or from massive rotating stars. In general, the stars of pristine cluster composition are expected to show low Na abundance, while a higher abundance is indication of “polluted” stars. Should Si and S abundance spreads be confirmed, and should they both correlate with the Na spread (which is quite uncertain in the Si case), this would pose at least two problems.
First, since Na-poor stars are Si-poor and S-poor as well, the aforementioned model would indicate them as the “unpolluted” stars. 47 Tuc would then have formed with an unusual low abundance of Si and S, at variance e.g. with Mg. Low [/Fe] ratios are indeed observed in dwarf galaxies, but typically attributed to environmental effects (e.g. Lanfranchi & Matteucci, 2007), and no evidence exist that they might privilege one explosive product (e.g. Si) over another (e.g. Mg).
Second, as just noted, both Si and S are believed to be, almost exclusively, products of SN II explosive burnings. Elementary models forbid globular clusters to be chemically enriched by internal SN explosions, since the total released energy is comparable to the cluster binding energy, and even one single SN II explosion should remove all the available gas from the cluster potential well, and stop the star formation. This is the reason why “slow wind” mechanisms have been invoked to produce e.g. the Na pollution. At the same time, the lack of any detectable spread in Fe abundance in 47 Tuc constitutes an additional problem, since one would expect some amount of Fe to be produced by the SN along with -elements. On the other hand, such simplistic considerations provide likely too crude a model of the actual phenomenon, since they assume a spherically symmetrical, central explosion which energy is efficiently transferred to the cluster gas. SN II explosion are in fact rarely spherically symmetrical (Wang & Wheeler, 2008). Instead, they tend to release a large part of the energy along more or less collimated jets which are not efficient in transferring the energy to the cluster ISM. Moreover, SN which explode in a non-spherically symmetrical way tend to produce larger fallback, which would in turn limit their Fe yield, thus eliminating the “missing Fe spread” problem. It is also suggestive that detailed models of stellar superclusters foresee a destructive interference among shock waves from different supernovae, within a given critical radius (Wünsch et al., 2008). As a result the inner part of the cluster would not only retain the yields, but also experience an accelerated star formation. Whether this might be the case on the smaller scale of normal GC (or whether some/all the GC might form as superclusters) is anyway uncertain. Core collapse SN are a source of Na as well, and we see that the Na abundance correlates well with the S abundance. The applicability of the aforementioned model thus relies on the (yet unexplored) possibility that high Na-yield and high -yield (or at least high S-yield) happen together.
An alternate way to produce S and Si would be through proton capture reactions. This is the same source invoked to explain the Na overabundance, which would be an obvious advantage. On the other hand, S should this way be produced through the reaction. The phosphorus abundance in 47 Tuc is unknown, and in general, knowledge about P production channels and abundances in stars are sketchy at best (see Caffau et
al., 2007, and references therein). However, P in the Sun is roughly 3 dex less abundant than S. If the same abundance ratio holds at lower metallicities, it would be impossible to produce any significant amount of S at expenses of P. Phosphorus should then be formed at expenses of Si, which should then anticorrelate with S, which is not the case. The next abundant enough seed is Mg (Mg Al Si P S), which indeed might show weak signs of anti-correlation with Si (Fig. 4), although they are below any statistical significance. Given the very scarce knowledge about P abundances and production mechanisms, one might even suppose the “original” 47 Tuc P abundance to be heavily enhanced, thus providing enough seeds to form 0.2 dex of S. P abundance has never been measured in 47 Tuc, but its abundance has been determined very recently in Horizontal Branch (HB) stars in NGC 6397 and NGC6752 (Hubrig et al., 2009), where it appears strongly enhanced, by more than 2 dex in NGC 6752, and almost 3 dex in NGC 6397. Chemical anomalies in HB stars are usually attributed to diffusion effects, but the current models (Michaud et al., 2008) do not seem to be account for more than 0.7 dex of P enhancement in the photospheres of HB stars of similar temperature. We thus think that the possibility of an enhancement of P abundance in globular clusters cannot be ruled out at the moment.
Acknowledgements.
We whish to thank the anonymous referee for the useful comments who really helped to improve the paper. The authors L.S., H.-G.L., P.B. acknowledge financial support from EU contract MEXT-CT-2004-014265 (CIFIST). This research has made use of the SIMBAD database, operated at CDS, Strasbourg, France, and of NASA’s Astrophysics Data System.References
- Abia & Rebolo (1989) Abia, C., & Rebolo, R. 1989, ApJ, 347, 186
- Alves-Brito et al. (2005) Alves-Brito, A., et al. 2005, A&A, 435, 657
- Bonifacio et al. (2009) Bonifacio, P., et al. 2009, arXiv:0903.4174
- Bonifacio et al. (2007) Bonifacio, P., et al. 2007, A&A, 470, 153
- Brown & Wallerstein (1992) Brown, J. A., & Wallerstein, G. 1992, AJ, 104, 1818
- Caffau et al. (2007) Caffau, E., Faraggiana, R., Bonifacio, P., Ludwig, H.-G., & Steffen, M. 2007, A&A in press, arXiv:0704.2335
- Caffau & Ludwig (2007) Caffau, E., & Ludwig, H.-G. 2007, A&A, 467, L11
- Caffau et al. (2007) Caffau, E., Steffen, M., Sbordone, L., Ludwig, H.-G., & Bonifacio, P. 2007, A&A, 473, L9
- Caffau et al. (2005a) Caffau, E., Bonifacio, P., Faraggiana, R., & Sbordone, L. 2005, A&A, 436, L9
- Caffau et al. (2005b) Caffau, E., Bonifacio, P., Faraggiana, R., François, P., Gratton, R. G., & Barbieri, M. 2005, A&A, 441, 533
- Carretta et al. (2004) Carretta, E., Gratton, R. G., Bragaglia, A., Bonifacio, P., & Pasquini, L. 2004, A&A, 416, 925
- Castelli & Kurucz (2003) Castelli, F. & Kurucz, R. L. 2003, in IAU Symposium 210, “Modelling of Stellar Atmospheres” ed. N. Piskunov, W. W. Weiss, & D. F. Gray, 20P
- Chieffi & Limongi (2004) Chieffi, A., & Limongi, M. 2004, ApJ, 608, 405
- Cohen et al. (2004) Cohen, J. G., et al. 2004, ApJ, 612, 1107
- D’Antona et al. (2005) D’Antona, F., Bellazzini, M., Caloi, V., Pecci, F. F., Galleti, S., & Rood, R. T. 2005, ApJ, 631, 868
- Decressin et al. (2007) Decressin, T., Charbonnel, C., & Meynet, G. 2007, A&A, 475, 859
- Dekker et al. (2000) Dekker, H., D’Odorico, S., Kaufer, A., Delabre, B., & Kotzlowski, H. 2000, Proc. SPIE, 4008, 534
- François et al. (2004) François, P., Matteucci, F., Cayrel, R., Spite, M., Spite, F., & Chiappini, C. 2004, A&A, 421, 613
- Freytag et al. (2002) Freytag, B., Steffen, M., & Dorch, B. 2002, Astronomische Nachrichten, 323, 213
- González Hernández et al. (2008) González Hernández, J. I., et al. 2008, A&A, 480, 233
- Gratton et al. (2004) Gratton, R., Sneden, C., & Carretta, E. 2004, ARA&A, 42, 385
- Gratton et al. (2001) Gratton, R. G., et al. 2001, A&A, 369, 87
- Israelian & Rebolo (2001) Israelian, G., & Rebolo, R. 2001, ApJ, 557, L43
- Gratton et al. (1999) Gratton, R. G., Carretta, E., Eriksson, K., & Gustafsson, B. 1999, A&A, 350, 955
- Hubrig et al. (2009) Hubrig, S., Castelli, F., De Silva, G., Gonzalez, J. F., Momany, Y., Netopil, M., & Moehler, S. 2009, arXiv:0903.5182
- Koch & McWilliam (2008) Koch, A., & McWilliam, A. 2008, AJ, 135, 1551
- Korn et al. (2007) Korn, A. J., Grundahl, F., Richard, O., Mashonkina, L., Barklem, P. S., Collet, R., Gustafsson, B., & Piskunov, N. 2007, ApJ, 671, 402
- Korn & Ryde (2005) Korn, A. J., & Ryde, N. 2005, A&A, 443, 1029
- Kurucz (1993b) Kurucz, R. 1993b, SYNTHE Spectrum Synthesis Programs and Line Data. Kurucz CD-ROM No. 18. Cambridge, Mass.: Smithsonian Astrophysical Observatory, 1993., 18
- Kurucz (2005a) Kurucz, R. L. 2005a, Memorie della Società Astronomica Italiana Supplementi, 8, 14
- Lanfranchi & Matteucci (2007) Lanfranchi, G. A., & Matteucci, F. 2007, A&A, 468, 927
- McWilliam (1997) McWilliam, A. 1997, ARA&A, 35, 503
- Meynet & Maeder (2002) Meynet, G., & Maeder, A. 2002, A&A, 390, 561
- Michaud et al. (2008) Michaud, G., Richer, J., & Richard, O. 2008, ApJ, 675, 1223
- Nissen et al. (2007) Nissen, P. E., Akerman, C., Asplund, M., Fabbian, D., Kerber, F., Kaufl, H. U., & Pettini, M. 2007, A&A, 469, 319
- Nissen et al. (2004) Nissen, P. E., Chen, Y. Q., Asplund, M., & Pettini, M. 2004, A&A, 415, 993
- Pasquini et al. (2005) Pasquini, L., Bonifacio, P., Molaro, P., Francois, P., Spite, F., Gratton, R. G., Carretta, E., & Wolff, B. 2005, A&A, 441, 549
- Ryde (2006) Ryde, N. 2006, A&A, 455, L13
- Ryde & Lambert (2004) Ryde, N., & Lambert, D. L. 2004, A&A, 415, 559
- Sbordone et al. (2007) Sbordone, L., Bonifacio, P., Buonanno, R., Marconi, G., Monaco, L., & Zaggia, S. 2007, A&A, 465
- Sbordone (2005) Sbordone, L. 2005, Memorie della Società Astronomica Italiana Supplementi, 8, 61
- Sbordone et al. (2005) Sbordone, L., Bonifacio, P., Marconi, G., Buonanno, R., & Zaggia, S. 2005, A&A, 437, 905
- Sbordone et al. (2004) Sbordone, L., Bonifacio, P., Castelli, F., & Kurucz, R. L. 2004, Memorie della Società Astronomica Italiana Supplementi, 5, 93
- Takada-Hidai et al. (2002) Takada-Hidai, M., et al. 2002, ApJ, 573, 614
- Takeda et al. (2005) Takeda, Y., Hashimoto, O., Taguchi, H., Yoshioka, K., Takada-Hidai, M., Saito, Y., & Honda, S. 2005, PASJ, 57, 751
- Tautvaišienė et al. (2004) Tautvaišienė, G., Wallerstein, G., Geisler, D., Gonzalez, G., & Charbonnel, C. 2004, AJ, 127, 373
- Ventura et al. (2002) Ventura, P., D’Antona, F., Mazzitelli, I. 2002, A&A, 393, 215
- Wang & Wheeler (2008) Wang, L., & Wheeler, J. C. 2008, ARA&A, 46, 433
- Wedemeyer et al. (2004) Wedemeyer, S., Freytag, B., Steffen, M., Ludwig, H.-G., & Holweger, H. 2004, A&A, 414, 1121
- Wiese et al. (1969) Wiese, W. L., Smith, M. W., & Miles, B. M. 1969, NSRDS-NBS, Washington, D.C.: US Department of Commerce, National Bureau of Standards, —c 1969
- Woosley & Heger (2007) Woosley, S. E., & Heger, A. 2007, Phys. Rep, 442, 269
- Woosley & Janka (2005) Woosley, S., & Janka, T. 2005, Nature Physics, 1, 147
- Wünsch et al. (2008) Wünsch, R., Tenorio-Tagle, G., Palouš, J., & Silich, S. 2008, ApJ, 683, 683