Suzaku Observations of PSR B125963: A New Manifestation of Relativistic Pulsar Wind
Abstract
We observed PSR B125963, a young non-accreting pulsar orbiting around a Be star SS 2883, eight times with the Suzaku satellite from July to September 2007, to characterize the X-ray emission arising from the interaction between a pulsar relativistic wind and Be star outflows. The X-ray spectra showed a featureless continuum in 0.6–10 keV, modeled by a power law with a wide range of photon index 1.3–1.8. When combined with the Suzaku PIN detector which allowed spectral analysis in the hard 15–50 keV band, X-ray spectra do show a break at keV in a certain epoch. Regarding the PSR B125963 system as a compactified pulsar wind nebula, in which pairs are assumed to be accelerated at the inner shock front of the pulsar wind, we attribute the X-ray spectral break to the low-energy cutoff of the synchrotron radiation associated with the Lorentz factor of the relativistic pulsar wind . Our result indicates that Comptonization of stellar photons by the unshocked pulsar wind will be accessible (or tightly constrained) by observations with the Fermi Gamma-ray Space Telescope during the next periastron passage. The PSR B125963 system allows us to probe the fundamental properties of the pulsar wind by a direct means, being complementary to the study of large-scale pulsar wind nebulae.
Subject headings:
acceleration of particles — radiation mechanisms: non-thermal — pulsars: individual (PSR B125963) — X-rays: binaries1. Introduction
PSR B125963 is a young radio pulsar (spin period 48 ms) orbiting a B2e star SS 2883 in a highly eccentric 3.4 yr orbit, having spindown power of (Johnston et al., 1992, 1994; Manchester et al., 1995). The distance from the Earth is estimated as kpc (Johnston et al., 1994). PSR B125963 was the first example of a radio pulsar forming a binary with a non-degenerate companion (Johnston et al., 1992). The PSR B125963 system is an important astrophysical laboratory for the study of the pulsar wind interacting with a stellar wind, and the nonthermal radiation arising from the shocked pulsar wind. Apart from PSR B125963, the only other example known in our Galaxy is the PSR J17403052 binary system (Stairs et al., 2001), which has, however, much lower spindown power.
Be stars are characterized by strong mass outflows through the formation of a slow and dense equatorial disk (Waters et al., 1988). Because PSR B125963 has a highly eccentric orbit and the equatorial disk is likely inclined with respect to the orbital plane, the pulsar is expected to interact with the disk of the Be star near periastron, by crossing the disk twice before and after the periastron passage (e.g., Melatos et al., 1995). The signatures of disk crossings can be seen in the radio observations, such as pulsar eclipse, the light curve of transient unpulsed emission, and the change of dispersion measure (Johnston et al., 1996, 2005). The disk crossings also play important roles in producing the X-ray and gamma-ray emission (Chernyakova et al., 2006).
Enhanced high-energy emission around periastron which is thought to arise from the interactions between the pulsar wind and the stellar wind/disk, has been observed in X-ray (Kaspi et al., 1995; Hirayama et al., 1996, 1999; Chernyakova et al., 2006), soft -ray (Grove et al., 1995; Shaw et al., 2004), and very high energy gamma-rays (Aharonian et al., 2005). The basic properties of the X-ray emission have been revealed by the series of ASCA observations (Kaspi et al., 1995; Hirayama et al., 1996, 1999), which are summarized as follows: (1) The X-ray luminosity is modest around periastron with , corresponding to about one percent of the spindown power. The intensity within a day is constant, while it varies by a factor of during the periastron passage. At around apastron, the luminosity decreased by one order of magnitude; (2) The X-ray spectrum is characterized by a power law of photon index without any detectable line emission; (3) No significant X-ray pulsed emission at the pulsar spin period has been found. The upper limit (at a 90% level) on the pulse component is of the total X-ray flux. Observations during the periastron passage in 2004 with XMM-Newton have revealed more detailed behavior of X-ray emission (Chernyakova et al., 2006). The X-ray brightening prior to periastron was roughly coincident with the brightening of unpulsed radio emission, which can be identified with the entrance to the Be star equatorial disk. Moreover, Chernyakova et al. (2006) have found remarkable hardening down to at the entrance of the disk prior to periastron, followed by a recovery to during the disk crossing.
In the hard X-ray domain, a dedicated three-week CGRO observation in 1994 has resulted in a significant detection in the 30–200 keV range at a few mCrab level with the OSSE instrument, with the spectrum being characterized by a power law of (Grove et al., 1995). The OSSE spectrum was consistent with the time-averaged ASCA spectrum extrapolated to the OSSE band. With the INTEGRAL satellite, the hard X-ray emission in the 20–200 keV band was detected with significance based on the observation performed in 21–25 March 2004 (Shaw et al., 2004).
The properties of the X-ray and soft -ray emission observed with ASCA and CGRO have been shown to be consistent with the idea that the emission is produced by shock-accelerated pairs as a result of the interactions between the pulsar wind and the Be star outflows (Tavani, Arons, & Kaspi, 1994; Kaspi et al., 1995; Tavani & Arons, 1997). The pairs are considered to be accelerated at the inner shock front of the pulsar wind and adiabatically expanding in the relativistic flow of the pulsar cavity. As a scale-down version of pulsar wind nebulae (PWNe), the PSR B125963 system can be referred to as a compactified pulsar wind nebula, and serves as a unique diagnostic of shock acceleration subject to very fast cooling. Indeed, synchrotron radiation by the accelerated pairs offers an excellent explanation for the observed X-ray emission, indicating the existence of a remarkably efficient acceleration mechanism at an energy of TeV on a timescale less than sec (Tavani & Arons, 1997). The anisotropic inverse-Compton scattering on the intense stellar light of the accelerated pairs was predicted to be detectable by air Cherenkov telescopes (Kirk et al., 1999).
During the periastron passage in 2004, very high energy gamma-rays have been indeed detected by the HESS telescopes (Aharonian et al., 2005). The level of the TeV gamma-ray flux and the spectral shape were in a reasonable agreement with the theoretical expectation based on the compactified PWN model. However, the light curve around periastron disagreed with the early expectation, requiring a revision of the model111Even departing from the framework of the compactified PWN, a hadronic origin of TeV gamma-rays (Kawachi et al., 2004) may replace the synchrotron-IC model (see also Chernyakova et al., 2006).. Khangulyan et al. (2007) have introduced the change of the maximum energy of pairs as a viable explanation for the behavior of the TeV light curve. Also, they argued that the increase of the adiabatic loss rate near periastron is another possible way to naturally account for the reduction of the TeV flux. Since the change of the maximum energy and/or the adiabatic loss rate can be imprinted in the synchrotron X-ray spectrum, the detailed X-ray observations are thus quite important to understand the behavior of the TeV radiation as emphasized by Khangulyan et al. (2007).
In this paper, we present the results from our monitoring observations made with the Suzaku satellite in the X-ray and hard X-ray bands, with an effective energy range of 0.6–50 keV, performed during the most recent periastron passage in 2007. Combined with the previous measurements in X-ray, the Suzaku observations have clarified the spectral evolution of the PSR B125963 system. Thanks to the wide band coverage, we have discovered the existence of a spectral break in a certain epoch. This paper is organized as follows. The observations and basic data reduction are described in §2. The results of X-ray analyses are presented in §3. In §4, we outline our model of a compactified pulsar wind nebula, and interpret the X-ray spectral break as a manifestation of the Lorentz factor of the pulsar wind. Throughout this paper, we adopt the distance to the PSR B125963 system from the Earth to be (Johnston et al., 1994). For the calculation of the pulsar orbit, we assume a mass of SS 2883 to be and the pulsar mass to be , which implies an inclination angle of (Johnston et al., 1994). The adopted orbital elements of the pulsar are an orbital period of 1236.72 day, eccentricity of , longitude of periastron of , and the epoch of periastron of MJD 48124.34 (Manchester et al., 1995). All errors are quoted at a 90% confident level unless otherwise stated.
2. Observations and Data Reduction
We observed the PSR B125963 system eight times with the Suzaku satellite each with ks exposure in 2007 July, August, and September. The total exposure time amounts to ks after standard data screening. We note that this is the first and possibly last chance for Suzaku to observe the first disk transit since target visibility does not permit us to observe it next time. Table 1 gives the log of the Suzaku observations; the eight observing epochs are referred to as Sz1–Sz8 hereafter. During the first four epochs (Sz1–Sz4) simultaneous observations with HESS were coordinated. The results of the HESS observations will be presented separately.
The Suzaku observations were performed with the X-ray Imaging Spectrometer (XIS: Koyama et al., 2007) in 0.3–12 keV and the Hard X-ray Detector (HXD: Takahashi et al., 2007) in 13–600 keV. The XIS, located at the focal plane of the X-ray telescopes (XRT: Serlemitsos et al., 2007), consists of one back-illuminated CCD camera (XIS-1) and three front-illuminated CCDs (XIS-0, -2 and -3). One of the front-illuminated CCDs, XIS-2, was not available at the time of our observations, since it suffered from a fatal damage on 2006 November 9, and unusable since then. The HXD consists of the silicon PIN photo diodes (hereafter PIN) capable of observations in the 13–70 keV band and the GSO crystal scintillators (hereafter GSO) which cover the 40–600 keV band.
The XIS instruments were operated in a normal full-frame clocking mode, with a frame time of 8 s. In this work, we present results from front-illuminated CCDs (XIS-0 and -3), which have a larger effective area at high energies, and therefore suited for our purpose. XIS-0 and -3 have almost identical properties, so we co-added the data to improve photon statistics. PSR B125963 was observed slightly off-axis ( from the optical axis), placed on the HXD nominal pointing position, to maximize the effective area of the HXD detectors. The HXD instruments were operated in the normal mode. The relative normalization of the HXD-PIN spectrum to the XIS was fixed at 1.15, as was determined by the calibration observations of the Crab Nebula (Kokubun et al., 2007).
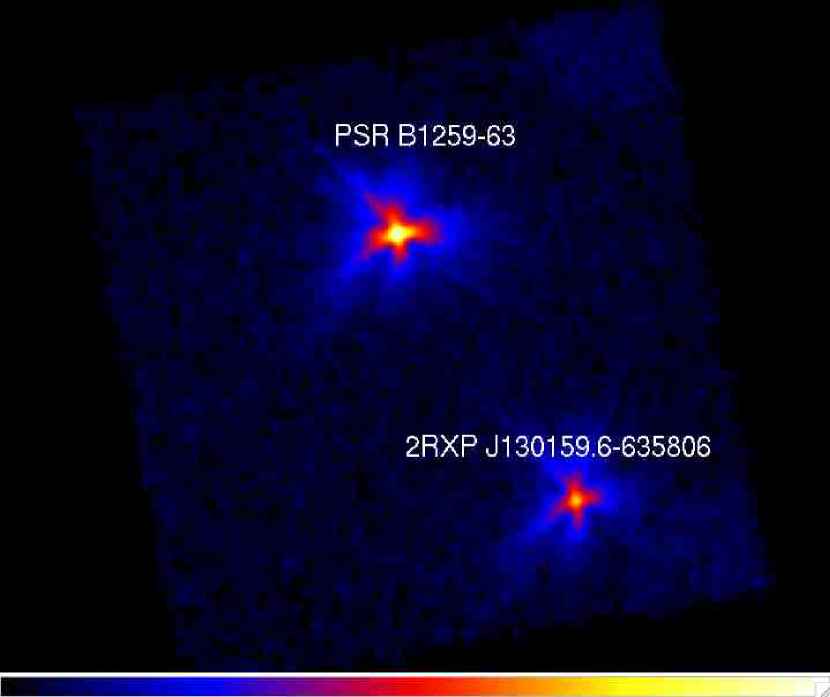
The field-of-view (FOV) of the XIS contains another X-ray source, 2RXP J130159.6635806 (shortly 2RXP J1301), as shown in Figure 1. This is an accretion-powered pulsar with a spin period of s (Chernyakova et al., 2005), which is located away from PSR B125963. We have monitored the 700-sec accretion-powered pulsar with the XIS by tuning a telescope roll angle, to estimate its contribution to the hard X-ray flux measured by the non-imaging HXD-PIN detector.
We analyzed data delivered to us via pipeline processing version 2.0.6.13 (Sz1–Sz5) or version 2.1.6.15 (Sz6–Sz8). Basic analysis was done using the HEASOFT software package (version 6.5), with calibration files distributed on 9 July 2008. For the XIS and HXD-PIN, we made use of cleaned event files, in which standard screening was applied. On the other hand, we reprocessed the HXD-GSO data by ourselves to apply appropriate gain files. The standard screening procedures include event grade selections, and removal of time periods such as spacecraft passage of the South Atlantic Anomaly (SAA), intervals of small geomagnetic cutoff rigidity (COR), and those of a low elevation angle. Specifically, for the XIS, the elevation angle larger than above the Earth and larger than from the sunlit Earth limb are selected. The data screening criteria for the HXD include the COR larger than , and the elevation angle above the Earth limb greater than 5.
| ID | Date | MJD | Exposure (ks) | ||
|---|---|---|---|---|---|
| (days) | XIS | PIN | |||
| Sz1 | 2007 07 07 | 54288.6 | 21.9 | 25.3 | |
| Sz2 | 2007 07 09 | 54290.7 | 19.5 | 25.4 | |
| Sz3 | 2007 07 11 | 54292.6 | 22.7 | 22.9 | |
| Sz4 | 2007 07 13 | 54294.7 | 22.9 | 19.7 | |
| Sz5 | 2007 07 23 | 54304.3 | 19.7 | 16.7 | |
| Sz6 | 2007 08 03 | 54315.3 | 24.0 | 20.1 | |
| Sz7 | 2007 08 18 | 54330.1 | 20.5 | 18.1 | |
| Sz8 | 2007 09 05 | 54348.2 | 18.3 | 20.8 | |
Note. — Modified Julian Date (MJD) and days from periastron () refer to the start time of the observation. The exposure time is the net integration time after standard data screening.
3. Analysis and Results
3.1. Power-law fit to XIS spectra
| ID | ||||
|---|---|---|---|---|
| Sz1 | 1.06 (354) | |||
| Sz2 | 1.04 (309) | |||
| Sz3 | 1.19 (272) | |||
| Sz4 | 1.30 (298) | |||
| Sz5 | 0.85 (249) | |||
| Sz6 | 0.92 (205) | |||
| Sz7 | 1.01 (402) | |||
| Sz8 | 1.12 (253) |
Note. — Fitting Suzaku XIS spectrum of PSR B125963 by a power law with photoelectric absorption in 0.6–10 keV. Absorbing column density , photon index , and the 1–10 keV flux (not corrected for absorption) are shown with 90% errors.
The XIS spectra were extracted from circular regions of radius centered on the source. Background spectra were extracted from source free regions. Response matrices (“rmf”) were generated by xisrmfgen, and ancillary response functions (“arf”) were simulated by running xissimarfgen. The source count rate is typically 1 counts s-1 per XIS in 0.6–10 keV, while the background count rate is only about counts s-1. Source spectra were binned to a minimum of 100 counts per bin. We performed spectral fitting in a range of 0.6–10 keV after excluding a narrow bandpass around the Si-K edge (1.8–1.9 keV) where some calibration errors remain.
Given that no previous observations have reported spectral changes within a day, we first performed model fitting of epoch-by-epoch X-ray spectra of the PSR B125963 system accumulated for ks. As expected from past X-ray observations (e.g., Kaspi et al., 1995; Chernyakova et al., 2006), all the XIS spectra of the PSR B125963 system show a featureless continuum without any emission lines. The Suzaku X-ray spectra are shown later in Figure 6. The XIS spectrum (in terms of number flux per energy) was modeled by a power law, namely where is the normalization and is the photon index, attenuated by an absorption factor of . Here is the absorption column density and represents the photoelectric absorption cross section. The results of the power-law fit are summarized in Table 2. The best-fit photon indices are found in a wide range of , while the absorption column density in a narrow range of . In most cases we obtained a statistically acceptable fit. However, in the case of Sz4, the absorbed power-law fit was unacceptable with a reduced chi-square of for 298 degree of freedom (d.o.f.). Also, the fitting quality for Sz3 seems bad with for 272 d.o.f. It should be noted that a quite hard power law was obtained in both epochs. Inspection of the fit residuals suggests the presence of spectral steepening. This issue shall be investigated in detail using the HXD-PIN in §3.4.
Figure 2 plots the flux measured by the Suzaku XIS as a function of (days from periastron), together with a compilation of previous measurements. The new Suzaku data points largely help us track the time evolution of the X-ray flux from the PSR B125963 system, and make it clear that the stellar disk plays essential roles in regulating the X-ray emission from the PSR B125963 system. In the X-ray lightcurve as a function of (Fig. 2), there appear two bumps, which can be identified with the disk passages of the pulsar. The position of the post-periastron peak at epoch Sz7 ( days) coincides with the enhancement of the TeV flux measured with HESS in 2004, as well as the peak in the radio lightcurves. In accordance with the disk geometry introduced by Chernyakova et al. (2006), we associate this feature with the pulsar’s re-entrance to the Be star equatorial disk. The relatively smooth multi-orbital lightcurve over a decade suggests that orbit-by-orbit differences in X-ray behavior would be small, though the current data sets are not enough to draw a definitive conclusion. We note that the unpulsed radio lightcurves show significant differences from one periastron to next (see Fig. 2), which would support the idea that the radio electrons originate from the shocked equatorial disk (Ball et al., 1999).
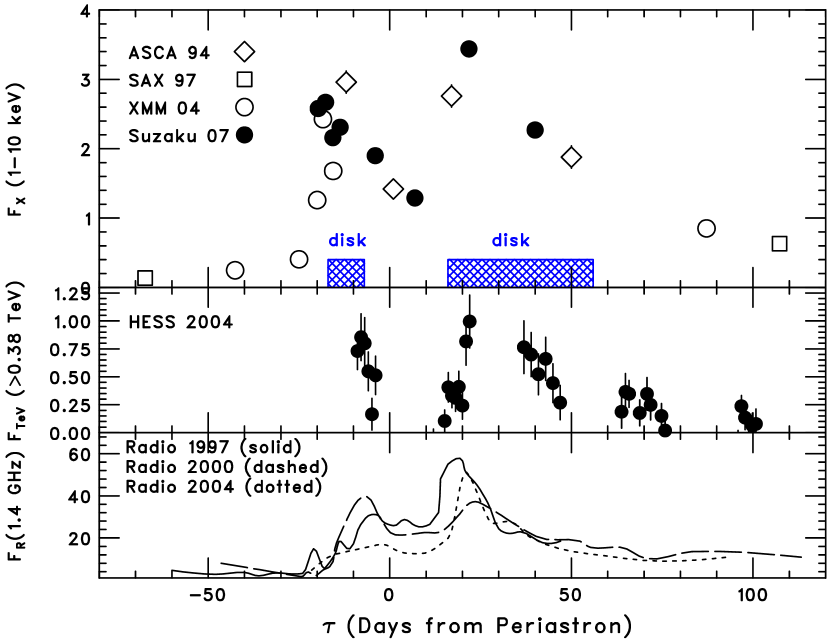
In Figure 3, the best-fit values of and are shown as a function of . As mentioned above, the column density is found to be almost constant, , over the course of Suzaku monitoring. This is roughly consistent with the values obtained with XMM-Newton during the previous disk passage in 2004, (Chernyakova et al., 2006). It should be noted that smaller column density () has been observed with XMM-Newton when the pulsar was positioned outside the disk (Chernyakova et al., 2006). The excess column density can therefore be ascribed to the dense stellar disk. On the other hand, photon index exhibits remarkable changes; significant spectral flattening characterized by was observed during the first disk transit (). Such spectral hardening was discovered in 2004 with XMM-Newton, but it appeared slightly earlier in phase (). Later in section §3.4, we will demonstrate the presence of a spectral break during the hard-spectrum state, by utilizing hard X-ray measurements in the 15–60 keV band with the Suzaku HXD-PIN.

3.2. Lightcurves
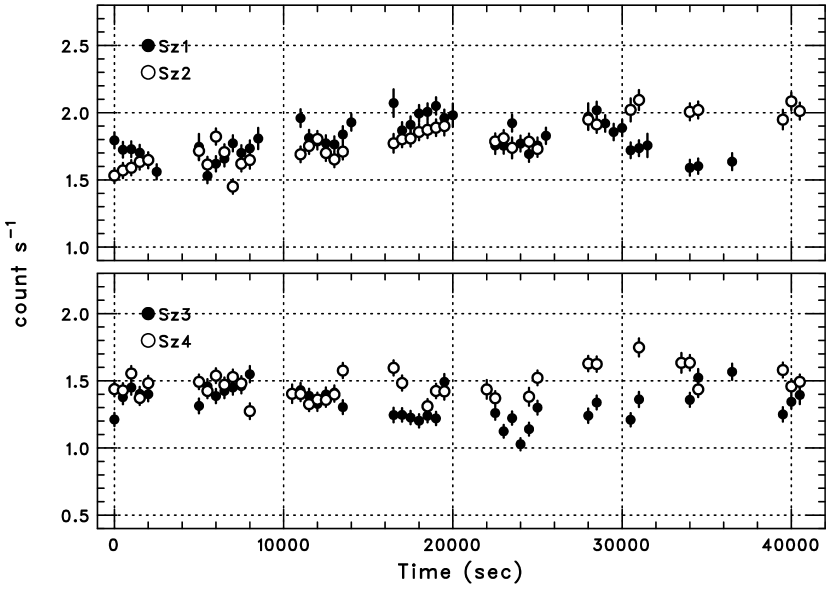
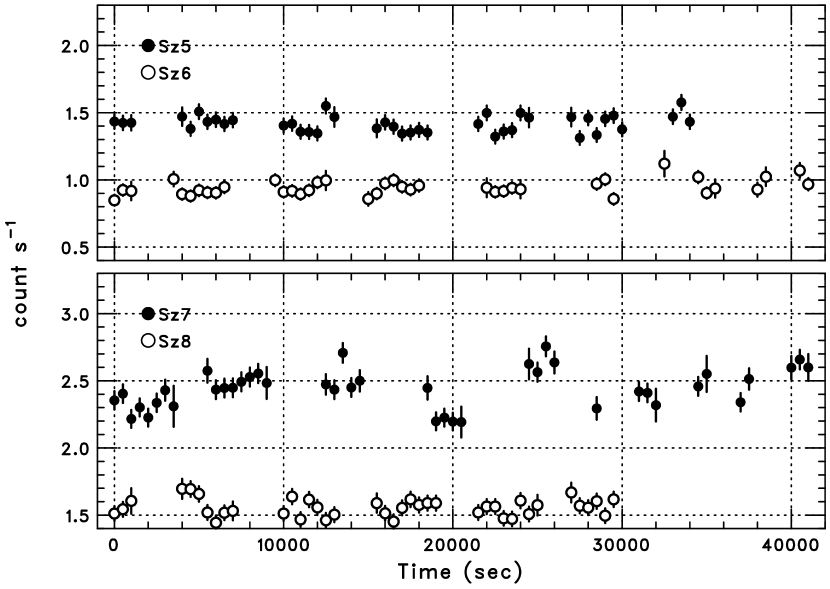
The X-ray lightcurves for individual observations were examined in order to study the temporal characteristic of the X-ray emission on short time scales. The 1–10 keV lightcurves with a bin size of 500 sec are shown in Figure 4. We found moderate hour-scale flux variability () at the time of disk crossings. On the other hand, the lightcurves in epochs Sz5 and Sz6 can be fit well with a constant, suggesting that the flux variations would be characteristics of disk passage. The size of the emitting regions may be smaller in the equatorial disk. Alternatively, there is a large density fluctuation inside the disk.
To search for possible spectral changes within each observation, we subdivided each epoch into several periods typically with an hour exposure, and fitted the short time-frame spectra with a power law modified by photoelectric absorption. Though the power-law normalization differs between sub-epochs, no statistically significant spectral changes were found, which indicates the stability of a spectral shape on hour scales.
The density fluctuation inside the Be star disk would be imprinted in the chaotic behavior of the X-ray lightcurves on hour scale in one way or another. The hour-scale variability Suzaku uncovered would offer a way to infer the pulsar’s location relative to the Be disk plane. Future intense coverages during the post-periastron disk transit of the pulsar with Suzaku will be able to constrain the structure of the Be star disk.
3.3. Preparation for Broadband Analysis
With the Suzaku observations, we are now accessible to a day-by-day broadband X-ray spectrum spanning two orders of magnitude in energy from 0.6 to 50 keV with sufficient sensitivities, by combining the XIS (0.6–10 keV) and the HXD-PIN (15–50 keV) instruments.
To extract the HXD-PIN spectra of PSR B125963, we have to subtract the following background spectra from the total cleaned spectra: (1) instrumental background so-called non X-ray background (NXB), (2) cosmic X-ray background (CXB), that is the sum of unresolved active galactic nuclei in the FOV of the PIN, and (3) the emission from the nearby pulsar 2RXP J1301 that lies within the FOV of the PIN. The instrumental background spectra (perhaps due mostly to atmospheric neutrons), provided by the HXD instrument team, are constructed by the empirical models, which rely on a database of Earth occultation observations. The HXD team provides two kinds of background models, “quick” and “tuned”. We found the two models give almost identical results within the statistical uncertainties. In this paper we make use of the “tuned” NXB model, which offers better background reproducibility achieving the systematic error of 3% (Fukazawa et al., 2009). The systematic error of the NXB subtraction does not have noticeable impact on the results presented in this paper.
The CXB flux in the FOV of the PIN instrument was subtracted from each PIN spectrum in the same way as Takahashi et al. (2008). The CXB flux amounts to % of the NXB, comparable to the systematic error of the NXB model itself.
We now describe the procedures used for the derivation of hard X-ray spectra of 2RXP J1301 in each pointing. In fact, the main contributions to the systematic error of the PIN spectral data of the PSR B125963 system itself would be the uncertainties in the hard X-ray flux contaminated by 2RXP J1301. To describe the X-ray spectrum of 2RXP J1301, we adopt the following empirical spectral form that has been traditionally applied to accretion-powered pulsars:
| (1) |
where is the normalization (White et al., 1983). The index was frozen to be , a typical value for accretion-powered X-ray pulsars (e.g., Nagase, 1989), to reduce the number of free parameters. Noncyclotron pulsars can be characterized by and (Makishima et al., 1999).
We chose the epochs Sz5 and Sz6 for the use of determination of the spectral shape of 2RXP J1301 in the 1–50 keV band, because the relative contribution of 2RXP J1301 in a PIN spectrum would be large in the two epochs, where the PSR B125963 emission is relatively weak and steep. To obtain the model parameters relevant for 2RXP J1301, the XIS spectrum of PSR B125963 in 0.6–10 keV, that of 2RXP J1301 in 1.5–10 keV, and the PIN spectrum in 15–50 keV after subtraction of the background (NXB+CXB) were jointly fit by a two component model consisting of a power law that describes PSR B125963, and equation (1) that describes 2RXP J1301. Each spectral component is attenuated by photoelectric absorption. The spectral data for the two epochs were summed to reduce statistical errors, because the XIS spectra of PSR B125963 (and also 2RXP J1301) are similar in the two epochs. An energy-independent transmission factor (about 0.7) of the PIN collimator at the position of 2RXP J1301 was taken into account when performing a joint fit. The assumption of a power-law spectrum for PSR B125963 in the 0.6–50 keV band in epochs Sz5 and Sz6 can be justified, to some extent, by the OSSE results (Grove et al., 1995), which came from the three-week observation covering a certain orbital phase that encompasses the two Suzaku epochs.
The joint fit was statistically acceptable with a reduced chi-square of for 768 d.o.f. In Figure 5 the XIS spectra of both PSR B125963 and 2RXP J1301, and the PIN spectrum (the sum of PSR B125963 and 2RXP J1301 contributions) are shown together with the best-fit model. We obtained the following parameters for the 2RXP J1301 model: , , and . The values seem reasonable for noncyclotron pulsars. The best-fit parameters for the PSR B125963 model are , and , which are consistent with the results obtained using the XIS alone.
The Suzaku XIS spectrum of 2RXP J1301 at each epoch was then fit by using the cutoff power-law model with the parameters obtained above (namely, and ), to estimate the flux contamination of 2RXP J1301 in each PIN spectrum. Spectral fitting was performed in an energy range of 2–10 keV after excluding an iron-K band of 6.2–6.8 keV in some occasions where we found possible iron lines. The template model with the fixed spectral shape gives an acceptable fit in all cases, indicating the stability of the spectral shape of 2RXP J1301 from one epoch to another. The flux level of 2RXP J1301 was also found to be stable, with the unabsorbed 1–10 keV flux in a range of .
We also fit Suzaku XIS spectrum of 2RXP J1301 at each epoch by using an absorbed power-law model, instead of the cutoff power-law model of equation (1), to quantify spectral stability. The single power-law model gives an acceptable fit in the 1–10 keV band in all cases, as summarized in Table 3. The observed spectral shape in this band looks similar to each other. The best-fit photon indices in epochs Sz1–8 are found to be , with the absorption column density of . The spectral similarity from one epoch to another supports our assumption that the parameter sets of and obtained in Sz5+6 are applicable to other epochs as well.
| ID | ||||
|---|---|---|---|---|
| Sz1 | 1.09 (192) | |||
| Sz2 | 0.91 (250) | |||
| Sz3 | 0.95 (315) | |||
| Sz4 | 1.10 (334) | |||
| Sz5 | 1.02 (267) | |||
| Sz6 | 1.03 (267) | |||
| Sz7 | 1.05 (270) | |||
| Sz8 | 1.00 (225) |
Note. — Fitting Suzaku XIS spectrum of 2RXP J1301 by a power law with photoelectric absorption in 1–10 keV. Absorbing column density , photon index , and unabsorbed 1–10 keV flux are shown with 90% errors.
3.4. Broadband Spectra
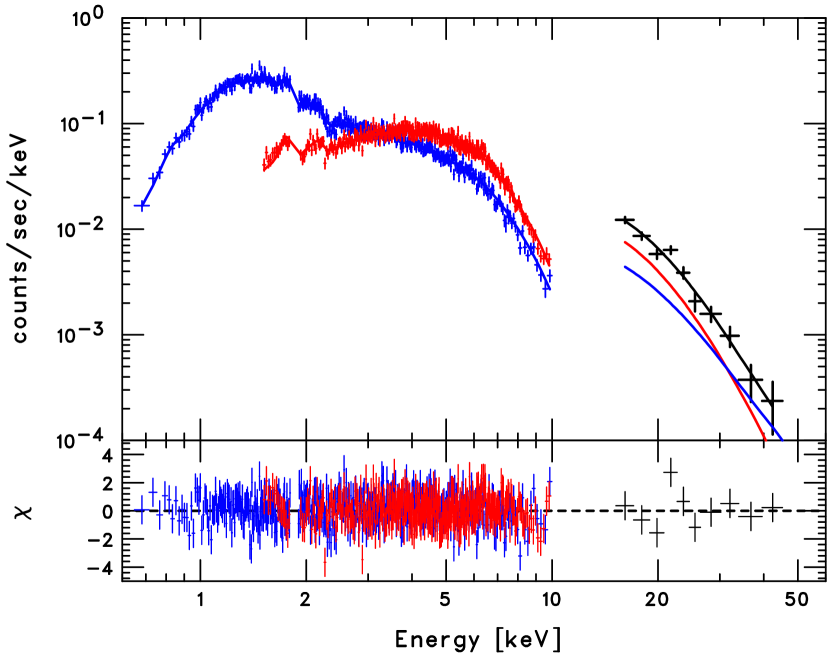
Figures 6 shows the Suzaku XIS+PIN spectra of the PSR B125963 system. Given the spectral similarity, two successive epochs were merged into a single observation, labeled as Sz1+2, Sz3+4, and Sz7+8. For the PIN spectrum, the NXB and CXB as well as the contribution from 2RXP J1301 were subtracted (see §3.3). We first performed spectral fitting using an absorbed single power law. The results are shown in Figure 6 and the best-fit parameters are summarized in Table 4.
The Sz3+4 spectrum could not be well described by a single power law; there found wavy residuals in the XIS band, and, moreover, there exist flux deficits compared to the power-law model in the PIN spectra at high energies, indicating the presence of spectral steepening. It is interesting to note that similar wavy residuals to the best-fit power-law model are found in the XIS spectrum of the supernova remnant RX J1713.73946, where the X-ray spectrum is indeed steepened (Takahashi et al., 2008). Imperfect subtraction of the 2RXP J1301 contamination is difficult to account for the flux deficit, because 2RXP J1301 has a much steeper spectrum in the PIN band and hardly affects the PIN spectrum above 30 keV. In fact, even if we artificially lower to 10 keV to increase the 2RXP J1301 contamination, the presence of spectral steepening is still required. We conclude that the Sz3+4 spectrum exhibits steepening toward high energies. Also, the Sz1+2 spectrum would require less significant steepening, the presence of which is not conclusive. The broadband Sz7+8 spectrum was found to be consistent with a simple power law with .
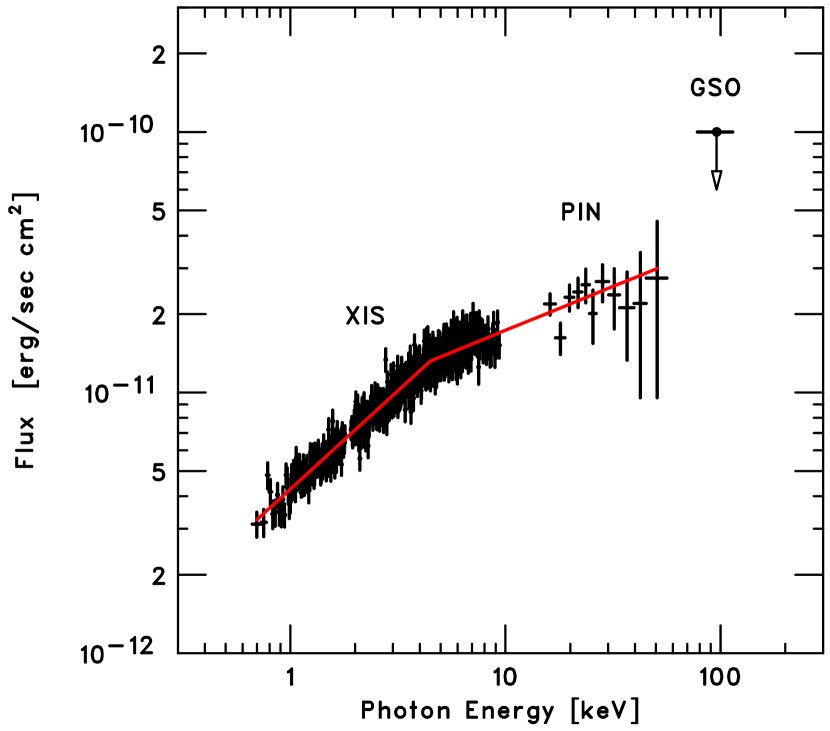
We have proceeded to fit the Sz3+4 spectrum with a broken power-law model attenuated by photoelectric absorption, which yielded an acceptable fit (see Table 4). The best-fit photon indices are and , with a break energy of keV. We also fit the Sz3+4 spectrum with a broken power-law model restricting the energy band to 0.6–10 keV. In such an XIS-only case, we obtained the following values: , , and keV. Though the systematic error in the PIN spectrum itself would be large, its influence on the spectral parameters is therefore found to be small. Figure 7 presents the unfolded X-ray spectrum with the best-fit broken power-law model. For reference, the broken power-law model was applied also to the Sz1+2 and Sz7+8 spectra. As expected from the single power-law fitting, two photon indices for the Sz7+8 spectrum are similar.


| ID | Model | |||||
|---|---|---|---|---|---|---|
| keV | ||||||
| Sz1+2 | power law | 1.16 (604) | ||||
| Sz1+2 | broken PL | 1.05 (602) | ||||
| Sz3+4 | power law | 1.27 (500) | ||||
| Sz3+4 | broken PL | 0.99 (498) | ||||
| Sz7+8 | power law | 1.12 (490) | ||||
| Sz7+8 | broken PL | 4 (fixed) | 1.11 (488) |
Note. — Fitting Suzaku XIS+PIN spectrum by a power-law or a broken power-law (PL) model with photoelectric absorption in 0.6–50 keV. Absorbing column density , photon index (and in the case of broken PL), and the break energy of a broken power-law, are shown with 90% errors.
3.5. Flux Upper Limit at 100 keV
The HXD-GSO scintillation detectors cover the energy range of 50–600 keV. Since the contribution of 2RXP J1301 is expected to be negligible above 50 keV, the measurement by the GSO is important for testing the presence of spectral steepening inferred by the XIS-PIN fitting. There found no significant detection in any epoch with the HXD-GSO. We then set the upper limits on the source count rate as 2% of the background count rate, which corresponds to a limit. It should be noted that the uncertainty in GSO measurements is dominated by the systematic error associated with background modeling. The upper limit of was placed at 100 keV (in an energy range of 78–114 keV). The limit depends only weakly on the assumed photon index () for a reasonable range of . Since the averaged background level was almost unchanged during the monitoring campaign, differences in the upper limits from one epoch to another are negligible (only ). Though the fact that the uncertainty comes from the systematic error prevents us from making a definitive statement about the significance, the upper limit set by the GSO depicted in Fig. 7 strengthens the presence of spectral steepening.
4. Interpretation of the Spectral Break
The most important finding with Suzaku would be the presence of a remarkable spectral break by around keV in the Sz3+Sz4 spectrum. The low-energy part below can be described by a rather flat index of . Here we consider the physical implication of this spectral structure within the framework of the shocked relativistic pulsar wind model, in which high-energy radiation comes from shock-accelerated electrons and positrons produced at wind termination shock (e.g., Tavani & Arons, 1997). Indeed, the synchrotron and IC radiation by the shock-accelerated pairs from the PSR B125963 system as results of the interaction between the relativistic pulsar wind and the Be star outflows have been studied extensively in previous work (Tavani & Arons, 1997; Kirk et al., 1999; Murata et al., 2003; Khangulyan et al., 2007), on which our considerations are based. However, if the particles in the relativistic wind can be efficiently mixed with the surrounding dense medium, other radiation channels such as hadronic interactions may be important (Kawachi et al., 2004; Chernyakova et al., 2006); we do not consider such possibilities in this paper. Also, comprehensive modeling of the overall phenomenology is deferred to a future publication.
4.1. Model of Compactified Pulsar Wind Nebula
Here we describe our shock-powered emission model, which is broadly similar to what has been devised in previous theoretical work mentioned above. The PSR B125963 system can be regarded as a scale-down version of PWNe. The relativistic wind of the young pulsar is presumed to be confined by the stellar outflows of the form of wind and disk, leading to the formation of termination shock inside the pulsar wind. The location of the termination shock should be close to the pulsar if the ram pressure of the stellar outflows as seen by the pulsar is large enough. The distance of the shock from the pulsar, , is assumed to be much smaller than the star-pulsar separation : (e.g., Khangulyan et al., 2007). This largely simplifies the calculations below. For example, the stellar photon density at the wind shock region as well as the IC scattering angle for the observed gamma-rays can be approximated as constant at a given phase.
The shocked relativistic wind, at the distance of from the pulsar, is magnetized with strength of (e.g., Tavani & Arons, 1997):
| (2) | |||||
| (3) |
where is the spindown power of the pulsar, and is the magnetization factor defined by the ratio of the Poynting and kinetic energy flux in the pulsar wind. A factor of 3 in equation (2) is introduced to account for the shock compression, and is assumed in obtaining equation (3). The spindown power is measured to be . The magnetization factor was adopted as in Tavani & Arons (1997). The Kennel & Coroniti model of the Crab Nebula yielded (Kennel & Coroniti, 1984a), which was determined to satisfy the flow and pressure boundary conditions at the outer edge of the nebula.
The radiation energy density at a distance from the Be star can be estimated as:
| (4) | |||||
| (5) |
where is the luminosity of the Be star: for K and . ( is somewhat uncertain. For a larger stellar radius of , becomes larger by a factor of 3.) The stellar light dominates over the magnetic field of the pulsar wind at the termination shock. However, because the IC scattering of TeV electrons on stellar photons occurs in the deep Klein-Nishina regime, the IC emission can be largely suppressed. The synchrotron cooling is expected to overtake the IC cooling at high energies. The larger luminosity of the observed synchrotron X-ray emission compared with the IC gamma-rays during periastron passage suggests that the synchrotron cooling is indeed faster than the Klein-Nishina IC cooling at TeV energies.
Given the postshock flow speed of in the pulsar wind, the adiabatic loss can compete with the radiative losses. The adiabatic loss rate is adopted as with . The factor , likely , is treated as a free parameter. In Figure 8, we show the energy-dependence of the cooling timescales both for radiative (synchrotron and IC) and non-radiative (adiabatic loss) losses, at days, where the importance of adiabatic losses is illustrated. Recently, it has been shown that the hydrodynamics of the interaction of the pulsar and stellar winds do predict the predominance of the adiabatic loss over the radiative losses (Khangulyan et al., 2008). The discussion on the cooling regimes in the PSR B125963 system can be found in Tavani, Arons, & Kaspi (1994).
The Lorentz factor of the relativistic wind is denoted by ; the unshocked pulsar wind is presumed to contain with an energy of . Using , Kennel & Coroniti (1984b) obtained for the Crab pulsar to account for the observed nonthermal radiation from the nebula.
Unshocked cold pairs in the relativistic wind are assumed to be accelerated at the termination shock and be injected into the downstream postshock flow. The energy distribution of the injected nonthermal pair is described by for . A low-energy cutoff with a step function is assumed: for . Results of simulation by Hoshino et al. (1992) for the relativistic collisionless shock in electron-positron-ion plasma suggest a power-law spectrum with can be formed above , and a fraction of the flow energy can be transferred to the nonthermal pairs, under the condition that the upstream flow energy carried by ions exceeds that of pairs. We note that should be limited by rapid cooling of the pairs at highest energies. The OSSE results in the year 1994 indicated (Grove et al., 1995). The normalization is determined by the spindown power of the pulsar and the parameter , through the relation:
| (6) |
The energy distribution of the accelerated pairs integrated over the entire radiation zone, , can be derived by the well-known kinetic equation. We consider simplified cases where both the magnetic field and radiation field do not change within the radiating zone. The cooling timescale of the accelerated pairs is much shorter than the dynamical timescale of the binary. Therefore, the energy distribution at a given orbital phase is reduced to be a steady-state solution (e.g., Khangulyan et al., 2007):
| (7) |
where is the energy loss rate as given by a sum of the synchrotron, IC, and adiabatic loss rates.

We are now ready to calculate the synchrotron and IC spectra using , and compare them with the observations. Anisotropic IC scattering of stellar photons is taken into account by utilizing the IC kernel derived by Aharonian & Atoyan (1981), as the IC gamma-ray emission depends largely on the angle between the star-pulsar and pulsar-observer directions (Khangulyan & Aharonian, 2005). We assumed a stellar radiation field to be radial rays originating from the point source, the Be star. The effect of finite size of the star does not affect the resultant radiation spectrum. However, the radiation field can be modified appreciably by the presence of the equatorial disk, which has to be taken into account by future work to model the TeV gamma-ray spectra. We calculate the attenuation of TeV gamma-rays due to pair production with stellar photons, though the opacity is small, typically , for our choice of the optical luminosity. Whereas more significant absorption, up to , can be expected if we adopt larger stellar luminosity (Dubus, 2006), this does not affect our main conclusions.
| Fixed | Free | ||||||||
|---|---|---|---|---|---|---|---|---|---|
| (TeV) | |||||||||
| days | 0.1 | 0.01 | 1.9 | 10 | 0.05 | 3 | |||
| days | 0.1 | 0.01 | 1.9 | 10 | 0.15 | 10 | |||
| days | 0.1 | 0.01 | 1.9 | 10 | 0.50 | 2 | |||
Note. — (a fraction of the spin down power channelled into the accelerated pairs), (the magnetization factor of the pulsar wind), (the Lorentz factor of the pulsar wind), (the acceleration index), (the maximum energy of accelerated pairs), (the distance of the termination shock from the pulsar divided by the pulsar-Be star separation), and (the parameter to describe the adiabatic loss rate).
4.2. Applications to the Observed Spectra
To describe the broadband emission of the compactified PWN in variable environments, two parameters, and , are allowed to vary along the orbit. We note that , which is controlled by ram pressure of stellar wind/disk, determines magnetic field strength. The two parameters describe physical conditions external to the pulsar wind. The fact that we observed a spectral break during the disk crossing suggests that the external conditions indeed regulate the position of the break. The other parameters are frozen to be the following values: , , , and . They are broadly similar to what have been previously obtained in the literature mentioned above, though we made some fine-tuning; is adjusted to explain the spectral break, and is chosen to match with the observed X-ray spectral slope in Sz7+8 (see below). The uncertainties of the fixed parameters are discussed in §4.3. The physical parameters are summarized in Table 5.
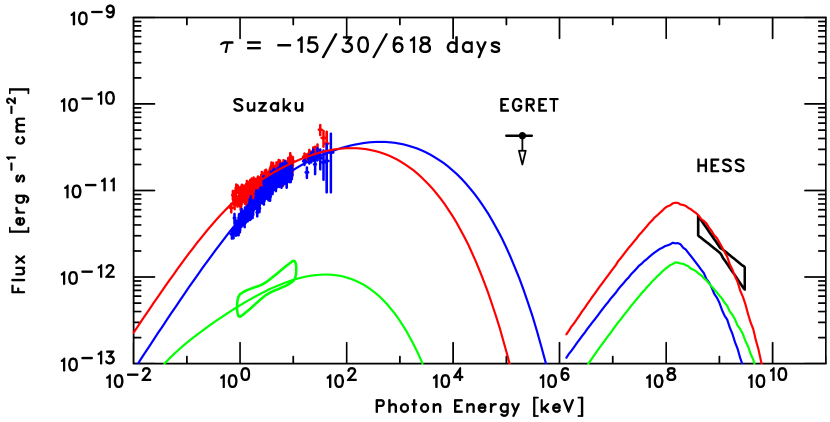
We first reproduce the Sz7+8 spectrum, which is described by a simple power law of in a wide energy range of 0.6–50 keV, along with the HESS spectrum in 2004 (Aharonian et al., 2005). Since our treatment of the radiation field ignores the presence of the equatorial disk, we require only a crude match with the average flux level reported by HESS. (The TeV gamma-ray flux changed by a factor of 2–3 from one month to the next.) Nevertheless, the TeV flux and shape put meaningful constraints on the model. Using the configuration of the binary system at days, we found that the following parameters give a reasonable fit to the X-ray and gamma-ray spectra: ( and ), and . In Figure 9, the spectral energy distribution (SED) of the synchrotron and IC radiation is drawn. The cooling of the accelerated responsible for the soft X-ray emission is dominated by adiabatic loss, which ensures the hard X-ray spectrum. The shape of the TeV gamma-ray spectrum obtained with HESS can be reproduced by this modeling as well.
We then proceed to model the Sz3+4 spectrum, where a spectral break was observed. We relate the X-ray spectral break to the low-energy cutoff in the electron injection function, which can be ascribed to the Lorentz factor of the pulsar wind . In Figure 9, we present calculation of the synchrotron and IC models at days with ( and ), and . The X-ray spectral shape, the very flat spectrum below in particular, is nicely reproduced by this model. With this scenario, the appearance of the break in the X-ray band is due to the enhanced magnetic field. Our model predicts lower flux in the TeV band at the time of a higher break energy.
The observed break energy is related to the Lorentz factor of the pulsar wind:
| (8) | |||||
| (9) |
It is interesting to note that the X-ray spectrum below is predicted to have a universal shape as long as the cooling is dominated by adiabatic loss and the energy distribution below the low-energy cutoff is harder than . Given the adiabatic-loss dominance (), equation (7) yields
| (10) |
irrespective of acceleration index . This form of the energy distribution of the cooled pair population is translated into a synchrotron power-law spectrum with photon index . Therefore, the synchrotron spectrum has a universal form with for . In fact, the result of the Suzaku observations, namely immediately below , agrees well with what theoretically expected.
Let us check if this model can accommodate the X-ray observations around apastron, where the physical conditions change dramatically from periastron. We found the following parameters are compatible with the X-ray observations at apastron: ( and ), and . (A condition of is not well satisfied, so our calculations need a revision if we aim at performing precise modeling. ) In Figure 9, we show the ASCA spectrum and the model appropriate for apastron, day. The effective photon index of the model is , which is in agreement with the X-ray spectrum, , obtained with ASCA (Hirayama et al., 1999).
4.3. Basic Properties of the Pulsar Wind of PSR B125963
One of the most fundamental parameters of a pulsar wind, the Lorentz factor of the wind , can be estimated by our modeling in the previous section through the identification of the spectral break with the low-energy cutoff of the accelerated pairs. We adopted to account for the observed break position. It depends only on the square root of postshock magnetic field, , which can be constrained well by the X-ray to TeV gamma-ray flux ratio. Therefore, is hard to be altered more than by a factor of few.
It should be noted that the wind Lorentz factor will possibly be measured by the Fermi Gamma-ray Space Telescope during the next periastron passage. The Comptonization of the unshocked pulsar wind inevitably leads to the formation of an additional bump-like gamma-ray spectrum at (assuming the Klein-Nishina limit), which overwhelms the IC component in Fig. 9 in the 0.1–10 GeV band (Khangulyan et al., 2007). The X-ray and GeV-to-TeV gamma-ray data during the next periastron passage will be crucial to test the models of the PSR B125963 system, and the long-standing pulsar wind paradigm (Kennel & Coroniti, 1984a) in general.
The other fundamental parameter in the standard pulsar wind paradigm is the magnetization factor . While the magnetic field strength can be well constrained by the X-ray and TeV flux ratio as G during the disk crossings, the -parameter itself is allowed to vary in a wide range of depending on . The condition required to explain the spectral variability corresponds to , and the energetics requirement of (together with ) gives a lower bound as .
The magnetic field of G constrains particle acceleration mechanism(s) at work in the termination shock region. Synchrotron cooling time of 10 TeV electrons is about 100 sec. To overcome the fast cooling, the acceleration timescale of is necessary at TeV, where denotes the Larmor radius of pairs (see Khangulyan et al., 2007). According to the magnetosonic acceleration model of Hoshino et al. (1992) where the magnetosonic waves collectively emitted by the shock-reflected protons (or heavy ions) are resonantly absorbed by pairs, the inverse of the gyrofrequency of protons with a Lorentz factor of determines the acceleration timescale; interestingly, sec is compatible with the requirement posed by our modeling.
The efficiency with which the pulsar spindown power is transferred into the nonthermal pairs, namely that is defined by equation (6), was adopted as in our modeling, which is also consistent with the numerical result of Hoshino et al. (1992). It should be noted, however, that the determination of would be subject to the degree of relativistic Doppler boosting if possible relativistic motion of the postshock flow (Bogovalov et al., 2008) plays a major role in the nonthermal emission.
4.4. Alternative Model for the Spectral Break
We have explored another possibility to explain the X-ray spectral break—the observed break may be accounted for by the transition of main cooling mechanisms; below the break, cooling of pairs is assumed to be IC cooling in the Klein-Nishina regime, while synchrotron cooling takes over above the break. Due to the inefficient IC cooling in the Klein-Nishina, the electron energy distribution can be much harder in a certain energy band, as compared to the energy bands wherein the IC cooling in the Thomson regime or synchrotron cooling are dominant. With this interpretation, is necessary to make the adiabatic loss unimportant.
To match the flat X-ray spectrum below , the acceleration index should be very flat, . However, the very flat spectrum of accelerated would be inconsistent with the conventional particle acceleration model as well as the observations of PWNe on parsec scales. Also, the significant reduction of the X-ray flux around apastron requires a drastic change of (say, from to ). In view of these uncomfortable requirements, we prefer the adiabatic-loss-dominated model in §4.2, where the X-ray break is ascribed to the appearance of the Lorentz factor of the relativistic pulsar wind.
5. Conclusions
We have presented results of new X-ray observations of the pulsar-Be star binary system PSR B125963 performed eight times near periastron using the Suzaku satellite. The monitoring observations with Suzaku, coupled with previous data, allow us to identify the two bump in the X-ray lightcurve around periastron, which can be ascribed to the pulsar’s entrance to the equatorial disk of the Be star. In most cases, the X-ray spectra can be well fit by a simple power law, as observed in previous observations. However, we found evidence of a spectral break when the X-ray spectral shape below 10 keV is described formally by a rather hard power law with photon index . Applying a broken power-law model to the Sz3+4 spectrum in the 0.6–50 keV band, we found that the index changes by , from to , around keV.
We considered a compactified PWN model, in which the X-ray emission is accounted for by shock-accelerated relativistic pairs via synchrotron process. The spectral properties of the X-ray and TeV gamma-ray emission are found to be reconcilable in a compactified PWN model whose parameters are adjusted within a reasonable range. We ascribed the spectral break to the low-energy cutoff of the accelerated pairs, which is supposed to be linked directly to the wind Lorentz factor. We here emphasize that our choice of parameters (see Table 5) is definitely not the unique one that can fit the observed spectra. Nevertheless, the value of the wind Lorentz factor, , determined by the observed break energy in the X-ray band is robust within a factor of few, because it depends only on the square root of postshock magnetic field, which in turn can be deduced from the X-ray to TeV gamma-ray flux ratio as G during the periastron passage. Also, the magnetic field estimate indicates the magnetization factor should be in a range of . The determination of the wind Lorentz factor through the X-ray spectral break, if confirmed, provides a direct probe of the standard pulsar wind paradigm in which pulsar’s spindown power is supposed to be carried off by a relativistic wind with Lorentz factor .
References
- Aharonian & Atoyan (1981) Aharonian, F. A., & Atoyan, A. M. 1981, Ap&SS, 79, 321
- Aharonian et al. (2005) Aharonian, F. A., et al. (HESS collaboration), 2005, A&A, 442, 1
- Ball et al. (1999) Ball, L., Melatos, A., Johnston, S., & Skjæraasen, O. 1999, ApJ, 514, L39
- Bogovalov et al. (2008) Bogovalov, S. V., Khangulyan, D. V., Koldoba, A. V., Ustyugova, G. V., & Aharonian, F. A. 2008, MNRAS, 387, 63
- Chernyakova et al. (2005) Chernyakova, M., Lutovinov, A., Rodríguez, J., & Revnivtsev, M. 2005, MNRAS, 364, 455
- Chernyakova et al. (2006) Chernyakova, M., Neronov, A., Lutovinov, A., Rodriguez, J., & Johnston, S. 2006, MNRAS, 367, 1201
- Cominsky et al. (1994) Cominsky, L., Roberts, M., & Johnston, S. 1994, ApJ, 427, 978
- Dubus (2006) Dubus, G. 2006, A&A, 451, 9
- Fukazawa et al. (2009) Fukazawa, Y., et al. 2009, PASJ, 61, 17
- Grove et al. (1995) Grove, J. E., et al. 1995, ApJ, 447, L113
- Hirayama et al. (1996) Hirayama, M., et al. 1996, PASJ, 48, 833
- Hirayama et al. (1999) Hirayama, M., et al. 1999, ApJ, 521, 718
- Hoshino et al. (1992) Hoshino, M., Arons, J., Gallant, Y. A., & Langdon, A. B. 1992, ApJ, 390, 454
- Johnston et al. (1992) Johnston, S., Manchester, R. N., Lyne, A. G., Bailes, M., Kaspi, V. M., Qiao, G., & D’Amico, N. 1992, ApJ, 387, L37
- Johnston et al. (1994) Johnston, S., Manchester, R. N., Lyne, A. G., Nicastro, L., & Spyromilio, J. 1994, MNRAS, 268, 430
- Johnston et al. (1996) Johnston, S., Manchester, R. N., Lyne, A. G., D’Amico, N., Bailes, M., Gaensler, B. M., & Nicastro, L. 1996, MNRAS, 279, 1026
- Johnston et al. (2005) Johnston, S., Ball, L., Wang, N., Manchester, R. N. 2005, MNRAS, 358, 1069
- Kaspi et al. (1995) Kaspi, V. M., et al. 1995, ApJ, 453, 424
- Kawachi et al. (2004) Kawachi, A., et al. ApJ, 607, 949
- Kennel & Coroniti (1984a) Kennel, C. F., & Coroniti, F. V. 1984a, ApJ, 283, 694
- Kennel & Coroniti (1984b) Kennel, C. F., & Coroniti, F. V. 1984b, ApJ, 283, 710
- Khangulyan & Aharonian (2005) Khangulyan, D., & Aharonian, F. 2005, High Energy Gamma-Ray Astronomy, 745, 359
- Khangulyan et al. (2008) Khangulyan, D. V., Aharonian, F. A., Bogovalov, S. V., Koldoba, A. V., & Ustyugova, G. V. 2008, International Journal of Modern Physics D, 17, 1909
- Khangulyan et al. (2007) Khangulyan, D., Hnatic, S., Aharonian, F., & Bogovalov, S. 2007, MNRAS, 380, 320
- Kirk et al. (1999) Kirk, J. G., Ball, L., & Skjaeraasen, O. 1999, Astroparticle Physics, 10, 31
- Kokubun et al. (2007) Kokubun, M., et al. 2007, PASJ, 59, S53
- Koyama et al. (2007) Koyama, K., et al. 2007, PASJ, 59, S23
- Makishima et al. (1999) Makishima, K., Mihara, T., Nagase, F., & Tanaka, Y. 1999, ApJ, 525, 978
- Manchester et al. (1995) Manchester, R. N., Johnston, S., Lyne, A. G., D’Amico, N., Bailes, M., & Nicastro, L. 1995, ApJ, 445, L137
- Melatos et al. (1995) Melatos, A., Johnston, S., & Melrose, D. B. 1995, MNRAS, 275, 381
- Murata et al. (2003) Murata, K., Tamaki, H., Maki, H., & Shibazaki, N. 2003, PASJ, 55, 473
- Nagase (1989) Nagase, F. 1989, PASJ, 41, 1
- Serlemitsos et al. (2007) Serlemitsos, P. J., et al. 2007, PASJ, 59, S9
- Shaw et al. (2004) Shaw, S. E., Chernyakova, M., Rodriguez, J., Walter, R., Kretschmar, P., & Mereghetti, S. 2004, A&A, 426, L33
- Stairs et al. (2001) Stairs, I. H., et al. 2001, MNRAS, 325, 979
- Takahashi et al. (2007) Takahashi, T., et al. 2007, PASJ, 59, S35
- Takahashi et al. (2008) Takahashi, T., et al. 2008, PASJ, 60, 131
- Tavani & Arons (1997) Tavani, M., & Arons, J. 1997, ApJ, 477, 439
- Tavani, Arons, & Kaspi (1994) Tavani, M., Arons, J., & Kaspi, V. 1994, ApJ, 433, L37
- Waters et al. (1988) Waters, L. B. F. M., van den Heuvel, E. P. J., Taylor, A. R., Habets, G. M. H. J., & Persi, P. 1988, A&A, 198, 200
- White et al. (1983) White, N. E., Swank, J. H., & Holt, S. S. 1983, ApJ, 270, 711