Unmasking the Active Galactic Nucleus in PKS J2310-437
Abstract
PKS J2310-437 is an AGN with bright X-ray emission relative to its weak radio emission and optical continuum. It is believed that its jet lies far enough from the line of sight that it is not highly relativistically beamed. It thus provides an extreme test of AGN models. We present new observations aimed at refining the measurement of the source’s properties. In optical photometry with the NTT we measure a central excess with relatively steep spectrum lying above the bright elliptical galaxy emission, and we associate the excess wholly or in part with the AGN. A new full-track radio observation with the ATCA finds that the core 8.64 GHz emission has varied by about 20 per cent over 38 months, and improves the mapping of the weak jet. With Chandra we measure a well-constrained power-law spectral index for the X-ray core, uncontaminated by extended emission from the cluster environment, with a negligible level of intrinsic absorption. Weak X-ray emission from the resolved radio jet is also measured. Our analysis suggests that the optical continuum in this radio galaxy has varied by at least a factor of four over a timescale of about two years, something that should be testable with further observations. We conclude that the most likely explanation for the bright central X-ray emission is synchrotron radiation from high-energy electrons.
Subject headings:
galaxies: active — galaxies: individual (PKS J2310-437) — galaxies: jets — X-rays1. Introduction
PKS J2310-437 is hosted by an elliptical galaxy at redshift , at the centre of a cluster of Abell richness 0 (Tucker et al., 1995). It is interesting and unusual in that it appears as a luminous () X-ray source, associated with a significant radio source (Tananbaum et al., 1997; Worrall et al., 1999), but with low optical luminosity and the characteristics of a typical elliptical galaxy. It shows no optical line emission as could be expected from an AGN, or UV continuum emission as from a BL Lac nucleus. This is not believed to be due to extinction as ROSAT X-ray data demonstrate a soft spectrum showing no excess absorption by gas in the J2310-437 galaxy (Tananbaum et al., 1997), and it would be hard to argue for a dust/gas torus that absorbs the AGN optical light without diminishing the soft X-ray emission.
Any optical AGN emission must be weak. Worrall et al. (1999) give an upper limit of 32 Jy at 4400Å, based on the size of the CaII break in a spectrum obtained in 1996, but suggested that the actual value lies close to this limit. Evidence for the presence of a weak AGN optical continuum is presented by Caccianiga and Maccacaro (1997) who find that the size of the CaII break in J2310-437 as measured through a narrow spectral slit to be 38 , which lies between the values expected of a BL lac object () and that of a typical elliptical galaxy (). They measured a larger break when using a wider spectral slit that would incorporate the same AGN emission diluted by more starlight. However, no absolute flux calibration was available to put qualitative evidence for AGN emission onto a more quantitative footing.
The radio structure is interesting, showing a one-sided jet that extends about 10 arcsec to the south-east of the core, embedded in a large-scale double plume (Worrall et al., 1999). That relatively large radio lobes can be seen on both sides implies that J2310-437 is seen less ‘end-on’ than expected of a BL Lac object. Worrall et al. (1999) suggest that the jet is to the line of sight based on a core prominence that is lower than expected for a BL Lac object.
Objects that show extreme characteristics in their multifrequency properties are likely to challenge most strongly our understanding of their emission mechanisms. In this paper we present new observations aimed at testing how well the extreme properties of J2310-437 might be fitted within the framework of emission models discussed for other AGN.
The redshift of J2310-437 is 0.0886. In this paper we adopt values for the cosmological parameters of km s-1 Mpc-1, , and . Thus 1 arcsec corresponds to a projected distance of 1.66 kpc at the source.
2. Observations
2.1. Observational objectives
We observed J2310-437 with the SUSI2 instrument on the European
Southern Observatory New Technology Telescope (ESO NTT) with the
intent of exploiting its excellent seeing to detect the
optical core of the galaxy and image the jet. We also
observed J2310-437 with Chandra to obtain
high-resolution spatial and spectral data so that the core AGN emission spectrum could be resolved from the galaxy and cluster, and also to
search for an X-ray jet corresponding to the radio jet. Finally, new
radio data were obtained using the Australian
Telescope Compact Array (ACTA). Two 12-hour tracks, 51 months apart,
have improved on the earlier results reported by
Worrall et al. (1999).
2.2. Optical Observations
Data in the UBVR- and I-bands were collected with the ESO 3.5m NTT equipped with the Superb Seeing Imager - 2 instrument (SUSI2) on the nights of 2004 August 7, and 2004 September 13 and 22. The SUSI2 CCD camera provides a field of view 5.5 x 5.5 arcmin2, with a scale of 0.16 arcsec pixel-1 (after 2x2 binning). Total integration times, central wavelengths and average seeing are given in Table 1.
| Band | U | B | V | R | I |
|---|---|---|---|---|---|
| Central (nm) | 357.08 | 421.17 | 544.17 | 641.58 | 794.96 |
| Integration time (s) | |||||
| FWHM (arcsec) | 1.05 | 0.64 | 0.63 | 1.30 | 0.40 |
2.2.1 Optical Data reduction
The raw data were processed using IRAF to bias-subtract, flat-field and apply gradient corrections. Dome flats were used for flat-fielding. The I-band images contained strong fringing which was removed by creating and subtracting a master fringe mask. Any remaining gradient was removed by subtracting a fitted background using IRAF. The images were then flipped along a vertical axis to bring them to sky orientation. A WCS was added to the images using an R-band optical image with attached world co-ordinate system that was previously acquired from the CTIO telescope. A median average was used to combine the data to create one mosaic for each band.This proved effective at removing cosmic ray hits. The number of overlapping frames used to create the mosaics were 10, 7, 6, 6 and 7 in U, B, V, R and I respectively. The seeing was particularly bad for the R-band data (Table 1), and so data in this filter are excluded from our subsequent analysis. Flux calibration was carried out using the photometry for standard stars PG1525A and PG1525B given in the Landolt Equatorial Standards table (Landolt, 1992). .
2.2.2 Radial Profile Extraction
Radial profiles in each optical band were extracted from the background-subtracted mosaics, and the count rates in each annulus were measured using IRAF. The count-rate error contributed by background subtraction was calculated by fitting a Gaussian to the histogram of pixel counts in the non-source regions of the background-subtracted images. The annular errors were calculated based on Poisson statistics and combined in quadrature with the background errors.
2.2.3 Galactic Modelling
To measure the flux density from the AGN the stellar component of the galaxy needed to be removed. This was carried out using GALFIT (Peng et al., 2002) which is an algorithm that fits 2-D parameterized models of galaxies and/or point sources to images. As J2310-437 lies in an elliptical galaxy the model used was a Sérsic profile (Sersic, 1968) of the form
where is the effective radius of the galaxy and is the surface brightness at . Cuspy galaxies have low values of the Sérsic index, n, and flatter-profile galaxies have higher n: n = 4 is the ‘classic’ de Vaucouleurs profile. is coupled to n such that half the total flux is within . First, all objects in the mosaiced image were masked and a sky level found. This was close to zero in the background-subtracted mosaics. A point spread function (PSF) for each band was created from stars in the field, using the DAOPHOT package in IRAF. Table 1 gives the FWHM of this PSF for each band. Then a central area twice the radius of the FWHM was masked on the galaxy, to mask the AGN contribution, and a Sérsic profile convolved with the PSF was fitted to the data. The parameters from the Sérsic model were then fixed and extrapolated into the central region. This model was subtracted leaving a residual image. The central flux excess was then measured from this residual image. The uncertainties in the flux excess were found by using combinations of Sérsic index, magnitude and effective radius (within uncertainties) that gave minimum and maximum contributions to the measured excess emission. These were added linearly with the statistical errors to give a total error on the excess (AGN) emission.
2.3. X-ray Observations
J2310-437 was included in the Chandra AO3 HRC GTO target list, and the source was observed on 2002 July 26 with the S3 back-illuminated CCD of the Chandra ACIS-S for 30 ks. The exposure was designed to take advantage of Chandra’s excellent spatial resolution to search for X-ray emission corresponding to the radio jet and to measure the spectrum of the core uncontaminated by emission from the cluster gas seen in ROSAT data. ACIS-S was used in 1/8 window mode to reduce the effect of pile up since the AGN is a strong point-like X-ray emitter. The pipeline data products were re-analyzed using CIAO 3.4 to apply recent calibrations, including corrections for the build up of contaminants on the ACIS that result in losses at low energy. The pixel randomization routinely applied to the ACIS data was turned off. We used a grade selection of 0,2,3,4,6. Since the data were taken in the very faint (VF) mode, we used VF screening to help clean the data and improve the signal to noise when searching for low surface brightness features associated with the radio jet. This procedure can reject valid events in regions where the count rate is high (i.e., the core of the AGN). Thus these data were restored (% of the counts) for our spectral analysis of the core. The ACIS readout streak that results from “out of time” events from the bright central core was removed for morphological analysis of the image. The readout streak is at a position angle of , and so does not contaminate the X-ray emission in the direction of the radio jet (see Fig. 1). There were no periods of high background and the final calibrated data have an exposure time of 26.75 ks.
2.4. Radio Observations
New radio observations of J2310-437 were made at C and X bands using the ATCA in 6D array with 6 antennas on 2000 April 4-5. Data were taken in full polarization over 128 MHz bands centered on 4.80 and 8.64 GHz, with flux density and bandpass calibrations based on PKS 1934-638, with assumed flux densities of 5.83 and 2.84 Jy, respectively. Calibration and imaging of the data followed standard techniques, with several self-calibration cycles, before the data were combined with the earlier (1997 January 29-30) data used in Worrall et al. (1999).

The new X-band image of J2310-437 based on both datasets is shown in Figure 1, and provides a better representation of the centre of the source than in the earlier image (Worrall et al., 1999), in particular in providing better information on the kpc-scale structure of the jet because of the improved weather and the presence of shorter antenna-antenna spacings in the array configuration in the 2000 observing session. . The core position is measured to be at ,, a slight refinement from the position given in Worrall et al. (1999). Fits to the images from the two epochs, taking account of the different data samplings by fitting the core as above extended jet emission using the AIPS task IMFIT, find that the core flux density has decreased from mJy to mJy at X band over 38 months, while the flux density has increased from to mJy at C band. This indicates both luminosity and spectral variability of the core.
The resolved (non-core) jet emission has flux densities of mJy at 8.64 GHz and mJy at 4.8 GHz within 10 arcsec of the core, corresponding to a spectral index of , and consistent with the typical spectral index found in kpc-scale radio jets.
3. Results
3.1. Optical
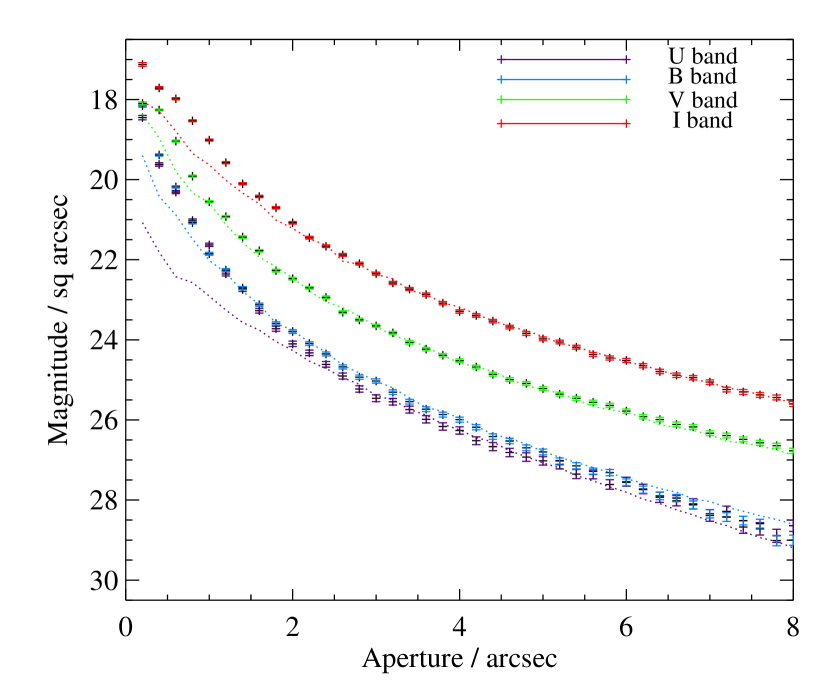
Figure 2 shows the surface brightness profile of each optical band with the Sérsic model-profile, extrapolated into the center, overlaid. The data show an excess over the Sérsic profile within of the nucleus. The best-fit parameters for the Sérsic models are given in Table 2, including total magnitudes integrated out to infinity.
| Band | U | B | V | I |
|---|---|---|---|---|
| Sérsic Index, n | 1.250.08 | 2.590.05 | 3.150.04 | 2.520.02 |
| Effective Radius, (arcsec) | 3.290.08 | 3.060.03 | 4.560.04 | 4.580.02 |
| Integrated Magnitude | 18.540.03 | 17.590.01 | 15.920.01 | 14.650.01 |
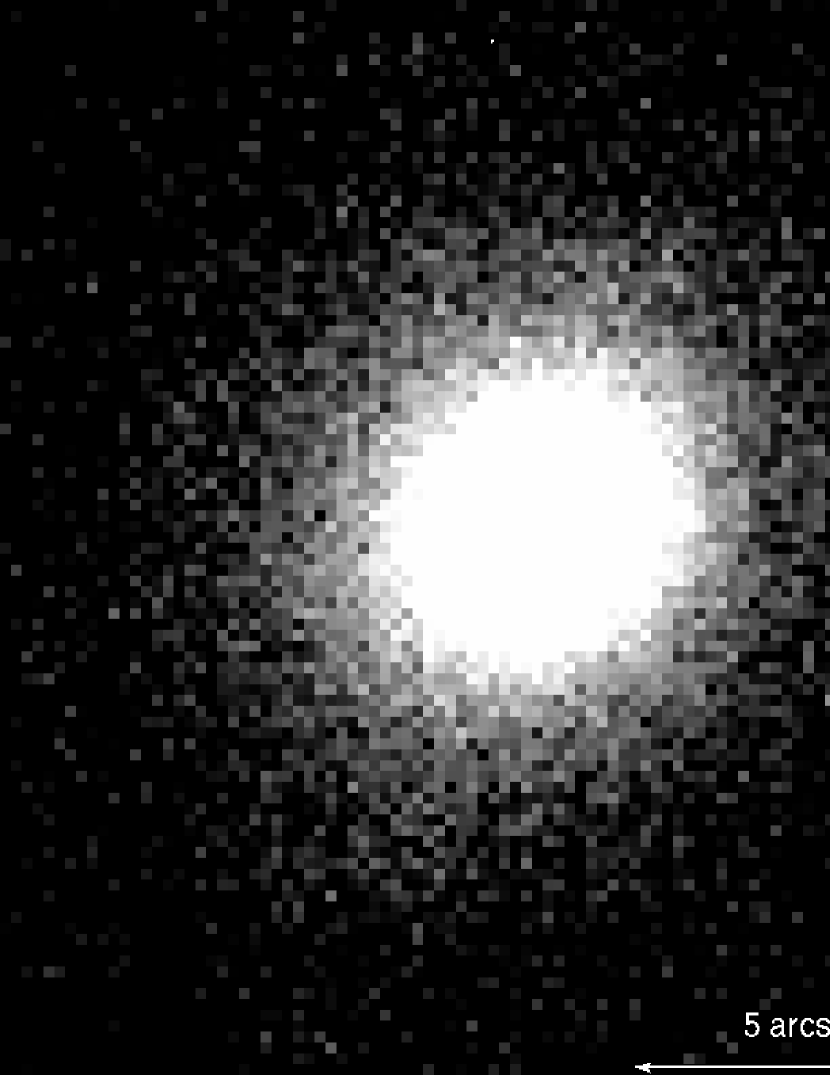
Figure 3 shows the J2310-437 host galaxy in the B filter on the left, and on the right the remaining excess after subtracting the galactic model fitted by GALFIT. The residuals were free of obvious structure related to the galaxy morphology, as can be seen in Figure 3. The values of residual (AGN) flux density are given in Table 3.
| Band | Frequency (Hz) | Flux Density (Jy) | Error (Jy) |
|---|---|---|---|
| U | 41.12 | ||
| B | 59.48 | ||
| V | 139.16 | ||
| I | 242.63 | ||
3.2. X-ray
3.2.1 Spatial Structure
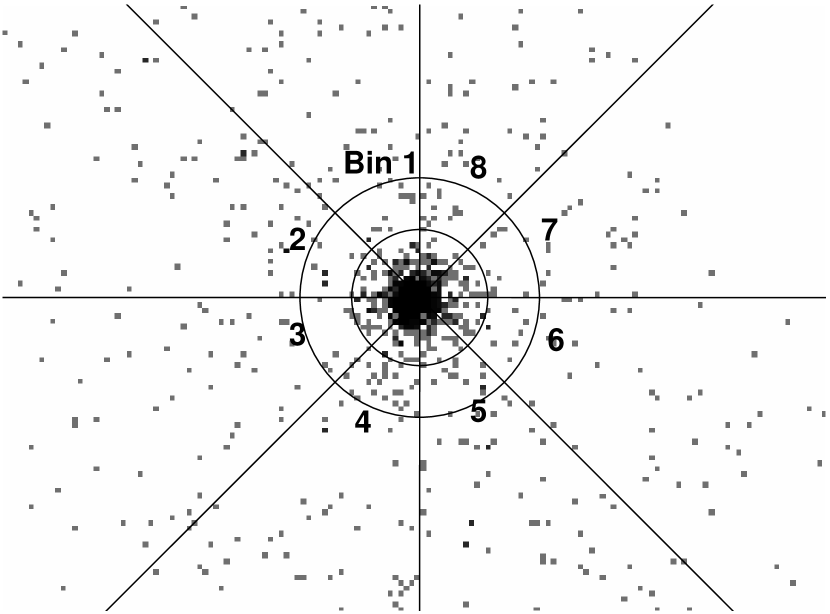
Visual inspection of the image showed evidence for weak X-ray emission at the position angle of the radio jet. To investigate this further, the cleaned data (0.3-7 keV) were summed in 8 azimuthal source-centered bins in an annulus with radii of 12.5 and 22 ACIS pixels (6.15 - 10.83 arc seconds) as shown in Figure 4. The total counts in each azimuthal bin (bins are numbered sequentially moving counter clockwise in the figure) are given in Table 4. In the analysis, events were assigned as being completely in or out of a bin (no fractional counts) and the integer number of image pixels in each bin was used to find the surface brightness, . Bin 4 is co-located with the outer part of the radio jet shown in Figure 1.

| Bin | Counts | Error | Pixels | counts/pixel | Error |
|---|---|---|---|---|---|
| 1 | 12 | 3.5 | 134 | 0.090 | 0.026 |
| 2 | 8 | 2.8 | 126 | 0.063 | 0.022 |
| 3 | 7 | 2.6 | 126 | 0.056 | 0.021 |
| 4 | 26 | 5.1 | 134 | 0.194 | 0.038 |
| 5 | 13 | 3.6 | 127 | 0.102 | 0.028 |
| 6 | 9 | 3.0 | 134 | 0.067 | 0.022 |
| 7 | 10 | 3.2 | 134 | 0.075 | 0.024 |
| 8 | 13 | 3.6 | 127 | 0.102 | 0.028 |
The mean number of counts in each azimuthal bin, excluding bin 4, is 10.3. This is significantly higher than the equivalent background rate far from the core source (4) and predominantly arises from the low level of scattered core events by the Chandra telescope. In bin 4 there are 26 counts. The Poisson probability of 26 or more counts given a mean of 10.3 is , which is equivalent to about a significance for existence in a Gaussian sense. (Note if the overall azimuthal mean of 12.3 counts bin-1 is taken instead, then the Poisson probability of 26 or more counts in bin is , equivalent to about a significance for existence in the Gaussian sense.) Taking into account the prior knowledge of the radio jet location, then the coincidence of the X-ray excess counts becomes more significant. The jet is detectable in the X-ray only because of the excellent performance of the Chandra X-ray telescope, both in terms of the central point spread function, and the very low scatter. The soft spectrum of the core (see §3.2.2) is helpful since soft X-rays are scattered less by the telescope.
In a 4-pixel (1.97-arcsec) radius circular region centered on the core the total number of counts is . Therefore the jet feature located between 6.15 and 10.83 arcsec from the core contains only % of the flux of the core. In the radio, the corresponding region contains % and % of the core flux density at 4.8 and 8.64 GHz, respectively. We did not detect the resolved jet in our optical observations and the high level of galaxy light means there are no useful limits to its flux in the NTT bands.
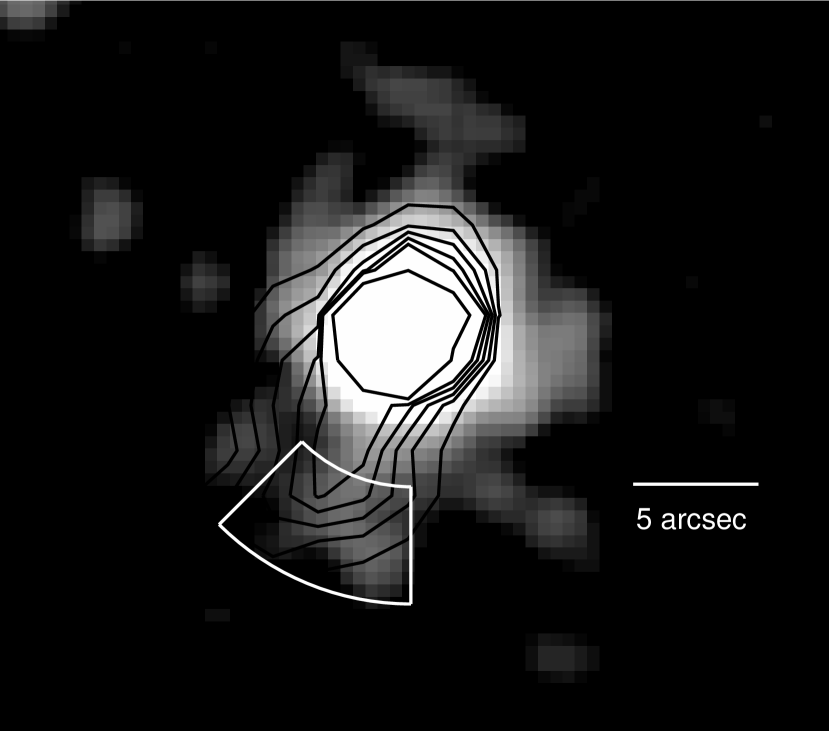
Figure 5 shows a smoothed X-ray image where a Gaussian of pixels (0.75 arcsec) is convolved with the data. The color map is logarithmic and stretched to emphasize the low count-rate features. The black contours are of the 4.8 GHz radio emission from combining the full tracks with the ATCA from 1997 and 2000, and the white region corresponds to bin 4 of Figure 4.
3.2.2 Core Spectrum
The X-ray spectrum of the core was extracted from a source-centered circle of radius 4.3 arcsec, with background from a source-centered annulus of radii 6.3 and 15 arcsec. Using xspec the data fitted well a power-law model with an absorption column density consistent with that for the line of sight through our Galaxy of cm-2. The fit gave for 176 degrees of freedom for a fit to the counts over 0.4-7 keV ( nets counts) grouped to a minimum of 25 counts per bin. Best-fit parameter values with errors for 2 interesting parameters are , cm-2. There was no significant improvement of fit if a thermal component was added to the model. This is not surprising: although X-ray emission from cluster gas was measured in ROSAT (Tananbaum et al., 1997; Worrall et al., 1999), the surface brightness is low, estimated at counts arcsec-2 (or about 3 total counts) under the core in the Chandra exposure.


The high count-rate from the core means that there are expected to be instances when two photons arrive within the readout time of the CCDs and are measured as one event of higher energy. We had alleviated the affect, known as pileup, by reducing the frame time to 0.4 s through reading out only 1/8 of the S3 chip. The xspec and sherpa spectral-fitting programmes each incorporate models which seek to take into account pileup. As expected, when we allowed for this the spectrum became slightly steeper and the 1 keV normalization was slightly higher, but still a single-power law with a low Hydrogen column density was the preferred underlying model. The level of pile-up was indicated as %, and in both cases there was a decrease in of roughly 3. Results for were similar to the fits which did not allow for pileup, and so we froze at the Galactic value. The spectrum is shown in Figure 6 and uncertainty contours in spectral index and normalization are given in Figure 7. Best-fit parameter values with errors for 2 interesting parameters are now with the normalization corresponding to a 1-keV flux density of Jy. The 1-keV flux density is in good agreement with results using the ROSAT PSPC and HRI. The spectral index is much better constrained because the PSPC was the only ROSAT detector with spectral information, and its relatively large PSF mixed % X-ray emission from cluster gas with the emission from the AGN.
While the pileup model gives a value for that is consistent with the Galactic value, our fits allow an additional small amount of column density intrinsic to the source, . The best fit value is cm-2 and the 90% upper limit is cm-2. This will be discussed in terms of a reddening correction to the optical data in §4.1.
3.2.3 Jet Spectrum
With so few photons in the jet, no attempt to fit a spectrum was made. However if the events are binned into three broad channels (0.5 keV, 0.5-2.5 keV, and 2.5 keV), then there are 3, 18, and 5 events in these bands. When this is compared with a similar breakdown for the core, we conclude that within the statistical errors of the jet counts, there is no evidence for its spectrum being significantly different (particularly harder or softer) than that of the core.

4. Discussion
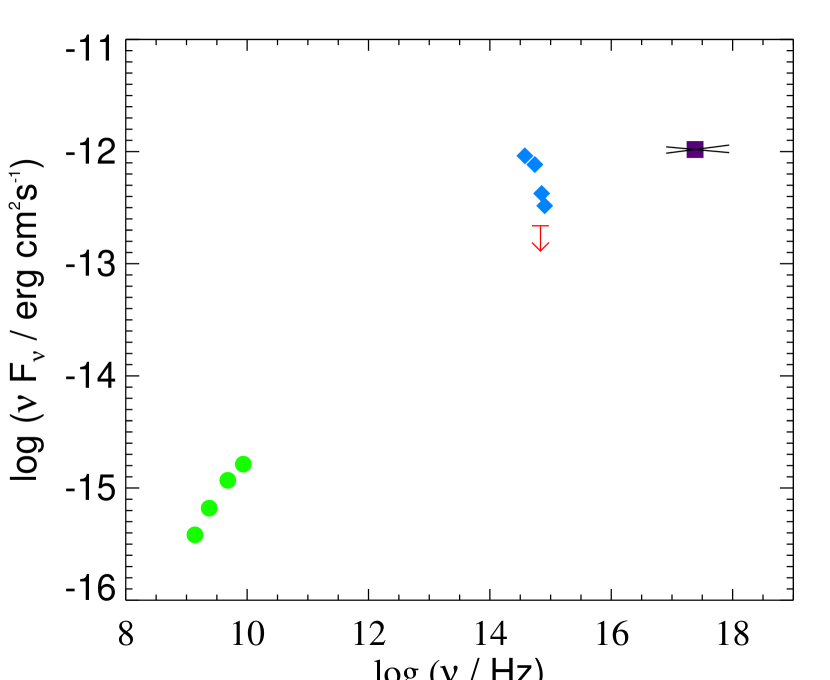
Our NTT optical observations have detected a central excess emission. Figure 8 shows that this emission has a steep spectrum compared with the flatter AGN emission seen at other wavelengths. However, the spectrum of the excess is blue compared with the emission from the elliptical galaxy (Figure 9), as expected for an AGN. One possibility is that the host galaxy is more cuspy than a simple elliptical. This is unaccounted for by the model we have fit and so the excess is contaminated with some level of starlight. It is of course possible that the extrapolation of the galaxy profile to small radii does not provide a sufficiently accurate baseline upon which to measure the AGN optical light. This might be supported by the fact that the upper limit of 32Jy in the blue estimated by Worrall et al. (1999) is a factor of below the NTT excess (Table 2). However, the discrepancy between these values can equally well be explained by variability. The radio is measured to vary by , and larger variability is expected from high-energy electrons emitting in the optical under a synchrotron-radiation interpretation (see below). In either case there are difficulties in developing a simple interpretation of the source in terms of known emission mechanisms, as discussed below.

As known previously, the low optical intensity and lack of nuclear emission lines means that the optical emission is not as expected from an optically-thick accretion disk associated with a supermassive black hole radiating at close to the Eddington luminosity. We therefore associate the nuclear optical emission with synchrotron emission from an unresolved jet, as is typical for FRI radio galaxies and BL Lac objects (Hardcastle and Worrall, 2000; Chiaberge et al., 1999). The difficulty then occurs in explaining the X-ray emission whose spectrum is now well measured with Chandra. An extrapolation of the X-ray spectrum to low energy falls well above the radio, but the radio and X-ray emission could be described by a broken power law, as is typical in other sources (e.g., Hardcastle et al., 2001), albeit that the break frequency is at a higher frequency than is typical. Such an example model spectrum is shown in Figure 10. However, the optical is a problem for such a model. If we say that the spectrum of the excess is that of the AGN, and that intensity variability explains the inconsistency with the previous upper limit, then we have to explain why the optical spectrum is much steeper than expected for the model. The obvious thing to consider is additional dust reddening that has not been taken into account. The relationship between extinction and column density of atomic hydrogen is given by Burstein and Heiles (1978) as
(see e.g., Wilkes et al. (1994)). In order to flatten the spectrum of the optical excess to agree with the single component synchrotron model in Figure 10 we would need of . However, we have placed a 90% upper limit on the level of intrinsic of based on the X-ray data. Therefore reaching consistency would point either to a highly anomalous gas-to-dust ratio, i.e., dust unlike Galactic dust, or that reddening cannot be the explanation for the steep optical spectrum. The only way to bring things into consistency with a simple broken-power-law synchrotron model would be to suggest that variability and contamination of starlight in the optical excess conspire in such a way that the underlying AGN spectral index matches the expected value, and that the AGN was brighter in 2004 than in 1996. We cannot rule out such a conspiracy.

Other possible explanations for the X-ray emission can be considered, such as inverse Compton scattering. There is no evidence for an intense photon field from a radiatively-efficient accretion disk, and, since the X-ray emission is from within the nucleus, scattering of cosmic microwave background photons gives a low yield, even if assisted by relativistic boosting. The yield from synchrotron self Compton is maximized if the source is made as compact as possible. We adopt a sphere of radius 0.2 pc, that was argued by Worrall et al. (1999) to be the smallest size reasonable to prevent the radio emission from being entirely self absorbed. The level of synchrotron self-Compton X-ray emission is insensitive to the high-energy cut-off of the synchrotron radiation, and we have calculated a result under a minimum-energy magnetic field for a synchrotron spectrum that cuts off rather than overproduces the optical excess. The result is shown as the dashed line in Figure 11. The X-ray intensity is underpredicted by more than two orders of magnitude. The intensity can be increased by reducing the magnetic field below the minimum-energy value, but even then the spectral slope will not match observations. We therefore rule out inverse Compton emission as the origin of the X-rays.
The usual alternative is to add a second high-energy component of synchrotron radiation, and that is shown as the high-energy line in Figure 11. This has been suggested as the explanation of the X-ray emission in resolved regions of some quasar jets (Röser et al., 2000; Jester et al., 2002). The difficulty is that in order not to overpredict the optical, the low-energy electron cut-off in this second component must be at very high energy (the Lorentz factor is in the example in Figure 11). There is a difficulty understanding how this second component can be produced, such that there are no low-energy electrons.
5. Summary
Our new optical, X-ray and radio observations of J2310-437 confirm it as an AGN with no more than a weak optical continuum, a relatively weak radio core and jet, but a strong unabsorbed X-ray power-law continuum. It is at the extreme of such a class of objects, and thus challenges an understanding in terms of the emission mechanisms applied most commonly to related active galaxies. Specifically, the X-ray emission is difficult to understand. An origin as the corona of a geometrically-thin radiatively-efficient accretion disk is ruled out by the weak optical emission. The X-ray intensity and spectrum appear to rule out an inverse Compton origin from a source component of plausible size, although in an attempt to explore this aspect further we are making VLBI observations to examine the structure and orientation of the jet on the smallest spatial scales on which the core is resolved. An X-ray synchrotron origin appears to be most likely, and under this model our optical observations of a central excess that may wholly or in part be associated with the AGN place constraints on the lower-energy population of electrons. To help tie down the level of association of the optical excess with AGN synchrotron emission, upcoming photometry with Spitzer will test if the longer-wavelength IR bands are dominated by non-thermal AGN emission, and test the extension of the spectrum of the measured central optical excess into the IR. The longer IR wavelengths will allow us to probe for anomalous dust properties that might be affecting the optical spectrum. For a single population of electrons that extend down to radio-emitting energies to be present, the optical emission must have been variable by factors of at least 4 between the different epochs of our observations. A better optical separation from the bright galaxy light, as would be possible with HST, over multiple epochs of observation, would test this possibility. If the tests fail, we seem forced to explain the X-ray emission as synchrotron radiation from a population of electrons with a very high low-energy cut-off — a Lorentz factor in our nominal model, although component size and any level of departure from minimum-energy will affect this value. It remains open as to how such an electron component might arise.
References
- Burstein and Heiles (1978) Burstein, D. and Heiles, C.: 1978, ApJ 225, 40
- Caccianiga and Maccacaro (1997) Caccianiga, A. and Maccacaro, T.: 1997, AJ 114, 2350
- Chiaberge et al. (1999) Chiaberge, M., Capetti, A., and Celotti, A.: 1999, A&A 349, 77
- Hardcastle et al. (2001) Hardcastle, M. J., Birkinshaw, M., and Worrall, D. M.: 2001, MNRAS 326, 1499
- Hardcastle and Worrall (2000) Hardcastle, M. J. and Worrall, D. M.: 2000, MNRAS 314, 359
- Jester et al. (2002) Jester, S., Röser, H.-J., Meisenheimer, K., and Perley, R.: 2002, A&A 385, L27
- Landolt (1992) Landolt, A.-U.: 1992, AJ 104, 340
- Peng et al. (2002) Peng, C. Y., Ho, L. C., Impey, C. D., and Rix, H.-W.: 2002, AJ 124, 266
- Röser et al. (2000) Röser, H.-J., Meisenheimer, K., Neumann, M., Conway, R. G., and Perley, R. A.: 2000, A&A 360, 99
- Sersic (1968) Sersic, J. L.: 1968, Atlas de galaxias australes, Cordoba, Argentina: Observatorio Astronomico, 1968
- Tananbaum et al. (1997) Tananbaum, H., Tucker, W., Prestwich, A., and Remillard, R.: 1997, ApJ 476, 83
- Tucker et al. (1995) Tucker, W. H., Tananbaum, H., and Remillard, R. A.: 1995, ApJ 444, 532
- Wilkes et al. (1994) Wilkes, B. J., Tananbaum, H., Worrall, D. M., Avni, Y., Oey, M. S., and Flanagan, J.: 1994, ApJS 92, 53
- Worrall et al. (1999) Worrall, D. M., Birkinshaw, M., Remillard, R. A., Prestwich, A., Tucker, W. H., and Tananbaum, H.: 1999, ApJ 516, 163