Long-term Stability of Non-thermal X-ray Modulation
in the Gamma-ray Binary LS 5039
Abstract
We report on long-term stability of X-ray modulation apparently synchronized with an orbital period of 3.9 days in the -ray binary LS 5039. Recent observations with the Suzaku satellite in the year 2007, which covered continuously more than one orbital period, have provided us with detailed characterization of X-ray flux and spectral shape as a function of orbital phase. Motivated by the results from Suzaku, we have re-analyzed the X-ray data obtained with ASCA, XMM-Newton, and Chandra between 1999 and 2005, to investigate long-term behavior of LS 5039 in the X-ray band. We found that the modulation curves in 1999–2007 are surprisingly stable. Even fine structures in the light curves such as spikes and dips are found to be quite similar from one orbit to another. The spectral characteristics observed in the past are consistent with those seen with Suzaku for some orbital phase segments. We suggest that magneto-hydrodynamical collisions between the relativistic outflow from a compact object and the stellar wind from the O star explain the clock-like non-thermal X-ray emission over eight years through remarkably stable production of high-energy particles near the binary system.
Subject headings:
X-rays: individual (LS 5039) — X-rays: binaries — radiation mechanisms: non-thermal1. INTRODUCTION
Gamma-ray binaries, a new sub-category of X-ray binaries that radiate very high energy (VHE) -rays, have been attracting much attention since such sources were detected by modern air Cherenkov telescopes. Up to now, TeV -rays are detected from four binary systems; LS 5039 (Aharonian et al., 2005a), PSR B125963 (Aharonian et al., 2005b), Cygnus X-1 (Albert et al., 2006), and LS I +61 303 (Albert et al., 2007; Acciari et al., 2008). While a compact star powering the system is known to be a young radio pulsar in PSR B125963, a black hole in Cygnus X-1 (still an evidence of TeV -ray detection), it remains controversial in the case of LS 5039 and LS I +61 303. Also, HESS J0632+057 is pointed out as a candidate to new gamma-ray binary (Hinton et al., 2009).
The LS 5039 system was designated as a high mass X-ray binary based on the ROSAT all-sky survey data by Motch et al. (1997). The stellar companion is a bright star with V=11.2 and its spectral type is O6.5V((f)). The distance to the binary is estimated as kpc (Casares et al., 2005). The compact object is orbiting around the stellar companion with an orbital period days and with eccentricity (Casares et al., 2005). Milliarcsecond-scale collimated outflows extending up to 1000 AU were detected by radio observations (Paredes et al., 2000, 2002; Ribó et al., 2008).
Recent observations by H.E.S.S. revealed that LS 5039 is a source of Very High Energy (VHE) -rays and hence, is able to accelerate particles to multi-TeV energies (Aharonian et al., 2005a). Moreover, H.E.S.S. detected an orbital modulation of the VHE emission with its orbital period (Aharonian et al., 2006). The light curve as a function of orbital phase has a peak around inferior conjunction (when the compact object appears between the optical star and the observer).
Most recently, new X-ray observations with Suzaku have enabled us to fully characterize the flux and spectral shape as a function of phase over one and a half orbital periods (Takahashi et al., 2009). The Suzaku observations showed that the X-ray spectrum at each orbital phase can be well fit by a power law and that photon indices vary within –1.60 depending on orbital phase. Based on the Suzaku and H.E.S.S. data, it was concluded that the X-ray emission is likely to be synchrotron radiation from relativistic electrons which are also responsible for the VHE -ray emission via inverse Compton scattering (Takahashi et al., 2009).
Now that the X-ray characteristics of LS 5039 for more than one orbital period has been uncovered by Suzaku, it is crucial to compare the temporal and spectral behavior as a function of orbital phase between the Suzaku data and past X-ray data. Whether or not the orbital modulation is stable during the past decade should provide us with clues to understand the emission mechanism and the nature of the compact object in the LS 5039 system. In this Letter, we report on the discovery of the long-term stability of the X-ray orbital modulation, by combining the archival ASCA, XMM-Newton, and Chandra data with the recent Suzaku data.
2. DATA REDUCTION
LS 5039 has been observed several times in X-rays for limited period with ASCA, XMM-Newton, and Chandra (see Bosch-Ramon et al., 2007). The log of those observations as well as the Suzaku observation is given in Table 1. Data reduction and analysis methods for the Suzaku data are described in Takahashi et al. (2009). Barycentric correction was performed for all the data in the following analysis.
| Date | Mission | Observation ID | MJD | Exposure (ks) | Phase | a,ba,bfootnotemark: | aaQuoted errors are at the 90 % confidence level. | Flux(1–10 keV)a,ca,cfootnotemark: | dd is calculated from the modeled orbital light curve. | |
|---|---|---|---|---|---|---|---|---|---|---|
| 1999–10–04 | ASCA | 47001000 | 51455.5 | 24.4 | 0.30–0.49 | 6.4 1.7 | 1.55 0.12 | 9.59 0.28 | 5.7 (13) | |
| 0.30-0.40 | 6.4 (fix) | 1.55 0.10 | 8.73 0.43 | |||||||
| 0.40-0.49 | 6.4 (fix) | 1.54 0.07 | 10.42 0.36 | |||||||
| 2003–03–08 | XMM-Newton | 0151160201 | 52706.3 | 10.3 | 0.52–0.55 | 7.2 0.6 | 1.51 0.07 | 9.20 0.17 | 8.2 (6) | |
| 2003–03–27 | XMM-Newton | 0151160301 | 52725.8 | 10.3 | 0.53–0.56 | 7.0 0.5 | 1.45 0.07 | 8.93 0.17 | 5.9 (6) | |
| 2004–07–09 | Chandra | 4600 | 53195.1 | 11.0 | 0.67–0.71 | 7.9 0.8 | 1.49 0.06 | 12.33 0.28 | 5.2 (6) | |
| 2004–07–11 | Chandra | 5341 | 53197.5 | 17.9 | 0.28–0.34 | 7.9 0.8 | 1.53 0.05 | 7.33 0.17 | 4.5 (10) | |
| 2005–09–22 | XMM-Newton | 0202950201 | 53635.8 | 15.1 | 0.46–0.51 | 6.8 0.4 | 1.43 0.05 | 10.36 0.15 | 8.9 (12) | |
| 2005–09–24 | XMM-Newton | 0202950301 | 53637.8 | 9.8 | 0.99–0.02 | 7.0 0.9 | 1.57 0.10 | 5.99 0.14 | 3.4 (9) | |
| 2007–09–15 | Suzaku | 402015010 | 54352.7 | 203.2 | 0.00–1.47 | 7.7 0.2 | 1.51 0.02 | 8.07 0.06 |
2.1. ASCA
The scientific payload of ASCA consisted of two co-aligned detector systems, the Gas Imaging Spectrometer (GIS; Ohashi et al. 1996) and the Solid-state Imaging Spectrometer (SIS; Burke et al. 1991). The GIS and SIS detectors covered the energy range of 0.7–10 keV and 0.5–10 keV, respectively. Considering the low-background and large effective area at high energies, we used only the data from the GIS detectors. During the observation the GIS was operated in a normal PH mode, and standard screening procedures were applied for the analysis. The source photons were accumulated from a circular region with a radius of while background region was chosen in the same field of view with the same radius and an offset of from the source. The averaged source and background count rates in the energy range of 1–10 keV are 0.12 cnt s-1 and 0.02 cnt s-1, respectively, for each GIS detector. In order to improve statistics, the source photons of both GIS detectors (GIS2 and 3) were co-added.
2.2. XMM-Newton
For the XMM-Newton observations, we analyzed data from the European Photon Imaging Camera (EPIC), which consists of two MOS (Turner et al., 2001) and one PN (Strder et al., 2001) CCD arrays. All the observations were performed with the Medium filters; the observing modes were Prime Small Window (time resolution 6 ms) and Prime Partial W2, for the PN and MOS cameras, respectively. Reduction and analysis of the data were performed following the standard procedure using the SAS 7.0.0 software package. After discarding high-background time intervals, the source photons were accumulated from a circular region with a radius of . Since the fluxes measured by the EPIC PN instrument show systematically – smaller values in comparison with the fluxes measured by the EPIC MOS, we used only MOS data and co-added source photons of both detectors (MOS1 and 2). The averaged source and background count rates in 1–10 keV are 0.45 cnt s-1 and 0.02 cnt s-1, respectively, for each MOS.
2.3. Chandra
We analyzed data from Advanced CCD imaging Spectrometer (ACIS; Garmire et al. (2004)) for Chandra observations. Because of the superb angular resolution of the X-ray mirror ( for on-axis observations), the Chandra data could be easily affected by pile-up, particularly when a source is observed on-axis. The pile-up effect causes underestimate of source flux and derivation of harder spectral index. In four data sets in the Chandra Data Archive, LS 5039 was observed on-axis for two of them (ObsID: 2730, 6259), and was observed off-axis for the other two (ObsID: 4600, 5341). In the previous analysis by Bosch-Ramon et al. (2007), the spectra of the on-axis observations actually showed harder photon indices () compared with the Suzaku results. Bosch-Ramon et al. (2007) noted that their results are likely to be affected by the pile-up effects. We also analyzed the same data sets and concluded that the pile-up effects are significant and difficult to be accurately restored. We therefore made use of the data from the two off-axis observations to avoid large systematic errors. In the data analysis, the Chandra Interactive Analysis of Observations software package (CIAO 3.4) was used to extract the spectrum, following the standard procedure given in the Chandra analysis thread. The source photons were accumulated from a circular region with a radius of while the background region was chosen in the same field of view with the same radius and an offset of from the source. The averaged source and background count rates in 1–10 keV are 0.40 cnt s-1 and 0.02 cnt s-1, respectively.

3. ANALYSIS AND RESULTS
3.1. Spectral Analysis
Takahashi et al. (2009) reported that the Suzaku spectra of LS 5039 are well fit with power laws and the photon indices vary within –1.60 depending on orbital phase (see Figure 1). We performed spectral fitting for the all archival data to compare with the Suzaku results.
All the spectra are well represented by absorbed power-law functions (using the model in XSPEC, Morrison & McCammon 1983). In Table 1, we show the resulting fitting parameters, which agree with the literature (Bosch-Ramon et al. 2007; Martocchia et al. 2005). The photon indices obtained for the ASCA, XMM -Newton, and Chandra are within –1.55, and consistent with the Suzaku values within statistical errors. In addition, the values obtained are generally consistent with the Suzaku best-fit values although the statistical errors are relatively large.
In Figure 1, we plot the photon indices and flux in the range 1–10 keV as a function of orbital phase. Here, the orbital phase is calculated with the period of 3.90603 days and with reference epoch (HJD 2400000.5 = 51942.59) taken from Casares et al. (2005). Typical cross calibration uncertainty for photon index is 0.1, estimated from independent fits of Crab spectrum (Kirsch et al., 2005; Kokubun et al., 2007). We fixed the photoelectric absorption column density at for phase-resolved Suzaku spectra, which is obtained from the phase-averaged Suzaku spectrum. Also, phase-resolved ASCA spectra were fit using frozen at the phase-averaged value. As seen in Figure 1, the photon indices obtained in the past observations follow the tendency seen in the Suzaku data, where the indices become smaller () around apastron and larger () around periastron. TeV -ray emission presents similar trends in flux and photon indices (Aharonian et al., 2006) as those of X-rays. Remarkably, the X-ray flux shows almost identical phase dependency between the Suzaku and the other data sets as seen in the bottom panel of Figure 1. The similar tendency in fluxes and photon indices were also presented in Bosch-Ramon et al. (2005), although the data were background contaminated and this prevented a proper photon index determination. The results above indicate that the overall orbital modulation has been quite stable over the past eight years. Variability on shorter timescales is studied in the following subsection.
3.2. Temporal Analysis
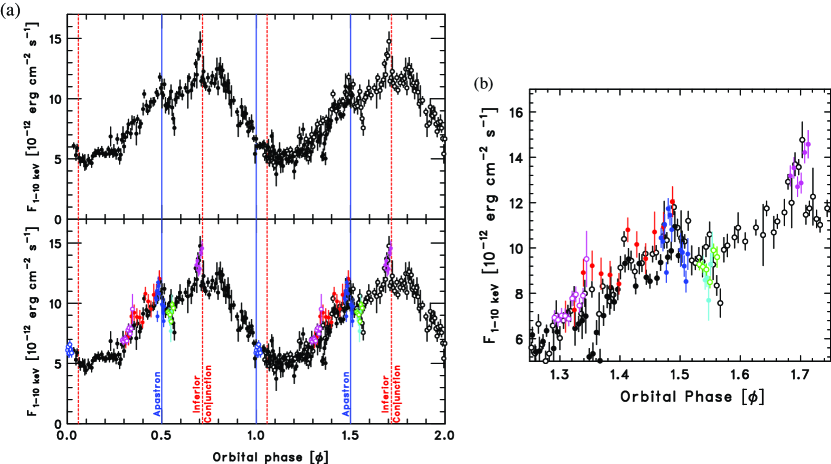
The Suzaku light curves by Takahashi et al. (2009) revealed variability on short time scales of . To investigate the long-term behavior of the X-ray modulation, we compared the light curve by Suzaku and those obtained in the past observations. To directly compare the light curves obtained with the different detector systems, we need to convert detected counting rate to absolute energy flux for each bin of the light curves. For all the data other than the Suzaku, we assumed power-law spectra with parameters shown in Table 1 and converted the counting rate of each time bin to power-law flux (unabsorbed flux). We adopted variable bin widths to have equalized errors for different data sets. For the Suzaku data, since the spectral parameters, particularly photon indices, are significantly changed during the observation, we converted the observed counting rate assuming the power-law parameters obtained The left panel of Figure 2 shows the resulting light curves in the energy range of 1–10 keV. Also, a magnified plot of the light curve is shown in the right panel of Figure 2. The phase-folded X-ray light curves from the ASCA, XMM-Newton, and Chandra observations are in remarkable agreement with those from Suzaku. More surprisingly, short-time variability seen in the Suzaku 2007 data can be recognized in the previous 1999–2005 data. For instance, a small peak around is evident both in the Suzaku and Chandra data although the two observations are performed almost three years apart. When the Suzaku data points in excluding the peak structure are approximated to a linear function, the deviation of this peak structure from the continuum corresponds to 5.6 significance. The flux drop around is also consistent between the Suzaku and XMM-Newton data within statistical errors. The deviation of the drop structure from an extrapolated linear function determined from the Suzaku data points in is 7.4 significance. The ASCA data, which were obtained 8 years before the Suzaku observation, also reproduce the Suzaku light curve not only for the overall flux increase but also for the small peaks around and . Since the X-ray spike around is located around inferior conjunction (when the compact object appears between the stellar companion and the observer), it seems to be due to a rather geometrical than physical effect in the sense that it is connected to a direction to the observer. In this regard, the Doppler effect is a possible way of boosting or modulating the X-ray flux along the orbital phase, as pointed out in Bogovalov et al. (2008). It should be noted that there are slight differences in the phase-folded light curves. Although a small spike at in the Suzaku light curve agrees well with the Chandra light curve as seen in the left panel of Figure 2, it is evident in the right panel that the Chandra spike lasts longer than the Suzaku one by . Also, only the second orbit data of Suzaku shows a dip-like structure at , while there are no such structures in the other data including the first orbit data of Suzaku.
The largest systematic errors in flux of each time bin are due to uncertainties in the cross calibration between each detector system. Although cross calibration for a source with hard spectrum like LS 5039 has not been performed extensively, the discrepancy in the absolute flux is thought to be less than 20% in the current calibration uncertainties (e.g. see http:www.iachec.orgiachec_2008_meeting.html for the current cross calibration issues). This number is rather large if compared to the amplitude of the small structures seen in the light curves. However, the agreement of the similarity of shapes between Suzaku and other observatories would not simply be a chance coincidence in most cases since the agreement is seen for more than one observation by Chandra and XMM-Newton. In order to quantitatively estimate the similarity of shapes, we interpolated the Suzaku light curve and compared with each orbital segment’s light curve. The interpolated values are calculated with the Suzaku light curve of 5 ks time bins and a spline function, and values are derived from the difference between the interpolated and each light curves. Each value is pesented in Table 1. The model light curve is acceptable in the confidence level of 10–90% from test for each segment. We note that the issue whether the source is really periodic or not at X-rays, despite the appearance, is still not solved statistically in periodicity analysis.
4. DISCUSSION
We have shown that the orbital modulation of LS 5039 is surprisingly stable over the past eight years. It is remarkable that not only the overall modulation but also the fine structures in the light curve agree well between the data from Suzaku and those from other X-ray observatories.
Considering the long-term stability, it is quite difficult to attribute the X-ray emission of LS 5039 to the emission from hot plasma around an accretion disk, which is often observed from black hole binaries in low/hard state, since such emission is generally expected to show unstable and unpredictable time variability (Lewin & van der Klis, 2006). Although the jet formation and the production mechanism of non-thermal radiation in the jet are still unclear, it might be difficult to explain the emission from LS 5039 as synchrotron emission from a jet, since jet activities are thought to be connected to accretion activities and disk instabilities affect the jet formation and radiation (Fender et al., 2004). Among currently proposed models for LS 5039, a scenario in which the radiation is related to an ultrarelativistic pulsar wind (Dubus, 2006; Sierpowska-Bartosik & Torres, 2008) would be able to account for the stable clock-like X-ray and TeV -ray behavior. In this scenario, particles move relativistically in the pulsar wind, or are accelerated in shocks created by the interaction of this pulsar wind with the stellar wind. However, it should be noted that the H.E.S.S. results do not favor this scenario in its standard form, in which the emitter is expected to be located between the compact object and the stellar companion (Bosch-Ramon et al., 2008). In this case, the absorption is so severe that even cascading cannot help to explain disagreement between the measured and predicted fluxes around . In order to avoid the heavy absorption, -rays are assumed to be produced at the periphery of the binary system in Takahashi et al. (2009), similarly as in Khangulyan et al. (2008).
It is of importance to compare the results with those obtained for other gamma-ray binaries like PSR B125963 and LS I +61 303. In contrast to the LS 5039 case, the X-ray emission from these two objects does not seem to show precise repeating features (Chernyakova et al., 2006; Uchiyama et al., 2009). This might be due to the difference of the stellar object type or compact object in the systems. While LS 5039 host an O star, both PSR B125963 and LS I +61 303 contains a Be star, which is characterized with a dense equatorial disk. Since a stellar disk plays an important role for X-ray emission in the pulsar scenario (Tavani & Arons, 1997), it is possible that changes in disk structure avoid short time repeating features in X-ray modulation. Romero et al. (2007) actually pointed out that the stellar disk in LS I +61 303 would be likely disrupted around periastron passage by tidal forces from the compact object. On the other hand, the emission from LS 5039 may be determined only by the location of the compact object relative to the O star and thus exhibit precise repeating features.
References
- Acciari et al. (2008) Acciari, V. A., et al. 2008, ApJ, 679, 1427
- Aharonian et al. (2005a) Aharonian, F. A., et al. 2005, Science, 309, 746
- Aharonian et al. (2005b) Aharonian, F. A., et al. 2005, A&A, 442, 1
- Aharonian et al. (2006) Aharonian, F. A., et al. 2006, A&A, 460, 743
- Albert et al. (2006) Albert, J., et al. 2006, Science, 312, 1771
- Albert et al. (2007) Albert, J., et al. 2007, ApJ, 665, L1
- Bogovalov et al. (2008) Bogovalov, S. V., et al. 2008, MNRAS, 387, 63
- Bednarek (2009) Bednarek, W. 2009, submitted to MNRAS(astro-ph/0901.0392)
- Bosch-Ramon et al. (2005) Bosch-Ramon, V., et al. 2005, ApJ, 628, 388
- Bosch-Ramon et al. (2007) Bosch-Ramon, V., et al. 2007, A&A, 473, 545
- Bosch-Ramon et al. (2008) Bosch-Ramon, V., et al. 2008, A&A, 489, L21
- Burke et al. (1991) Burke, B. E., et al. 1991, IEEE Trans. ED-38, 1069
- Casares et al. (2005) Casares, J., Rib M., et al. 2005, MNRAS, 364, 899
- Chernyakova et al. (2006) Chernyakova, M., Neronov, A., & Walter, R. 2006, MNRAS, 372, 1585
- Dubus (2006) Dubus, G. 2006, A&A, 456, 801
- Fender et al. (2004) Fender, R. P., Belloni, T.M., and Gallo, E. 2004 MNRAS, 355, 1105
- Garmire et al. (2004) Garmire, G. P. et al. 2002, Proc. SPIE, 4851, 28
- Hinton et al. (2009) Hinton, J. A. et al. 2009, ApJ, 690, L101
- Khangulyan et al. (2008) Khangulyan, D, Aharonian, F., & Bosch-Ramon, V. 2008, MNRAS, 383, 467
- Kirsch et al. (2005) Kirsch, M. G., et al. 2005, SPIE, 5898, 22
- Kokubun et al. (2007) Kokubun, M., et al. 2007, PASJ, 59, S53
- Koyama et al. (2007) Koyama, K., et al. 2007, PASJ, 59, S23
- Lewin & van der Klis (2006) Lewin, W., and van der Klis, M. 2006, Compact Stellar X-ray Sources, Cambridge Univ. Press.
- Martocchia et al. (2005) Maetocchia, A., Motch, C., and Negueruela, I. 2005, A&A, 430, 245
- Morrison & McCammon (1983) Morrison, R., & McCammon, D. 1983, ApJ, 270, 119
- Motch et al. (1997) Motch, C., et al. 1997, A&A, 323, 853
- Ohashi et al. (1996) Ohashi, T., et al. 1996, PASJ, 48, 157
- Paredes et al. (2000) Paredes, J. M., Marti, M., Ribo, M., and Massi, M. 2000, Science, 288, 2340
- Paredes et al. (2002) Paredes, J. M., et al. 2002, A&A, 393, L99
- Ribó et al. (2008) Rib, M., et al. 2008, A&A, 481, 17
- Romero et al. (2007) Romero, G. E., et al. 2007, A&A, 474, 15
- Sierpowska-Bartosik & Torres (2008) Sierpowska-Bartosik, A., & Torres, D. 2008, Aph., 30, 239
- Strder et al. (2001) Strder, L. et al. 2001, A&A, 365, L18
- Takahashi et al. (2009) Takahashi, T., et al. 2009, submitted to ApJ(astro-ph/0812.3358)
- Tavani & Arons (1997) Tavani, M., & Arons, J. 1997, ApJ, 477, 439
- Turner et al. (2001) Turner, M. J. L. et al. 2001, A&A, 365, L27
- Uchiyama et al. (2009) Uchiyama, Y., et al. ApJ, in press