Probing Quantum Hall Pseudospin Ferromagnet by Resistively Detected NMR
Abstract
Resistively Detected Nuclear Magnetic Resonance (RD-NMR) has been used to investigate a two-subband electron system in a regime where quantum Hall pseudo-spin ferromagnetic (QHPF) states are prominently developed. It reveals that the easy-axis QHPF state around the total filling factor can be detected by the RD-NMR measurement. Approaching one of the Landau level (LL) crossing points, the RD-NMR signal strength and the nuclear spin relaxation rate enhance significantly, a signature of low energy spin excitations. However, the RD-NMR signal at another identical LL crossing point is surprisingly missing which presents a puzzle.
pacs:
73.43.Nq, 71.30.+h, 72.20.MyThe multi-component electron systems have been continuously drawing intensive research interest because of its novel ground states and excitations DasSarma . In experimental systems, different Landau levels (LLs) can be tuned to cross by varying gate voltage, charge density, magnetic field or the magnetic field tilted angle to the sample. Electron-electron correlations become particularly prominent when two or more sets of LLs with different layer, subband, valley, spin, or Landau level indices are brought into degeneracy DasSarma ; Wescheider1999 ; Shayegan2000 ; Hirayama2001 ; Jiang2005 ; Jiang2006 ; Tsui2006 ; Shayegan2006 . Recent experiments in single quantum well with two subbands occupied systems Jiang2005 ; Jiang2006 , showed evidence of the formation of quantum Hall pseudospin ferromagnets (QHPFs) due to the interactions of the two subbands (termed as pseudospins) around the LLs crossing point. The QHPFs taking place at total filling factor and are easy-plane or easy-axis QHPFs respectively, depending on the details of the two subbands configurations. In spite of various theoretical models MacDonald2000 ; DasSarma2003 ; Hao2008 motivated by these findings, a comprehensive understanding is not yet achieved. Thus far, experimental and theoretical studies all focused on the pseudospin freedom. However, in this work we would address the unique spin excitations in the QHPF states.
To address the question whether spin states in two-subband systems in nature, measurements other than the conventional transport and optical means are needed. Since the Zeeman energy of nuclear spin is about orders of magnitude smaller than that of electron spin, exchange of spin angular momentum between the electron and nuclear spin is allowed only when the electron system supports spin excitations with low energy. The nuclear spin relaxation rate thus probes the density of states at low energy of the electron spin system that cannot be accessed by other means. The resistively detected NMR technique has recently emerged as an effective method to probe collective spin states in the fractional quantum Hall regime KlitzingNMR1 ; KlitzingNMR2 , the Skyrmion spin texture close to the filling factor PortalNMR ; TsuiNMR , the role of electron spin polarization in the phase transition of a bilayer system EisensteinNMR ; HirayamaNMR1 , and the ferromagnetic state accompanied by collective spin excitations of a two-subband system JiangNMR . Here we use this technique to study spin freedom and its relation with pseudospin in the vicinity of the QHPF states at filling factor . It reveals that the easy-axis QHPF state at is sensitive to the RD-NMR measurement. As approaching to one LL crossing point at where the easy-axis QHPF phase is well developed, the RD-NMR signal strength and the nuclear spin relaxation rate enhance quickly which may be due to the low energy spin excitations there. Furthermore, the RD-NMR signal can be suppressed anomaly at another identical LL crossing point of .
The sample was grown by molecular-beam epitaxy and consists of a symmetrical modulation-doped nm wide single GaAs quantum well bounded on each side by Si -doped layers of AlGaAs with doping level cm-2. Heavy doping creates a very dense 2DEG, resulting in the filling of two subbands in the well. As determined from the Hall resistance data and Shubnikov-de Haas oscillations in the longitudinal resistance, the total density is cm-2, where the first and the second subband have a density of cm-2 and cm-2. The sample has a low-temperature mobility cm2/V s, which is extremely high for a 2DEG with two filled subbands. A m wide Hall bar with m between voltage probes was patterned by standard lithography techniques. A NiCr top gate was evaporated on the top of the sample, approximately nm away from the center of the quantum well. By applying a negative gate voltage on the NiCr top gate, the electron density can be varied continuously. Several turns of NMR coil were wound around the sample, which was placed in a Top-Loading Dilution Refrigerator with a base temperature of mK. A small radio frequency (rf) magnetic field generated by the coil with a matching frequency will cause NMR for 75As nuclei, where the gyromagnetic ratio MHz/T. The resistance was measured using quasi-dc lock-in technique with Hz.
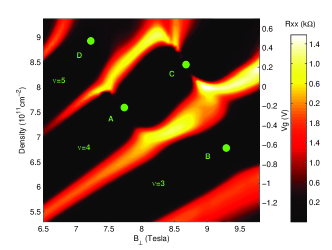
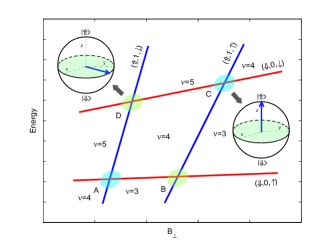
In the present work, we refer the first and second subbands, to as symmetric and antisymmetric states. In the pseudo-spin language, one of them can be labeled as pseudo-spin up () and the other as pseudo-spin down (). When a magnetic field is applied, the energy spectrum of the quantum well discretizes into a sequence of Landau levels. We label the single-particle levels (), which (), , and () are the pseudo-spin, orbital and spin quantum numbers. In the present work we have concentrated our study around the filling factor , where the filling factor denotes the number of filled Landau levels. The longitudinal resistance in the density () - perpendicular magnetic field () plane exhibits a square-like structure around , as shown in Fig. 1a. The most noticeable feature of the square-like structure is the disappearance of the extended states (i.e., bright lines) on its four boundaries, marked by A, B, C, D in Fig. 1a. Here point A corresponds to the degeneracy point of and , point B corresponds to that of and , point C corresponds to that of and , point D corresponds to that of and , as illustrated schematically in the Landau level fan diagram Fig. 1b. The disappearance and result square structure represents a pseudo-spin ferromagnet, which is due to the opening pseudo-spin gaps of easy-plane or easy-axis pseudo-spin ferromagnetic states, respectively at the level crossing points of B, D and A, C, as depicted in Fig. 1b Jiang2005 ; Jiang2006 ; Hirayama2001 ; MacDonald2000 .
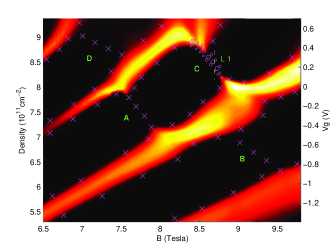
RD-NMR, performed in the proximity of the square structure, reveals prominent (absent) NMR signal at different regions. In order to get a clear signal and minimize heat effect, most of experiments were carried out with a rf power of dBm. The ac current was nA, and a large dc current nA were applied to enhance the NMR signal. All the measurements were carried out at temperature below mK. The measurement result under the same condition are shown in Fig. 2a, the cross and circle symbols in the map denote the places where the NMR signals are measured. The cross ’’ means the places where there are no NMR signals, while the circle ’’ shows the places where the NMR signals are observed. And the size of ’’ symbols give a schematic illustration of the strength of NMR signals. From this map we found that the NMR signals only occur at the upper arm of the square structure around crossing point C, while we didn’t find any signal at the lower arm of this square structure around another crossing point A and its two sides around crossing point B and D.
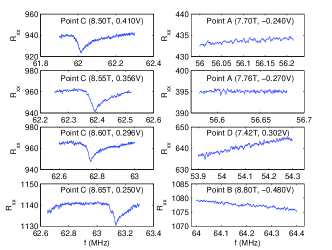
Now we focused on the region around the LL crossing point C, where pronounced NMR signals were observed. Typical NMR lines around point C are shown in Fig. 2b. The relative change of is typically about 1% at resonance. Upon resonance, in all NMR lines shows a sharp decrease followed by a much slower relaxation process back to its original value, which is characterized by the nuclear spin relaxation time owing to the interaction with the electron spin system, , as will be discussed below. In these experiments, we have changed the rf amplitude from dBm to dBm. Even very weak, the NMR signal can be recognized at dBm.
We believe the RD-NMR described here is due to the electron and nuclear spin flip-flop effect JiangNMR . For the two dimensional electron system in GaAs, the contact hyperfine interaction with the polarized nuclei acts as an effective magnetic field for the electron spin. The effective electron spin-flip energy is then reduced, as . When the NMR resonance condition is matched, the nuclear spins are depolarized and the electron Zeeman energy increases consequently. Since is dependent on the thermally activated energy gap , , the NMR is manifested by a drop in , as shown by all the NMR lines in Fig. 2b. This allows the nuclear spin polarization to be sensitively detected by a change in the transport coefficient of the electron system .
The above observations reveals the spin excitation in the square structure is of intrinsic interest and is well correlated with the spin excitations of the easy-axis QHPF states. At point C, when the two competing pseudospin (up and down) states acquire the same energy and leads to easy-axis anisotropy, they separate into domains with opposite pseudospin states Hirayama2001 ; Jiang2006 ; MacDonald2000 ; MacDonald2001 . On the other hand, the pseudospin up and down states have opposite spins. As a result, magnetic domains form and the electronic state within each domain is described as an Ising-like QH ferromagnet with either one of two possible spin orientations. As the applied current forces electrons to scatter between adjacent domains with different spin but almost degenerate energy, the nuclei in the neighborhood can become polarized and probed by the RD-NMR measurement. However at other crossing point B and D, the QHPF states are easy-plane, which means that the two degenerate Landau levels are mixing and no spin magnetization formation. Since easy-plane QHPF state can not spontaneously separate into magnetic domains, there is no nuclear polarization and the NMR signals are destroyed.
To support the mechanism of the polarized nuclear spins, current dependence of the NMR signal was studied. In this measurement, the sample resistance was measured with a low ac current of nA, while ramping the dc current in a wide range to bias the sample. The result indicates that the NMR signal is enhanced by a factor of in the low current range from nA up to nA. The data thus consist with the picture of current induced dynamic polarization.
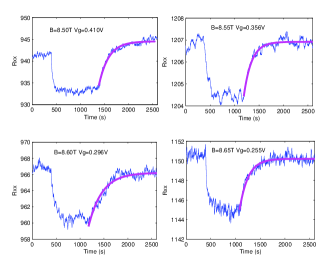

To gain more support of our observation of the nature of the spin in the easy-axis QHPF states, we studied the coupling between the nuclei and the electrons by measuring the nuclear spin relaxation time , at various positions near the crossing point C. First, rf was tuned into resonance, and shows a sharp decrease due to the nuclear depolarization. Then, the frequency was switched back to off resonance. Nuclear spins that have once flopped hardly relax back because of their longer relaxation time , which is on the order of minutes, relative to that of the electrons. Hence, slowly relaxes back to its original value, and can be derived by fitting to the relation . Fig. 3 shows the data around point C to determine .
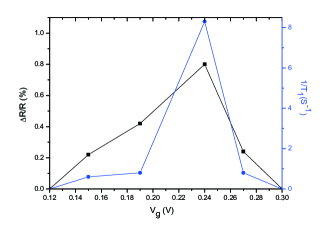
Further insight is gained by investigating the NMR signals along the line L1 (please see Fig. 2a). As depicted in Fig. 4a, our measurement shows a clear peak of NMR ratio at the crossing point C where the easy-axis pseudo-spin ferromagnetic states is well developed. The obtained values of nuclear spin relaxation rate along line L1 are also plotted in Fig. 4a. rapidly increases from nearly zero to (1/s) toward to the crossing point C, as electron becomes the pseudo-spin ferromagnetic states. For comparison, in Fig. 4b we also show the electron activation energy gap along the line L1. The single particle energy difference acts as effective Zeeman energy, and shows a slope of times greater than the single particle Zeeman gap . This unusual behavior is likely to be caused by the easy-axis ferromagnetism Jiang2006 ; Hirayama2001 . These quantities all show an obvious change as approaching to the crossing point and demonstrate that is a sensitive indicator of the pseudo-spin ferromagnetic formation. The similarity between these phenomenon strongly suggest that an intimate link between the spin and pseudo-spin in the easy-axis pseudo-spin ferromagnetic states.
Interestingly, the data shown in Fig. 4b shows that the slop of activation energy gap to single particle Zeeman gap is as large as , which implies many spin flips within the magnetic domain walls and support low energy mode of spin excitations Eisenstein1995 ; MacDonald2001 . As approaching to the crossing point C, there are low energy spin excitations which give new channel to relax the nuclear spin through the electron and nuclear spin flip-flop process. Thus the NMR signal ratio and the nuclear spin relaxation rate enhanced.
Despite the fact that the bulk of the results can be understood within the framework of pseudo-spin quantum Hall ferromagnetism, there is still an apparent puzzle. While we can find very strong NMR signals at the upper arm of the square structure around point C, there is no detectible signal at the lower arm of this square structure around point A. Since the two points have equivalent LLs crossing configurations, one would expect that they are the same easy-axis QHPF states and should produce similar NMR responses. In principle, the NMR signal can be suppressed by spin-orbital coupling HirayamaNMR2 or mobility of domains HirayamaNMR3 . However, in our case, point A and C have identical strength in spin-orbital coupling and disorder. Therefore, the anomalous suppression of NMR signal at point A may suggest that there could be some additional physics which has not yet been recognized in the theory of pseudo-spin quantum Hall ferromagnetism.
In summary, RD-NMR has been measured in a two-subband electron system around the LLs crossing points at total filling factor and where easy-plane or easy-axis QHPF states are well developed. It reveals that the easy-axis quantum Hall pseudospin state of is sensitive to the RD-NMR measurement. As approaching to one LL crossing point at , the RD-NMR signal strength and the nuclear spin relaxation rate enhance quickly which may be due to the low energy spin excitations. At another identical LL crossing point of , the RD-NMR signal is found to be suppressed and remains as a puzzle to be understood. Of course further study is necessary to access the detailed mechanism.
This work at USTC was funded by National Basic Research Programme of China (Grants No. 2006CB921900 and No. 2009CB929600), the Innovation funds from Chinese Academy of Sciences, and National Natural Science Foundation of China (Grants No. 10604052 and No. 10874163 and No.10804104). The work at UCLA was supported by the NSF under Grant No. DMR-0804794.
References
- (1) Chap 2 and 5 in Perspectives on Quantum Hall Effects, S. Das Sarma and A. Pinczuk eds., (Wiley, New York, 1997).
- (2) V. Piazza, V. Pellegrini, F. Beltram, W. Wegscheider, T. Jungwirth, and A. H. MacDonald, Nature 402, 638 (1999).
- (3) E. P. De Portere, E. Tutuc, S. J. Papadakis, M. Shayegan, Science 290, 1546 (2000).
- (4) K. Muraki, T. Saku, and Y. Hirayama, Phys. Rev. Lett. 87, 196801 (2001).
- (5) X. C. Zhang, D. R. Faulhaber and H. W. Jiang, Phys. Rev. Lett. 95, 216801 (2005).
- (6) X. C. Zhang, I. Martin and H. W. Jiang, Phys. Rev. B 74, 073301 (2006).
- (7) K. Lai, W. Pan, D.C. Tsui, S. Lyon, M. Muhlberger and F. Schaffler, Phys. Rev. Lett. 96, 076805 (2006).
- (8) K. Vakili, T. Gokmen, O. Gunawan, Y. P. Shkolnikov, E. P. De Poortere and M. Shayegan, Phys. Rev. Lett. 97. 116803 (2006).
- (9) T. Jungwirth and A. H. MacDonald, Phys. Rev. B 63, 035305 (2000).
- (10) D. W. Wang, E. Demler, and S. Das Sarma, Phys. Rev. B 68, 165303 (2003).
- (11) X. J. Hao et al., arXiv:0807.0297.
- (12) J. H. Smet et al., Nature (London) 415, 281 (2002).
- (13) O. Stern et al., Phys. Rev. B 70, 075318 (2004).
- (14) W. Desrat et al., Phys. Rev. Lett. 88, 256807 (2002).
- (15) G. Gervais et al., Phys. Rev. Lett. 94, 196803 (2005).
- (16) I. B. Spielman et al., Phys. Rev. Lett. 94, 076803 (2005).
- (17) N. Kumada et al., Phys. Rev. Lett. 94, 096802 (2005).
- (18) X. C. Zhang, G. D. Scott and H. W. Jiang, Phys. Rev. Lett. 98, 246802 (2007).
- (19) T. Jungwirth and A. H. MacDonald, Phys. Rev. Lett. 87, 216801 (2001).
- (20) A. Schmeller, J. P. Eisenstein, L. N. Pfeiffer, and K. W. West, Phys. Rev. Lett. 75, 4290 (1995).
- (21) K. Hashimoto et al., Phys. Rev. Lett. 94, 146601 (2005).
- (22) Y. Hirayama et al., Physica E. 20, 133 (2003).