The Chandra Deep Protocluster Survey:
Ly Blobs
are powered by heating, not cooling
Abstract
We present the results of a 400 ks Chandra survey of 29 extended Ly emitting nebulae (Ly Blobs, LABs) in the proto-cluster in the SS A22 field. We detect luminous X-ray counterparts in five LABs, implying a large fraction of active galactic nuclei (AGN) in LABs, % down to erg s-1. All of the AGN appear to be heavily obscured, with spectral indices implying obscuring column densities of cm-2. The AGN fraction should be considered a lower limit, since several more LABs not detected with Chandra show AGN signatures in their mid-infrared emission. We show that the UV luminosities of the AGN are easily capable of powering the extended Ly emission via photo-ionization alone. When combined with the UV flux from a starburst component, and energy deposited by mechanical feedback, we demonstrate that ‘heating’ by a central source, rather than gravitational cooling is the most likely power source of LABs. We argue that all LABs could be powered in this manner, but that the luminous host galaxies are often just below the sensitivity limits of current instrumentation, or are heavily obscured. No individual LABs show evidence for extended X-ray emission, and a stack equivalent to a 9 Ms exposure of an average LAB also yields no statistical detection of a diffuse X-ray component. The resulting diffuse X-ray/Ly luminosity limit implies there is no hot ( K) gas component in these halos, and also rules out inverse Compton scattering of cosmic microwave background photons, or local far-infrared photons, as a viable power source for LABs.
Subject headings:
galaxies: active – galaxies: high-redshift – galaxies: evolution| LAB ID | Offset | Note | |||||||
|---|---|---|---|---|---|---|---|---|---|
| (h m s) | ( ′ ′′) | (10-16 erg s-1 cm-2) | ( erg s-1) | (′′) | |||||
| X-ray detected LABs | |||||||||
| LAB2 | 22 17 39.00 | +00 13 27.5 | 1.45 | 12.400.48 | 9.640.34 | 0.810.03 | 0.42 | 3.460.80 | SMG / 8m detected |
| LAB3 | 22 17 59.10 | +00 15 28.0 | 6.910.11 | 18.000.40 | 25.500.22 | 2.130.02 | 1.28 | 2.590.37 | |
| LAB12 | 22 17 31.90 | +00 16 58.0 | 0.800.11 | 10.300.50 | 10.900.37 | 0.910.03 | 0.17 | 2.860.80 | 24m detected |
| LAB14 | 22 17 35.90 | +00 15 58.0 | 5.070.09 | 16.500.37 | 21.700.21 | 1.820.02 | 1.13 | 1.470.30 | SMG / 24m detected |
| LAB18 | 22 17 28.90 | +00 07 51.0 | 3.28 | 20.800.46 | 19.000.32 | 1.590.03 | 0.63 | 7.021.41 | SMG / 24m detected |
| X-ray non-detected LABs | |||||||||
| LAB1 | 22 17 26.00 | +00 12 36.6 | 2.90 | 1.99 | 5.10 | 0.24 | – | – | SMG / 8m detected |
| LAB4 | 22 17 25.10 | +00 22 10.0 | 6.76 | 3.71 | 10.44 | 0.56 | – | – | |
| LAB5 | 22 17 11.70 | +00 16 43.3 | 5.31 | 2.75 | 8.87 | 0.44 | – | – | SMG / 8m detected |
| LAB7 | 22 17 41.00 | +00 11 26.0 | 2.68 | 1.90 | 4.28 | 0.22 | – | – | |
| LAB8 | 22 17 26.10 | +00 12 53.0 | 2.35 | 1.37 | 4.87 | 0.20 | – | – | |
| LAB9 | 22 17 51.00 | +00 17 26.0 | 4.49 | 2.80 | 7.07 | 0.37 | – | – | |
| LAB11 | 22 17 20.30 | +00 17 32.0 | 3.42 | 1.59 | 6.22 | 0.28 | – | – | |
| LAB13 | 22 18 07.90 | +00 16 46.0 | 18.92 | 10.12 | 31.04 | 1.57 | – | – | |
| LAB15 | 22 18 08.30 | +00 10 21.0 | 10.46 | 4.31 | 16.92 | 0.87 | – | – | |
| LAB16 | 22 17 24.80 | +00 11 16.0 | 4.34 | 2.68 | 6.49 | 0.36 | – | – | 24m / 8m detected |
| LAB19 | 22 17 19.50 | +00 18 46.0 | 4.38 | 1.76 | 8.33 | 0.36 | – | – | |
| LAB20 | 22 17 35.30 | +00 12 48.0 | 2.67 | 1.96 | 4.13 | 0.22 | – | – | |
| LAB21 | 22 18 17.30 | +00 12 08.0 | 34.26 | 18.60 | 54.54 | 2.84 | – | – | |
| LAB22 | 22 17 34.90 | +00 23 35.0 | 6.72 | 3.45 | 10.82 | 0.56 | – | – | |
| LAB24 | 22 18 00.90 | +00 14 40.0 | 4.71 | 2.14 | 8.67 | 0.39 | – | – | |
| LAB25 | 22 17 22.50 | +00 15 50.0 | 2.72 | 2.00 | 4.85 | 0.23 | – | – | |
| LAB26 | 22 17 50.40 | +00 17 33.0 | 2.81 | 1.32 | 5.37 | 0.23 | – | – | |
| LAB27 | 22 17 06.90 | +00 21 30.0 | 11.68 | 6.33 | 17.45 | 0.97 | – | – | |
| LAB28 | 22 17 59.20 | +00 22 53.0 | 11.88 | 5.26 | 18.94 | 0.99 | – | – | |
| LAB30 | 22 17 32.40 | +00 11 33.0 | 3.25 | 2.32 | 5.31 | 0.27 | – | – | |
| LAB31 | 22 17 38.90 | +00 11 01.0 | 2.80 | 1.65 | 5.17 | 0.23 | – | – | |
| LAB32 | 22 17 23.80 | +00 21 55.0 | 5.64 | 3.07 | 9.06 | 0.47 | – | – | |
| LAB33 | 22 18 12.50 | +00 14 32.0 | 25.07 | 11.88 | 42.09 | 2.08 | – | – | |
| LAB35 | 22 17 24.80 | +00 17 17.0 | 3.27 | 1.83 | 5.91 | 0.27 | – | – | |
Notes — Co-ordinates correspond to the centroid of X-ray detection. X-ray fluxes are in the observed frame, but the full band luminosity is quoted in the 2–32 keV rest-frame; X-ray properties are from Lehmer et al. (2009). is the inferred effective photon index. ‘Offset’ refers to the angular separation between X-ray centroid and peak of Ly emission (errors reflects 1 uncertainty in X-ray position).
1. Introduction
It appears that feedback between galaxies and the intergalactic medium (IGM) plays a significant role in the formation and evolution of galaxies (Bower et al. 2006; Croton et al. 2006). Without it, even some of the basic properties of galaxies (such as stellar mass) cannot be re-produced in current models of galaxy formation. Gas cooling within dark matter halos is countered by outflows from starbursts and active galactic nuclei (AGN) and other heating mechanisms. These not only heat, but can also enrich the intergalactic medium (IGM), and truncate star formation within the host galaxies – preventing a glut of galaxies in the local Universe. Placing empirical constraints on these processes, and understanding their detailed physics, is therefore of vital importance.
Recently there has been great interest in the highly extended (30–200 kpc in projected linear extent) Ly line-emitting nebulae ( erg s-1) identified in high-redshift narrowband surveys: ‘Ly Blobs’ (LABs) (Fynbo et al. 1999; Keel et al. 1999; Steidel et al. 2000; Francis et al. 2001; Palunas et al. 2004; Matsuda et al. 2004; Dey et al. 2005; Smith et al. 2008). The most important questions in LAB studies remain unanswered: how are they formed and what maintains their power? One of the main reasons that these objects have aroused curiosity is the possibility that they trace feedback events during the formation of massive galaxies (Chapman et al. 2001; Geach et al. 2005, 2007; Webb et al. 2009), but we still lack a definitive model of LAB formation.
What are the possible formation mechanisms of LABs? At first glance, these objects appear to be good candidates for the Ly ‘fuzz’ predicted to exist around primordial galaxies in simple models of galaxy formation (e.g. Rees & Ostriker 1977; Haiman et al. 2000; Haiman & Rees 2001; Birnboim & Dekel 2003). Cooling of pristine gas within a dark matter halo via Ly emission could, in part, provide the energy required to power a LAB via the release of gravitational potential energy (e.g. Fardal et al. 2001; Nilsson et al. 2006; Smith & Jarvis 2007). However, this has to be reconciled with the fact that many LABs appear to be associated with extremely luminous galaxies (Chapman et al. 2001; Dey et al. 2005; Geach et al. 2005, 2007; Colbert et al. 2006; Beleen et al. 2008; Webb et al. 2009) with bolometric luminosities several orders of magnitude greater than that of the Ly emission. Therefore, some models of LAB formation propose a ‘heating’ scenario, where the energy release associated with intense star formation or AGN within the LABs’ host galaxies powers the extended line emission (e.g. Ohyama et al. 2003). It has also been postulated that inverse Compton scattered cosmic microwave background (CMB) photons could go on to photo-ionize a neutral gas halo (e.g. Fabian et al. 2009). This mechanism is thought to give rise to extended X-ray emission around luminous radio galaxies at (Scharf et al. 2003). Unfortunately the current limits on the soft, diffuse X-ray emission around LABs are poor.
In this paper we concentrate on identifying the power sources of 29 LABs in the SSA 22 proto-cluster (Steidel et al. 2000; Hayashino et al. 2004): a region 6 over-dense compared to the field at , and containing the richest association of LABs known (Matsuda et al. 2004). Our aim is to identify both un-obscured and obscured AGN within LABs, and also search for evidence of extended X-ray emission which could imply inverse Compton scattering, or a hot (few keV) gas component in the extended halos. Understanding the importance of AGN in LABs’ host galaxies is crucial to assess whether the feedback physics associated with black-hole growth is powering the extended Ly emission. To do this we exploit a very deep (400 ks) X-ray exposure: the Chandra Deep Protocluster Survey (Lehmer et al. 2009).
Throughout this work we assume a cosmology where and km s-1 Mpc-1. At this corresponds to a luminosity distance of 26.3 Gpc and scale of 7.6 kpc/′′. Magnitudes are all on the AB scale, and all X-ray fluxes have been corrected for Galactic absorption; the Galactic Hi column density towards SSA 22 is cm-2 (Stark et al. 1992).
2. Observations
A 330 arcmin2 region in the SSA 22 field was observed for 400 ks using the ACIS camera on-board Chandra (P. I.: D. M. Alexander). The observations comprise of four Chandra pointings taken between 2007 October 1 and 2007 December 30 (Obs. I.D.s 8034, 8035, 8036, 9717), centred on the LBG survey region of Steidel et al. (2003), 22 17 36, +00 15 33 (J2000.0). These observations cover 29 of the 35 SSA 22 LABs of Matsuda et al. (2004); only LAB 6, 10, 17, 21, 23, 29 are not covered by the Chandra observations.
Slight differences in roll angle between the four observations results in a total survey area 12% larger than a single ACIS-I field of view (), and the variation in effective exposure time across the map is taken into account in the subsequent source extraction. A full description of data reduction, source detection and catalogue creation can be found in Lehmer et al. (2009). In summary the survey reaches a point-source sensitivity limit of erg s-1 cm-2 and erg s-1 cm-2 in the 0.5–2 keV and 2–8 keV bands respectively. At the redshift of the protocluster, these correspond to luminosities of erg s-1 and erg s-1 at rest-frame energies of 2–8 keV and 8–32 keV respectively.
The SSA 22 region was surveyed by HST Advanced Camera for Surveys (ACS) in a sparse mosaic of 10 pointings during August 2005 (3 orbits per pointing, ks. P. I.: S. C. Chapman, P.I.D. 10405). A single filter, F814W, was used – probing rest-frame 2000Å emission at the redshift of the protocluster. Data was reduced using the standard Space Telescope Science Institute software Multidrizzle. We have also obtained an additional three ACS pointings from the Gemini Deep Deep Survey (GDDS) archive – again this was reduced from the archive ‘flat’ stage using Multidrizzle. Since the HST mosaic is sparse, 14 LABs in the Chandra map do not have ACS coverage, but since this is not a comprehensive morphological study, this does not impact our analysis of the AGN properties of LABs.
The SSA 22 field has been imaged with Spitzer Space Telescope IRAC 3.6, 4.5, 5.8 and 8.0m imaging as part of GO program #64 and GTO program #30328. The data has been described and presented in Webb et al. (2009). In summary, there is uniform coverage of 225 arcmin2 in all four IRAC bands with an integration time of 7.5 ks/pix. Unless otherwise stated, the IRAC photometry presented in this work has been taken from Webb et al. (2009), with fluxes measured in 3.4′′ diameter apertures, corrected to total fluxes. The region covered by IRAC imaging also has MIPS 24m coverage (from the same SST programs), with an integration time of 1.2 ks/pix. The MIPS data is also discussed in Webb et al. (2009). Of all the Chandra covered LABs, only LAB 28 is not covered by the mid-infrared imaging.
In this work we also make use of archival UKIDSS-Deep eXtragalactic Survey (DXS)111http://www.ukidss.org/surveys/surveys.html J/K-band imaging of SSA 22. In addition to the DXS imaging, we have supplemented the near-IR coverage with UKIRT/WFCAM H-band imaging of the Chandra field. This data was obtained in UKIRT/WFCAM service mode (project U/SERV/1759) and reduced using our in-house WFCAM data reduction pipeline (see Geach et al. 2008 for details). The H-band imaging was taken in moderate seeing, 1′′, and reaches a 3 depth of 21.5 mag. For comparison, the equivalent depth of the DXS imaging is 22.0 mag and 21.7 mag in J- and K-bands respectively.
3. Results
3.1. Identifying AGN in LABs
3.1.1 X-ray counterparts
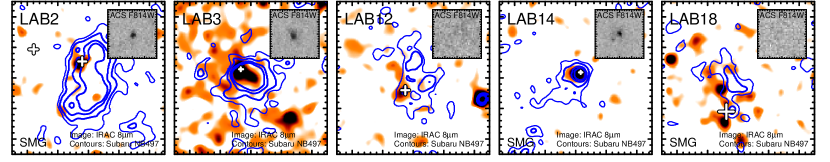
To identify X-ray sources associated with the LABs we first identify all X-ray counterparts within a radius of the peak of the Ly emission. The effective LAB radius is defined by the isophotal area: (we assume the isophotal areas from Matsuda et al. 2004). We find unambiguous X-ray counterparts to five LABs: LAB 2 (previously identified in a 78 ks Chandra exposure by Basu-Zych & Scharf 2004), LAB 3, 12, 14, & 18; see Table 1. In Figure 1 we present thumbnail images of the X-ray detected LABs, indicating the position of the X-ray detection relative to the Ly emission. As can be seen, often the X-ray counterpart is slightly offset from the peak of the Ly emission.
All five of the X-ray detected LABs are covered by the HST/ACS mosaic. LAB 2. LAB 3 and LAB 14 all have compact rest-frame UV morphologies, although LAB 14 has some evidence of a merger/interaction, with two components separated on a scale of 0.5′′. Interestingly, the alignment of these two components is in the same direction as the extended Ly emission. LAB 12 and LAB 18 have no counterpart in the ACS image, and this could reflect more extended, low surface brightness continuum emission in these LABs (c.f. LAB 1, Chapman et al. 2004). We discuss the multi-wavelength properties of the LABs further in §3.2.
In order to estimate the contamination rate from chance alignments of X-ray detections with LABs, we calculate the probability of finding a association by randomly placing an aperture of radius on the X-ray map and counting the number of ‘detections’ within it. We repeat this process 1000 times for each LAB to build-up a statistical representation of the robustness of each detection. The resulting probability of randomly associating an X-ray counterpart with a LAB is 10%, and so we expect 0.5 false matches. This contamination factor is dominated by the three largest LABs in the survey. For example, if one excludes them, this contamination drops by a factor 2. Assuming the X-ray detections pin-point AGN in these five LABs, we measure the luminous AGN fraction in LABs in SSA 22 to be % (Gehrels 1986). This fraction should be considered a lower limit because we have only considered X-ray luminous AGN. In the following section we examine the potential for detecting obscured AGN within the remaining LABs.
3.1.2 Searching for X-ray un-detected AGN in LABs
Enshrouding an AGN with gas and dust could render it un-detectable even in our deep X-ray survey. Nevertheless, we can potentially identify these systems by turning to mid-infrared observations. Dust heated by the AGN gives rise to a steep power-law () continuum in the rest-frame near-infrared, in excess of that expected from a stellar continuum. At the IRAC 8m imaging is probing rest-frame 2m emission beyond the peak of the stellar continuum at 1.6m. It is therefore ideal for identifying AGN (Lacy et al. 2004).
All five X-ray detected AGN are associated with 8m sources (although LAB 3 suffers some confusion from a nearby foreground source). Webb et al. do not associate LAB 12 with an 8m counterpart; however, we find a fairly low significance (5) source coincident with the X-ray point source in LAB 12 (Fig 1). In addition to these unambiguous AGN, Geach et al. (2007) identified LAB 1 with an 8m counterpart, and Webb et al. (2009) detect 8m counterparts in two other LABs: LAB 5 and LAB 16. Although LAB 1, 5 and 16 are not detected at X-ray energies, LAB 1 and LAB 5 are 850m emitters (submillimeter galaxies [SMGs] Chapman et al. 2001; 2004, Geach et al. 2005) and LAB 16 is detected at 24m (Webb et al. 2009). These mid- and far-infrared detections link these LABs to energetic, but dusty, power-sources.
Are these 8m detections likely to be obscured AGN? Webb et al. (2009) show that all of the 8m-detected LABs have rest-frame near-infrared colours consistent with an AGN or ULIRG SED. To examine the possibility that LAB 1, LAB 5 and LAB 16 host heavily obscured AGN (or low-luminosity AGN below the detection limit) we stack the X-ray map at these three positions using the technique outlined in Lehmer et al. (2008). We find a marginally significant (93.6% confidence) excess of 6.6 counts compared to 3.5 expected from the background. This corresponds to an average X-ray luminosity of erg s-1. This is only marginally significant, and the 3 upper limit for this stack is erg s-1. In comparison, the stacked X-ray counts from all remaining 21 LABs covered by the Chandra exposure yields no significant detection, with a 3 upper limit of erg s-1. The stacking position for each of these LABs is taken as the position of the peak Ly. Although Fig. 1 shows that the AGN does not have to be located at the centre of the Ly emission, the influence of this offset is less important for the majority of LABs, which have relatively small spatial extents.
We re-iterate that given the presence of a hidden population of AGN in LABs, the AGN fraction derived in §§3.1.1 should be considered a lower limit. If one includes LAB 1, LAB 5 and LAB 16, the AGN fraction could be as large as %. Such a large AGN fraction hints that there is a strong link between the active host galaxy and the presence of an extended Ly halo. Our results support the findings of Yang et al. (2009), who identify two bright AGN in four of the LABs they detect in the NOAO Deep Wide Field Survey Boötes field. Comparison of AGN fractions between surveys is complicated by the slightly different selection criteria. If we adjust our SSA 22 LAB sample to reflect the Yang et al. (2009) LAB selection criteria, then we find an AGN fraction of 44%, consistent with the 50% fraction in Boötes.
3.2. Properties of the AGN
The properties of the five X-ray counterparts to LABs (and upper limits for the non-detections) are summarized in Table 1. All five LABs have rest-frame 2–32 keV luminosities of erg s-1, and hard effective photon indices (), implying intrinsic column densities of order cm-2 (see Figure 3 of Alexander et al. 2005). The average 3 upper limits for un-detected LABs are erg s-1 cm-2 and erg s-1 cm-2. This corresponds to a luminosity limit of erg s-1. Note that there is slight variation in the limits over the field due to the varying exposure time across the map.
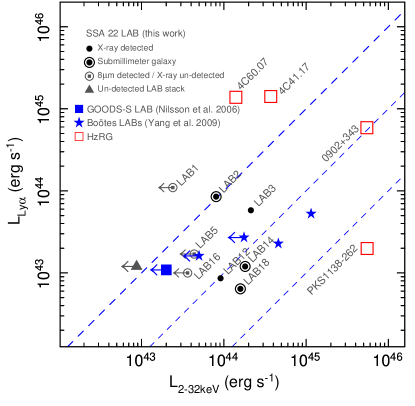
In Figure 2 we compare the X-ray luminosities of the LABs to their Ly luminosities, which show that with a similar range of as high-redshift radio galaxies (HzRGs, Reuland et al. 2003). By comparison, HzRGs are generally 10–100 more luminous in both Ly luminosity and X-ray luminosity, and so it is not clear if LABs are simply ‘scaled down’ versions of the Ly halos around HzRGs, but it is clear that both populations are characterised by bolometrically luminous galaxies. This suggests that the LAB phenomenon could be an important, and perhaps ubiquitous phase in the formation of massive galaxies in general. Note that compared to surveys of radio galaxies, wide-field surveys of LABs (and more importantly, comprehensive multi-wavelength follow-up) have yet to cover significant volumes needed to identify the most extreme examples. Clearly, larger samples of LABs are required to provide a wide dynamic range in properties to properly assess their relation to other high- galaxy populations.
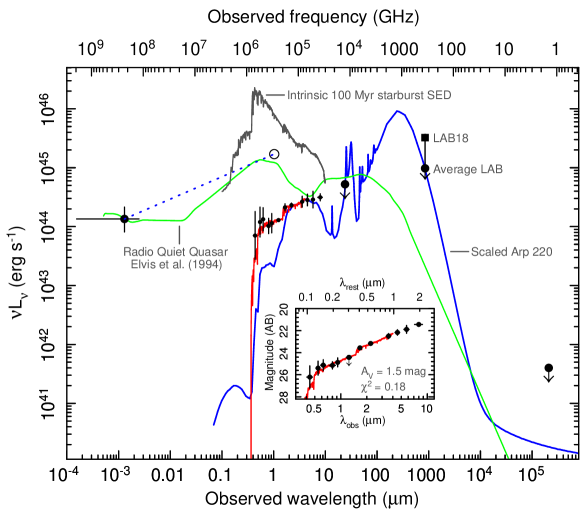
What are the multi-wavelength properties of these AGN LAB hosts? In Figure 3 we present the composite SED of the X-ray detected LABs, covering X-ray to radio wavelengths. As a guide, we compare the observed photometry to two representative SEDs: the archetypal local ULIRG Arp 220 (Silva et al. 1998), and the radio quiet quasar (RQQ) template of Elvis et al. (1994). LAB 2, 14 and 18 contain SMGs (Chapman et al. 2001; Geach et al. 2005), and we indicate their range in luminosity (as well as an upper limit for non-detections) on Figure 3. Note that Geach et al. (2005) showed that LABs not formally detected at 850m have a statistical signature of submillimeter emission at the 3 mJy level. From the sub-mm flux, we can estimate the galaxies’ far-infrared luminosities, . We model the far-infrared emission as a -- modified black-body222Here describes the power-law Wien tail in the mid-infrared, describes the emissivity in the Rayleigh-Jeans regime and the temperature controls the frequency of the peak of the spectrum. If and are fixed, then at the sub-mm to far-infrared conversion varies like: over the range K. Parameterising in this way allows the reader to re-scale our luminosity estimates for alternative temperatures. (Blain et al. 2003). Assuming , the far-infrared luminosities of the LABs are in the ultraluminous regime, with (slightly more conservative than presented in Geach et al. [2005]).
The LABs containing formally detected SMGs have implied –, similar to those of composite AGN/starbursts in ULIRGs/SMGs at comparable redshifts (Alexander et al. 2005). It therefore appears likely that these galaxies also contain a dust-enshrouded starburst component, powering at least 80% of the far-infrared emission. Correcting for 20% AGN contribution, we estimate that the host galaxies have SFRs 500 yr-1 (assuming the far-infrared/SFR conversion of Kennicutt 1998). The host galaxies embedded within these LABs are probably undergoing an episode of co-eval black-hole growth and star-formation. Both these processes deposit energy into the IGM, and for the remainder of this article, we discuss the role of this heating in powering the extended Ly emission, and rule out some other power sources (inverse Compton scattering, cooling) that have been proposed for LAB formation.
4. Discussion: what powers LABs?
Clearly the host galaxies embedded within LABs are extremely energetic, but can this energy be harnessed to give rise to the extended Ly emission? There are only two basic mechanisms that transfer the output from the host galaxy into an extended halo: photo-ionization from UV photons and mechanical feedback. We assess the viability of each of these power sources in the following discussion, and conclude with a discussion comparing the physical viability of cooling versus heating models of LAB formation.
4.1. Photo-ionization
When considering photo-ionization, we are only concerned with photons with eV, and so our constraints on the UV/optical portion of the SED are important here. The optical/near-infrared photometry are interpolated using the spectral fitting code hyperz (Bolzonella, Miralles & Pelló 2000). Since the IRAC bands are thought to be contaminated by a hot dust component, we restrict this fit to m. Figure 3 shows the best fitting SED, which assumed a continuous star formation history of duration 100 Myr (although it is not clear how to interpret this ‘age’ here; the fit is more useful as an interpolation of the observed photometry). The UV/optical continuum is the combination of intrinsic emission from stars and the AGN, attenuated by internal extinction and (at shorter wavelengths) by foreground Ly Forest absorption. However, since some of the self-absorbed radiation has been re-distributed to other parts of the SED, we can attempt to reconstruct the intrinsic UV luminosity from massive stars and the AGN component and assess whether these are sufficient to photo-ionize the halo.
1) AGN contribution— To estimate the intrinsic rest-frame UV luminosity of the AGN, we apply the simple power-law extrapolation of Steffen et al. (2006): . For our typical AGN, extrapolating from the measured X-ray luminosities, we find . We indicate the predicted UV luminosity in Fig. 3. Note that both this power-law extrapolation and normalized RQQ template of Elvis et al. (1994), gives erg s-1. This is an order of magnitude larger than the observed 2500Å luminosity for the galaxy, implying strong extinction consistent with the flat X-ray spectral slopes of the LABs. We assess the role of this obscuration on the escape of photo-ionizing radiation below.
2) Massive stars— The bolometric luminosities of LABs are dominated by far-infrared emission, and the crude limits on the LABs’ suggest that 20% of this is likely to be provided by the AGN (Alexander et al. 2005). The remaining power is predicted to come from dust heated in the UV radiation field of massive stars, and so to estimate the un-obscured SFR, we convert from the corrected (Kennicutt 1998). To estimate the intrinsic UV/optical emission from this starburst component, we scale the Starburst99 models of Leitherer et al. (1999). The resulting intrinsic UV–optical SED for a starburst representative of our composite X-ray detected LAB is shown in Fig. 3 (we assume a Solar metallicity, Salpeter IMF with upper stellar mass cut-off of 100 ). In the absence of obscuration, the intrinsic UV luminosities are 2 orders of magnitude larger than the observed Ly luminosities, and thus provide an adequate supply of ionizing photons.
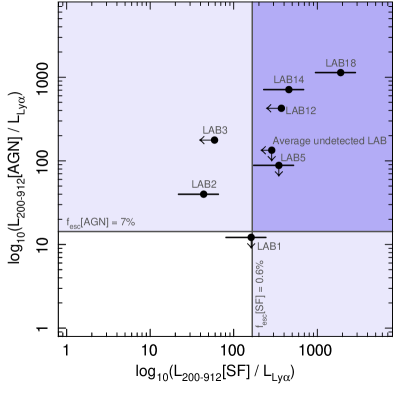
In Figure 4 we compare the integrated 200–912Å luminosity of the host galaxies (split into a AGN and starburst component) to the Ly luminosity of the LAB. We show that even with small escape fractions, the luminosity of the AGN/starburst is easily sufficient to power the LABs’ Ly luminosities via photo-ionization. As Fig 1 shows, there could be quite large variation in the UV escape fraction from source to source (partly, this could be due to geometric effects). We attempt to estimate a representative escape fraction () of UV photons from the AGN and starburst components by comparing the intrinsic UV luminosity for each component to the observed continuum luminosity at 1500Å (Fig. 3). We make the assumption that this extinction can also be applied at 912Å, and this implies and . On Figure 4 we illustrate the region where photo-ionization can fully power a LAB taking into account each – the reader can scale these lines to test the effect of various levels of obscuration. All LABs with detected AGN fall in the region where an AGN, starburst or combination of both can fully photo-ionize the halo. Similarly, LABs with submm detections (including the average stacked flux) but no formal X-ray counterpart are also consistent with an ionizing power source of either starburst or AGN (Fig 4).
What of the role of extinction on the extended Ly emission itself? Ly is a resonantly scattered emission line, and so it is easy to destroy the line in the presence of dust. This is not likely to be an issue in the LAB halos, since the Ly photons are generated in the extended gaseous nebula, well away from the obscuring material in the host galaxy, although the dust could be potentially extended on small scales (e.g. Matsuda et al. 2007). Furthermore, radiative transfer could serve to extend the Ly emission over larger scales; in fact, in some models where cooling is invoked to explain the Ly emission, this is essential to reproduce LABs on scales of LAB 1 or LAB 2 (Fardal et al. 2001).
In addition to direct photo-ionization, the galaxy can inject kinetic energy in the IGM via outflows. Energy deposited in this way could also power Ly emission by promoting collisional excitation/ionization, or if it is capable of generating a shock, by photo-ionization.
4.2. Mechanical energy
As in the photo-ionization models, the total mechanical energy available to the Ly halo is derived from both the massive stars (the detonation of supernovae, and to a lesser extent, stellar winds) and the AGN (accretion-related outflows). To evaluate the energy deposited in the IGM by supernovae (stellar winds are not likely to provide significant feedback, except in very young starbursts), we again apply the Starburst99 model, but this time consider mechanical luminosity, rather than UV luminosity. Each supernova can release 1051 erg, but only 10% of this is believed to pressurize the ISM (Thornton et al. 1998) – the remainder of the energy is lost to alternative radiative processes. Assuming the same Salpeter IMF as used in the photo-ionization calculation, the total mechanical energy from SNe can be expressed . This simple scaling assumes that the far-infrared emission is dominated by star-formation, and that the burst is 108 years old. Note that in our case, we have made a conservative correction for a 20% contribution to from the AGN. We find a large range of for the X-ray detected LABs, with for LAB 2, and for LAB 18. This simply reflects the fact that smaller, lower luminosity LABs are ‘easier’ to power.
In addition to the output from supernovae, we also have the energy deposited by outflows from the AGN. A radiation-pressure driven bi-polar outflow could arise if UV photons deposit momentum in a covering shell of dust which is then driven out of the galaxy. Unfortunately, confirming outflows in LABs is extremely challenging, not only in terms of observational overhead but also because of the somewhat ambiguous observational signatures of inflow/outflow (e.g. Dijkstra, Haiman & Spaans 2006). Nevertheless, the best observational evidence that LABs are experiencing some form of mechanical feedback is provided by integral field (IFU) observations of LAB 1 (Bower et al. 2004) and LAB 2 (Wilman et al. 2005). LAB 1 exhibits a chaotic velocity structure and a Ly ‘cavity’ in the vicinity of the host identified by Geach et al. (2007), and LAB 2 shows evidence of a large scale (100 kpc) galaxy-wide outflow traced by a Ly absorption feature with remarkable velocity coherence. Both of these observations support a model where mechanical energy is being deposited into the IGM, and therefore capable of providing power for the extended Ly emission.
If one takes both the energy available from photo-ionization and mechanical deposition (heating), it is clear that the energy supplied by the LAB host galaxies can be orders of magnitude larger than the energy released in the Ly emission. We take this as compelling evidence that heating must be crucial in powering LABs. In the remainder of the discussion we examine two other proposed LAB formation mechanisms: inverse Compton scattering and cooling. We assess whether these other physical processes are likely to operate in LABs, compared to the feasibility of the heating model described above.
4.3. Extended X-ray emission
4.3.1 Inverse Compton scattering
The IC mechanism – up-scattering of photons by a population of relativistic electrons – becomes more viable as a potential power source for extended Ly emission at high redshifts due to the evolution in the CMB energy density (e.g. Scharf et al. 2003; Fabian et al. 2009). CMB photons (or far-infrared photons from the galaxy itself) could be up-scattered to X-ray energies, and then go on to photo-ionize a halo of neutral hydrogen. Although the LABs show no current radio activity, this does not rule out a previous radio-loud mode that could have provided a scattering population of electrons distributed to several tens of kiloparsec from the source. Therefore, one way of detecting the IC mechanism at work is to search for extended X-ray emission.
No individual LABs show evidence for extended X-ray emission333In a previous, shallow (78 ks) Chandra observation of SS A22, Basu-Zych & Scharf (2004) claimed that LAB 2 has some evidence of extended X-ray emission, but we do not confirm that result here.; however, using a summation technique incorporating the Chandra data from all 29 LABs, we can search for an average signal from the extended LAB regions that falls below the detection threshold of an individual source. Using the 0.5–2 keV image from Lehmer et al. (2009), we summed the source-plus-background counts for pixels within the LAB isophotal regions as defined by Matsuda et al. (2004). This stacking technique provides us with an effective exposure time of 9.3 Ms. In these summations, we excluded circular regions of radius the 90% encircled energy fraction radius for individually detected point sources. We then extracted and summed background counts from pixels within the same set of isophotal regions after shifting them by 70′′. In total, we extracted 84 source-plus-background counts over 3658 on-source pixels and 83 counts over 4239 off-source pixels. This gives an on-source fluctuation of 1.6 above the background.
To calculate the X-ray luminosity limit for IC emission, we first estimated the 3 upper limit on the extracted source-plus-background counts rescaled to the total LAB isophotal area (i.e., the ratio of the total LAB isophotal area and the area used to extract counts). Using the vignetting-corrected 0.5–2 keV exposure map from Lehmer et al. (2009), we then computed the total effective exposure for the 29 sources to be 9.3 Ms. This implies a 3 upper limit on the 0.5–2 keV count-rate to be counts s-1. Assuming a power-law spectrum (appropriate for X-ray emission from IC scattering; , see Scharf et al. 2003), we find a 2–8 keV luminosity limit of erg s-1 (3). We conclude that the lack of extended X-ray emission around the LABs rules out the IC mechanism as a viable power source.
4.3.2 Hot gas component
In the classic picture of galaxy formation, gas entering dark matter halos can be shock heated to the virial temperature of the halo (White & Frenk 1991). Our non-detection of extended X-ray emission around LABs provides a useful limit on the thermal properties of the gas halo, and therefore we are able to speculate about the properties of the dark matter halos that LABs inhabit.
For example, the virial temperature of a halo of mass is K. Using the upper limit on the X-ray count-rate described above and assuming a Raymond-Smith plasma SED with implies a rest-frame 0.5–2 keV luminosity limit of erg s-1. If gas was cooling from the virial temperature, then we would expect (Cowie, Fabian & Nulsen [1980]; Bower et al. [2004]). We find , and so our observations imply there is no hot ( K) gas component in these halos.
This measurement does not rule out a ‘cold’ cooling mode in the galaxy halo (see Fardal et al. 2001). Can such cooling radiation be a viable power source for the LABs? In the final discussion we investigate the likelihood for this scenario, compared to the picture where LABs are powered by heating by the embedded host galaxy.
4.4. Cooling versus heating: which wins?
The simple cooling of gas within dark matter halos has been used to explain the existence of LABs not containing obvious ‘active’ galaxies such as those presented here (e.g. Smith & Jarvis 2007). The best candidate for a LAB powered by cooling was identified by Nilsson et al. (2006), in the GOODS-South field. While Nilsson et al. do not associate the GOODS-S LAB () with a companion continuum source, we note there is an IRAC 8m, and MIPS 24m-detected source just 3′′ (20 kpc) away from the GOODS-S LAB, with a photometric redshift consistent with the LAB itself. As with some of the LAB counterparts in this work, this could be a starburst galaxy offset from the peak of the Ly emission. Nevertheless, Nilsson et al. argue that this object is not associated with the LAB, and in the absence of a detectable ionizing source within the halo they conclude that cold accretion is the most plausible power source. What are the physical consequences that must be considered if cooling flows power LABs? The major hurdle that cooling models must overcome is the fact that the expected cooling times of these halos is very short, and this has some profound physical implications regarding the evolution of the host galaxy. We will illustrate this using a simple model.
Consider a LAB modelled as an isothermal sphere of gas. The cooling timescale of this gas halo is simply the ratio of the thermal energy to the cooling rate, : . Let us model a primordial gas mixture in collisional equilibrium as a conservative case (we ignore all other sources of photo-ionization and cooling via metal lines). If we assume that all of the cooling is emerging in the Ly line at the peak of the cooling function (i.e. K; Katz, Weinberg & Hernquist 1996), then we can estimate the total thermal energy and therefore cooling timescale of the LAB. This is probably a reasonable assumption, because as we have seen, there is observational evidence that suggests gas in the IGM is not in a hot mode (§4.3.2). This is also in agreement with theoretical models which suggest that gas falling into dark matter halos never reaches the virial temperature, and instead is dominated by a cold mode of accretion, with gas at K (Fardal et al. 2001; Haiman & Rees 2001; Kay et al. 2000; Birnboim & Dekel 2003). Taking LAB 2 as a representative example, the gas halo will lose all of its thermal energy (and therefore vanish) within 1.5 Myr. In order to sustain the LAB in this cooling model, it follows that one must replenish the warm gas in the halo as it is being cooled onto the host galaxy. Is this realistic?
The total mass of material required to pass through this cooling phase can be estimated by comparing the cooling rate with the likely lifetimes of LABs. Unfortunately we have no constraints on LABs’ lifetimes, so we make some estimates based on a simple evolutionary and duty-cycle argument. We know that LABs are commonly associated with LBGs, and it is not an unreasonable assumption that all LBGs go through a LAB phase. In SSA 22a (the LBG survey region of Steidel et al. 2003), % of LBGs are associated with LABs. LABs have been detected over , a span of 2 Gyr in cosmic time (e.g. Smith & Jarvis 2007, Ouchi et al. 2008; Yang et al. 2008), a simple duty cycle argument then implies that the LAB lifetime is 50–100 Myr. Hence if LAB 2 was to be completely powered by cooling, then over this duration the central galaxy would have to accrete of molecular gas.
Bearing in mind that the stellar masses of the LAB hosts are already (Geach et al. 2007; Smith et al. 2008; Uchimoto et al. 2008), it seems unlikely that they would increase their stellar mass by a factor 10 in such a short period of time without triggering starburst or AGN activity that would potentially heat their halos. Nevertheless, some current LAB formation models propose that the host can be ineffective at influencing the cold flow in any way. For example, recent high-resolution hydrodynamic simulations of cold mode cooling in halos suggest that cold ( K) gas enters the galaxy in thin filaments (Dijkstra & Loeb 2009). The key difference between filamentary cold flows and the simple isotropic cooling we discussed above is that the gas enters the galaxy in dense (1–100 cm-3) streams with a small volume filling factor. The high Hi densities will shield the majority of the gas from external ionizing radiation (i.e. the AGN/starburst), and the small angular covering factor means that terminating the flow via feedback is ineffective, since outflows emerge from the galaxy through low density patches between the streams. However, it should be noted that the physical interaction between AGN/starburst feedback and filamentary cold flows is still unclear.
As in our simple case, the main problem that this refined cooling model faces is the requirement that a large mass of gas must be accreted onto a galaxy (the filamentary cooling mode has a duty cycle of unity, Dijkstra & Loeb 2009). Cessation of the cold flow occurs when the halo reaches a critical mass, which is a function of redshift such that cold flows terminate by (Dekel et al. 2009). Still, at , this ‘over cooling’ is exactly the scenario that modern models of galaxy formation attempt to prevent – run-away star formation resulting in too many very massive galaxies. Without introducing feedback that can terminate cooling, models severely over-predict the number of massive galaxies at (Bower et al. 2006).
5. Summary & Final Remarks
In this deep Chandra survey of 29 LABs in the SSA 22 protocluster at , we have unambiguously identified 5 moderately luminous ( erg s-1) AGN embedded within LABs. The high AGN fraction, % hints that an active host galaxy is important for LAB formation, and our analysis concentrates on how the energetics of the host galaxies could relate to the extended Ly emission. Our main results and conclusions are:
1) All five AGN have hard spectral indices, implying intrinsic obscuring column densities of 1023 cm-3. and all of the X-ray detected LABs have 8m counterparts, implying rest-frame near-infrared colours consistent with a power-law continuum associated with warm dust emission (Webb et al. 2008). These X-ray un-detected LABs also have AGN-like near-infrared colours hinting that they also contain buried AGN (Geach et al. 2007; Webb et al. 2009). Our derived AGN fraction should be considered a lower limit, and could be as high as 30% (or greater) if the AGN are heavily obscured, or there are a larger population of lower-luminosity AGN.
2) The intrinsic UV luminosity of the host galaxies (arising from massive stars and the AGN) is easily sufficient to power the LABs via photo-ionization, even with large dust covering fractions. When one includes energy deposited by mechanical feedback it is clear that the host galaxies can provide all the energy required to explain the extended Ly luminosity of LABs.
3) We find no evidence of extended X-ray emission around the LABs, ruling out inverse Compton scattering as an important power source for LABs. Our derived limit on the diffuse X-ray component compared to extended Ly luminosity, , also implies that there is little or no shock-heated gas at temperatures of 107 K in the LABs. This crude temperature limit hints that LABs probably occupy dark matter halos of mass .
Our results strongly support the heating model of LABs, where the active host is powering the extended Ly emission, rather than the so-called ‘cold accretion’ models of LAB formation. The exact evolutionary history of LABs remains unclear; however LABs’ association with luminous host galaxies is a compelling hint that they are linked to feedback events at the sites of formation of massive galaxies and AGN. Admittedly not all LABs show unambiguous signs of intense starburst or AGN activity, but we feel that this should not be taken as evidence that cold accretion is at play: the potentially luminous embedded sources are likely to be heavily obscured (Geach et al. 2007; Webb et al. 2009), or fall just below the sensitivity of current instrumentation (Geach et al. 2005). Although cooling must occur at some point in LABs’ history, any vestigial cooling must now be overwhelmed by feedback from the galaxy itself.
In summary, there is little compelling observational evidence supporting the cooling model. We have shown that in order to power a LAB by cold accretion over a reasonable time-scale, then the final mass of the galaxy becomes unreasonably large. This is exactly the problem that contemporary models of galaxy formation have to overcome: cooling must be swiftly curbed to prevent a ‘run-away’ star formation episode resulting in too many massive () galaxies by (Bower et al. 2006). It is possible that LABs could be the epitome of this physical model of galaxy evolution.
Acknowledgements
We thank the referee for helpful comments, and we appreciate useful discussions with Mark Dijkstra, Chris Done, Caryl Gronwall, Cedric Lacey and Tom Theuns. J.E.G. is funded by the U.K. Science and Technology Facilities Council (S.T.F.C.). D.M.A. acknowledges the Royal Society and the Leverhulme Trust for financial support. B.D.L. is supported by a S.T.F.C. post-doctoral fellowship. I.S. acknowledges support from the Royal Society and S.T.F.C. Additional support for this work was provided by NASA through Chandra Award Number SAO G07-8138C (S.C.C., C.A.S., M.V.) issued by the Chandra X-ray Observatory Center, which is operated by the Smithsonian Astrophysical Observatory under a NASA contract.
References
- (1) Alexander, D. M., et al., 2005, ApJ, 632, 736
- (2) Basu-Zych, A. and Scharf, C, 2004, ApJ, 615, L85
- (3) Blain, A. W., Barnard, V. E., Chapman, S. C., 2003, MNRAS, 338, 733
- bolzonella (00) Bolzonella, M, Miralles, J.-M., Pelló, R., 2000, A&A, 363, 476
- Bower et al. (2004) Bower, R. G., Morris, S. L., Bacon, R., Wilman, R. J., Sullivan, M., Chapman, S., Davies, R. L., de Zeeuw, P. T., Emsellem, E. 2004, MNRAS, 351, 63
- (6) Bower, R. G., Benson, A. J., Malbon, R., Helly, J. C., Frenk, C. S., Baugh, C. M., Cole, S., Lacey, C. G., 2006, MNRAS, 370, 645
- (7) Birnboim, Y., & Dekel, A., 2003, MNRAS, 345, 349
- Chapman et al. (2001) Chapman, S. C., Lewis, G. F., Scott, D., Richards, E., Borys, C., Steidel, C. C., Adelberger, K. L., Shapley, A. E. 2001, ApJ, 548, L17
- chapman (04) Chapman, S. C., et al., 2004, ApJ, 606, 85
- (10) Colbert, J. W., et al., 2006, ApJ, 637, L89
- (11) Cowie, L. L., Fabian, A. C., Nulsen, P. E. J., 1980, MNRAS, 191, 399
- (12) Croton, D. J., Springel, V., White, S. D. M., De Lucia, G., Frenk, C. S., Gao, L., Jenkins, A., Kauffmann, G., Navarro, J. F., Yoshida, N., 2006, MNRAS, 365, 11
- (13) Dekel, A., et al. 2009, Nature, 457, 451
- Dey et al. (2005) Dey, A., Bian, C., Soifer, B. T., Brand, K., Brown, M. J. I., Chaffee, F. H., LeFloc’h, E., Hill, G., Houck, J. R., Jannuzi, B. T., Rieke, M., Weedman, D., Brodwin, M., Eisenhardt, P. 2005, ApJ, 629, 654
- (15) Dijkstra, M., Haiman, Z., Spaans, M., 2006, ApJ, 649, 14
- (16) Dijkstra, M., Lidz, A., Wyithe, J. S. B., 2007, MNRAS, 377, 1175
- (17) Dijkstra, M., Loeb, A., 2009, astro-ph/0902.2999
- (18) Elvis, M., Wilkes, B. J., McDowell, J. C., Green, R. F., Bechtold, J., Willner, S. P., Oey, M. S., Polomski, E., Cutri, Roc, 1994, ApJS, 95, 1
- (19) Fabian, A. C., Chapman, S., Casey, C. M., Bauer, F., Blundell, K. M., 2009, astro-ph/0902.3117
- Fardal et al. (2001) Fardal, M. A., Katz, N., Gardner, J. P., Hernquist, L., Weinberg, D. H., Davé, R. 2001, ApJ, 562, 605
- francis (01) Francis, P. J., et al., 2001, ApJ, 554, 1001
- (22) Fynbo, J., U., Moller, P., Warren, S. J., 1999, MNRAS, 305, 849
- geach (05) Geach, J. E., et al., 2005, MNRAS, 363, 1398
- geach (07) Geach, J. E., Smail, I., Chapman, S. C., Alexander, D. M., Blain, A. W., Stott, J. P., Ivison, R. J, 2007, ApJ, 655, L9
- (25) Gehrels, N., 1986, ApJ, 303, 336
- (26) Haiman, Z., Spaans, M., Quataert, E., 2000, ApJ, 537, L5
- (27) Haiman, Z., Rees, M. J., 2001, ApJ, 556, 87
- Hayashino et al. (2004) Hayashino, T., Matsuda, Y., Tamura, H., Yamauchi, R., Yamada, T., Ajiki, M., Fujita, S. S., Murayama, T., Nagao, T., Ohta, K., Okamura, S., Ouchi, M., Shimasaku, K., Shioya, Y., Taniguchi, Y. 2004, AJ, 128, 2073
- (29) Katz, N., Weinberg, D. H., Hernquist, L., 1996, ApJS, 105, 19
- (30) Kay, Scott T., Pearce, F. R., Jenkins, A., Frenk, C. S., White, S. D. M., Thomas, P. A., Couchman, H. M. P., 2000, MNRAS, 316, 374
- Keel, Cohen, Windhorst, Waddington (1999) Keel, W. C., Cohen, S. H., Windhorst, R. A., Waddington, I., 1999, AJ, 118,2547
- Kennicutt (1998) Kennicutt, R. C. 1998, ARA&A, 36, 189
- lacy (04) Lacy, M., et al., 2004, ApJS, 154, 166
- (34) Lehmer, B. D., et al., 2008, ApJ, 681, 1163
- (35) Lehmer, B. D., Alexander, D. M., Geach, J. E., Smail, Ian, Basu-Zych, A., Bauer, F. E., Chapman, S. C., Matsuda, Y., Scharf, C. A., Volonteri, M., Yamada, T., 2009, ApJ, 691, 687
- (36) Leitherer, C., Schaerer, D., Goldader, J. D., Delgado, R. M. G., Robert, C., Kune, D. F., de Mello, D. F., Devost, D., Heckman, T. M. 1999, ApJS, 123, 3
- Ohyama et al. (2003) Ohyama, Y., Taniguchi, Y., Kawabata, K. S., Shioya, Y., Murayama, T., Nagao, T., Takata, T., Iye, M., Yoshida, M. 2003, ApJ, 591, L9
- (38) Ouchi, M., et al., 2008, arXiv0807.4174
- (39) Nilsson, K. K., Fynbo, J. P. U., Moller, P., Sommer-Larsen, J., Ledoux, C., 2006, A&A, 452, L23
- palunas (04) Palunas, P., et al., 2004, ApJ, 602, 545
- (41) Prescott, M. K. M., Kashikawa, N., Dey, A., Matsuda, Y., 2008, ApJ, 678, L77
- matsuda (04) Matsuda, Y., et al., 2004, ApJ, 128, 569
- (43) Rees, M. J., & Ostriker, J. P., 1977, MNRAS, 179, 541
- reuland (03) Reuland, M., et al., 2003, ApJ, 592, 755
- (45) Saito, T., et al., 2006, ApJ, 648, 54
- scharf (04) Scharf, C. A., et al., 2004, ApJ, 596, 105
- silva (98) Silva, L., Granato, G. L., Bressan, A., Danese, L., 1998, ApJ, 509, 103
- (48) Smith, D. J. B., Jarvis, M. J., Lacy, M., Martínez-Sansigre, A., 2008, MNRAS, 389, 799
- (49) Smith, D. J. B., Jarvis, M. J., 2007, MNRAS, 378, 49
- (50) Stark, A. A., Gammie, C. F., Wilson, R. W., Bally, J., Linke, R. A., Heiles, C., Hurwitz, M., 1992, ApJS, 79, 77
- (51) Steffen, A. T., Strateva, I., Brandt, W. N., Alexander, D. M., Koekemoer, A. M., Lehmer, B. D., Schneider, D. P., Vignali, C., 2006, AJ, 131, 282
- steidel (00) Steidel, C., et al., 2000, ApJ, 532, 170
- (53) Steidel, C. C., Adelberger, K. L., Shapley, A. E., Pettini, M., Dickinson, M., Giavalisco, M., 2003, 592, 728
- taniguchiandshioya (00) Taniguchi, T. and Shioya, Y., 2000, ApJ, 532, L13
- (55) Thornton, K., Gaudlitz, M., Janka, H.-Th., Steinmetz, M., 1998, ApJ, 500, 95
- (56) Uchimoto, Y. K., et al. 2008, PASJ, 60, 683
- (57) Webb, T. M. A., Yamada, T., Huang, J. -S., Ashby, M. L. N, Matsuda, Y., Egami, E., Gonzalez, M., Hayashino, T., 2009, ApJ, 692, 1561
- (58) White, S. D. M., Frenk, C. S., 1991, ApJ, 379, 52
- wilman (05) Wilman, R. J., et al., 2005, Nature, 436, 227
- (60) Yang, Y. Zabludoff, A., Tremonti, C., Eisenstein, D., Dav , R., 2009, ApJ, 693, 1579
- (61) Yun, M. S., et al., 2008, MNRAS, 389, 333