Detection of a Companion Lens Galaxy using the Mid-infrared Flux Ratios of the Gravitationally Lensed Quasar H1413+117
Abstract
We present the first resolved mid-IR (11m) observations of the four-image quasar lens H1413+117 using the Michelle camera on Gemini North. All previous observations (optical, near-IR, and radio) of this lens show a “flux anomaly,” where the image flux ratios cannot be explained by a simple, central lens galaxy. We attempt to reproduce the mid-IR flux ratios, which are insensitive to extinction and microlensing, by modeling the main lens as a singular isothermal ellipsoid. This model fails to reproduce the flux ratios. However, we can explain the flux ratios simply by adding to the model a nearby galaxy detected in the H-band by HST/NICMOS-NIC2. This perturbing galaxy lies from the main lens and it has a critical radius of which is similar to that of the main lens, as expected from their similar H-band fluxes. More remarkably, this galaxy is not required to obtain a good fit to the system astrometry, so this represents the first clear detection of an object through its effect on the image fluxes of a gravitational lens. This is a parallel to the detections of visible satellites from astrometric anomalies, and provides a proof of the concept of searching for substructure in galaxies using anomalous flux ratios.
1 Introduction
Ever since cosmological simulations of cold dark matter (CDM) indicated there should be many more satellite galaxies around the Milky Way than detected, it has been an important goal to try to detect these “missing satellites” (Klypin et al., 1999; Moore et al., 1999). In the case of the Milky Way, the Sloan Digital Sky Survey has steadily found additional, faint satellites, but with nowhere near the expected abundances of subhaloes (e.g. Willman et al., 2005; Belokurov et al., 2007). The simplest solution in the context of CDM models is to suppress star formation in low-mass satellites, probably through heating and baryonic mass loss as the universe re-ionizes to leave a population of dark satellites (e.g. Klypin et al., 1999; Bullock et al., 2000). Locally there is some hope of finding these dark satellites through gamma rays emitted by dark matter annihilation, but the likelihood of detection depends heavily on the CDM properties (e.g. Strigari et al., 2008).
Currently the only other technique able to search for dark substructures is gravitational lensing, where satellites affect both the image positions and fluxes. In some lenses (e.g. MG0414+0534, Ros et al. 2000; MG2016+112, Kochanek 2006; More et al. 2009; HE0435–1223, Kochanek et al. 2006) satellite galaxies of the primary lens can be detected through their effects on image positions. But, as Mao & Schneider (1998) and Metcalf & Zhao (2002) emphasized, image fluxes are sensitive to perturbations from very low-mass satellites, and we observe many lenses with “flux ratio anomalies” where the relative image brightnesses cannot be explained by simple, central lens galaxies (see Evans & Witt, 2003; Kochanek & Dalal, 2004; Congdon & Keeton, 2005; Yoo et al., 2006a, b). Image fluxes can be altered by two physical effects: granularity in the gravitational field created by stars (“microlensing,” see Wambsganss, 2006) or satellites (“millilensing”), and propagation effects in the ISM of the lens galaxy (scattering/extinction). At radio frequencies, where absorption is negligible and the sources are too large to be significantly affected by microlensing, a simple explanation for the anomalous flux ratios in four-image radio lenses is perturbations due to the expected CDM substructure. Nothing has altered this basic conclusion (see, e.g. Dalal & Kochanek 2002; Metcalf & Zhao 2002; Koopmans et al. 2003; Evans & Witt 2003; Congdon & Keeton 2005; Yoo et al. 2006a; Dobler & Keeton 2006), although there is debate about whether some of the perturbers may be along the line of sight (Chen et al., 2003; Wambsganss et al., 2005; Metcalf, 2005) and about the fraction of substructures that survive at the typical impact parameter of lensed images (Zentner et al., 2005; Madau et al., 2008; Xu et al., 2009). To date, however, no visible satellite or companion galaxy has been convincingly detected using flux ratios rather than astrometry; therefore, we lack a “proof of principle” demonstration of the flux ratio approach.
The need to fully disentangle the physical effects is illustrated by the fact that one optical anomaly included by Dalal & Kochanek (2002), that of PG1115+080, was shown by the mid-IR observations of Chiba et al. (2005) to be due to microlensing rather than substructure. Like radio emission, the mid-infrared is also insensitive to extinction and microlensing, so it is an ideal bandpass in which to search for substructure in the lens. Quasar spectra rise longward of 1m in due to a dust “torus” surrounding the AGN (Antonucci, 1993), and the mid-IR emission of the torus is too large (0.1 mas) to be affected by stellar microlensing. In addition, the mid-IR source should have a variability time scale long compared to the lens time delays, leading to little variability in the mid-IR flux ratios (e.g. Poindexter et al., 2007).
In this paper we discuss the lens system H1413+117 (Magain et al., 1988), for which we have obtained mid-IR (11m) data with the Michelle camera (Roche, 2004) on Gemini North. H1413+117 is a four-image quasar lens with a quasar redshift . The lens galaxy is faint and difficult to detect against the glare from the bright quasar. There are position estimates from Kneib et al. (1998b) and Chantry & Magain (2007) based on the same HST/NICMOS-NIC2 H-band image, but no lens redshift. There are many published models of H1413+117 (Kayser et al. 1990; Yun et al. 1997; Kneib et al. 1998a; Chae & Turnshek 1999) using a broad range of mass distributions. The models have never had difficulty matching the image positions, but all have failed to reproduce the flux ratios.
A difficulty for all these previous studies is that the image fluxes are likely affected by both extinction (Turnshek et al., 1997; Falco et al., 1999) and (chromatic?) microlensing (see Ostensen et al. 1997; Angonin et al. 1990; Chae et al. 2001; Hutsemekers 1993). Our 11m data essentially eliminate both of these complications. For a Cardelli et al. (1989) extinction curve, the absorption at m compared to that at H-band is only , approaching only as the lens redshift approaches that of the source. Turnshek et al. (1997) estimated a maximum extinction for H1413+117 relative to image C of approximately , depending on the assumed dust model and redshift, corresponding to negligible corrections (%) at 11m given our measurement uncertainties. In the quasar rest frame, m corresponds to m, a wavelength where the emission should be dominated by the large dust torus (Sanders et al., 1989). For microlensing by stars in the lens galaxy (at ), the Einstein radius of the stars is cm, so the torus radius is roughly 100 times larger than the Einstein radius of the typical star and microlensing effects will be weak (e.g. Refsdal & Stabell, 1991).
The particular model we advance here was considered by Chae & Turnshek (1999), where it had difficulty reproducing the optical flux ratios. We improve on their results by presenting models based on mid-IR flux ratios with their insensitivity to extinction and microlensing. In Section 2 we present our mid-IR observations of H1413+117. In Section 3 we present a simple model of the lens system that reproduces the observed flux ratios based on perturbations from a faint companion galaxy. This galaxy is not required to obtain a good fit to the system astrometry, so this represents the first clear detection of an object (albeit a visible object) through its effect on image fluxes. This is a parallel to the detections of visible satellites from astrometric anomalies. In Section 4 we discuss our results.
2 Flux measurements and errors
We observed H1413+117 with the Michelle camera on Gemini North at 11.2 microns (F112B21 filter) on 5 Aug 2005. The observing time was 1/2 hour, of which 493.6 seconds were spent on source. The data were processed with the standard Gemini pipeline mireduce. Our analysis starts with the coadded chop and nod subtracted image. These initial images have 16 vertical stripes due to the 16 readout channels; we corrected for this by subtracting the median of each stripe, masking the region containing the quasar images. This procedure also removes any residual sky flux. Figure 1 shows the resulting image.
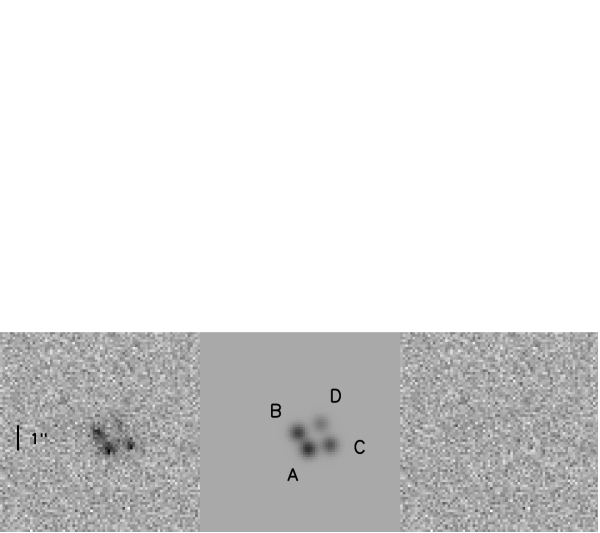
We fit the four lensed images using a 2-D Gaussian to model the PSF, fixing the relative image positions to those measured from HST images (Turnshek et al., 1997). Since the sky is so much brighter than the quasar images, we use the standard deviation of the background pixels as an estimate of the errors of the flux of each pixel. The model has nine free parameters: the fluxes of the four images (4), the position of image A (2), the standard deviation of the Gaussian PSF along the two principal directions (2), and the rotation angle of the Gaussian PSF. We found the best-fit model using non-linear Levenberg-Marquardt optimization. We used a Markov chain Monte Carlo (MCMC) with 104 steps to compute the parameter uncertainties, and we have run multiple chains to check the convergence of the best-fit parameters and their uncertainties. We also estimated the errors by simply computing the goodness of fit as a function of each image flux, marginalizing over all other variables. Figure 1 shows the best-fit model and its residuals, and Figure 2 shows the MCMC and estimate for the fluxes (in arbitrary units) and their uncertainties. We calibrated the flux measurements using observations of the standard star 20 Boo and obtained a total flux for H1413+117 consistent with the value from Aussel et al. (1998) of mJy. The image flux ratios (relative to image A) are listed in Table 1.
| Image | mid-IR | Kneib et al. | Chae & Turnshek |
|---|---|---|---|
| A | |||
| B | 0.84 0.07 | 0.92 0.04 | 0.96 0.10 |
| C | 0.72 0.07 | 0.71 0.03 | 0.59 0.10 |
| D | 0.40 0.06 | 0.57 0.02 | 0.40 0.06 |
Table 1 also compares our flux ratios to the near-IR values derived from the HST/NICMOS-NIC2 H-band image by Kneib et al. (1998b, whose values agree with ) as well as the values adopted by Chae & Turnshek (1999) based on optical/UV HST photometry with corrections for extinction (assuming SMC-like dust at redshift 2.55) and for microlensing in image D (based on the line-to-continuum flux ratios of Hutsemekers 1993). Our flux ratios are significantly inconsistent with Kneib et al. (1998b), with a of for the two measurements agreeing, and mildly inconsistent with Chae & Turnshek (1999), with a of . The differences are dominated by images D and B for Kneib et al. (1998b) and images C and B for Chae & Turnshek (1999). These characterizations of the differences include the uncertainties in both measurements, but given our uncertainties, the central values of Kneib et al. (1998b) and Chae & Turnshek (1999) are ruled out with and , respectively.

3 Models
With the intrinsic flux ratios in hand, where by “intrinsic” we mean independent of microlensing and ISM absorption, we can now explore the origin of any flux ratio anomalies. We model the system with LENSMODEL111http://redfive.rutgers.edu/keeton/gravlens/ (Keeton, 2001) using the HST WFPC/WFPC2 image positions (Turnshek et al. 1997, see Table 2). We considered three estimates of the lens position, all derived from the same HST/NICMOS-NIC2 F160W (H-band) image: that from Kneib et al. (1998b), that from Chantry & Magain (2007), and our own estimate. The three estimates (see Table 2) differ, although our estimate is more consistent with Chantry & Magain (2007). For our standard model we use a relatively loose constraint on the lens position of , which encompasses these results and the likely systematic problems in determining the position of the faint lens. We also include weak priors on the ellipticity of the main lens () and the external shear (). The main lens galaxy (G1) was initially modeled as a singular isothermal ellipsoid combined with an external shear. This is the simplest plausible model for a lens. There is considerable evidence in favor of the isothermal profile, and properties of 4-image systems other than time delays are very insensitive to the radial mass distribution (see Kochanek, 2006).
| Component | () | () |
|---|---|---|
| A | ||
| B | ||
| C | ||
| D | ||
| G1a | ||
| G1b | ||
| G1c |
This simple model has no difficulty fitting the image positions, but cannot reproduce the mid-IR flux ratios. We find similar results when using the lens positions of Kneib et al. (1998b) or Chantry & Magain (2007). If we use the very small position errors for G1 from the latter study (), the fit is dominated by the lens position (), but the fluxes are still poorly fit. We feel that our error estimates for the position of the lens galaxy (found by bootstrap resampling the dithered sub-images and refitting the model) are likely to be more realistic. For our standard model, we find for degrees of freedom. The models have 15 constraints (the positions of 4 lensed images and the lens galaxy, the 3 flux ratios, plus the priors, albeit weak, on the ellipticity and shear ) and 9 free parameters (the position, mass scale , ellipticity , position angle of G1, the amplitude and position angle of the external shear, plus the source position). Table 3 presents the best-fit model parameters and a breakdown of the contributions to the goodness of fit. We examined whether the problem was specific to a particular image by sequentially broadening the flux error bars for each image. We find improvements in the of 11.5, 0.2, 1.3, and 8.8 when we relax the flux constraints on images A, B, C, and D, respectively, suggesting that the problem lies in the fluxes for the saddle point images A and D.
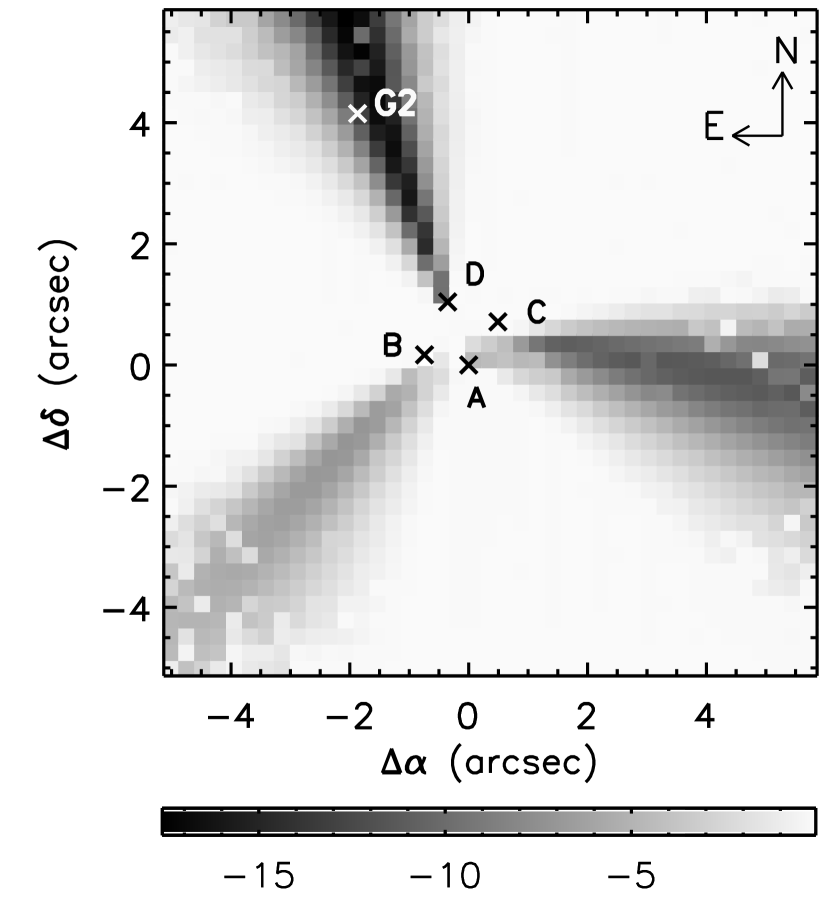
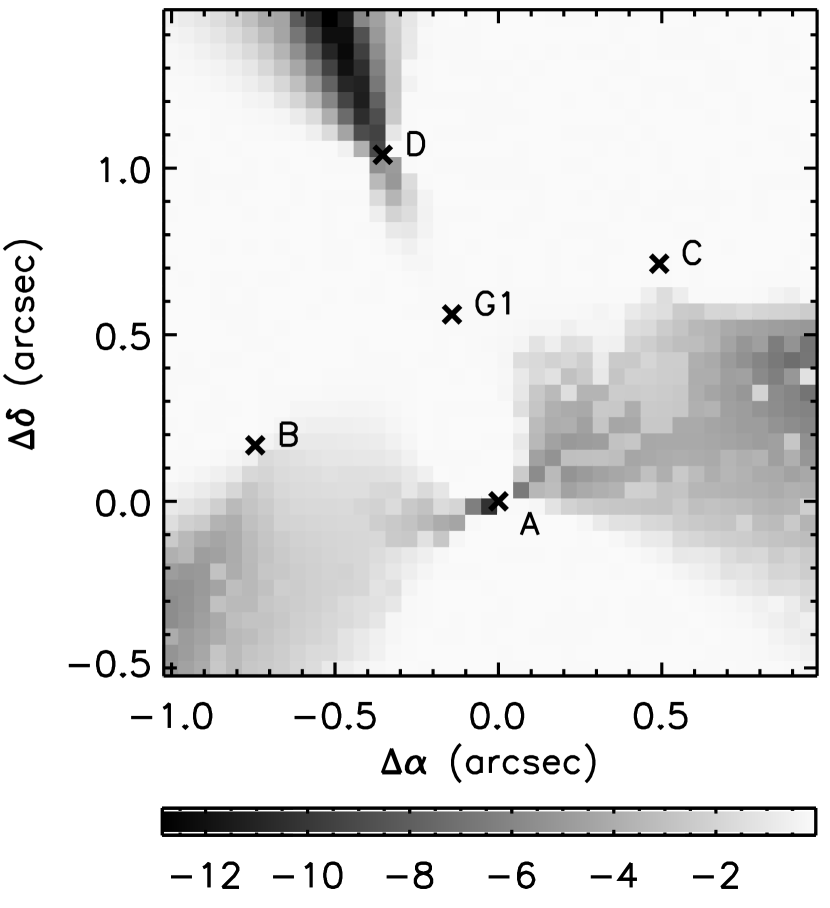
If we now consider a sequence of models adding a singular isothermal sphere (SIS) as a second lens on a grid of positions, we find the largest improvement in near the position of a galaxy (G2) lying at from image A (see Figure 3). This galaxy is object #14 in Kneib et al. (1998a) and has an H-band flux of H mag that is similar to their estimate for the flux of G1 ( mag). This was also noted in Chae & Turnshek (1999), where in their models the flux of image D was still poorly fit. If we simply add an SIS at the observed position of G2, we significantly improve the fit to for . We also find better fits to the flux ratios when using the lens positions of Kneib et al. (1998b) or Chantry & Magain (2007). G2 is close enough to the lens (at ) that it contributes more to the model than just an external shear and convergence. If we attribute the shear in our first model to G2, then we know that G2 induces a shear of order and that it will produce higher order perturbations beyond the second order shear and convergence of order . If we compare this to the eigenvalues of the magnifications, , and for images A through D respectively in our first model, we see that these higher order terms can significantly alter the fluxes of the images. This then leads to the improvement in the fit. We also note that the orientation of the external shear in our first model is nearly aligned with the direction of G2. The best-fit parameters of the two-galaxy model are also reported in Table 3. Note that the critical radii of G1 and G2, and , are very similar, as we would expect from their similar fluxes. If we vary the mass of G2, we find it is well-constrained with , despite the freedom to simultaneously adjust the external shear.
We investigated whether we had any sensitivity to the mass distributions of G1 and G2. First, we replaced G2 by a point mass, and found no significant change in the goodness of fit (). This is not surprising, as the changes can only come from the difference in mass within the annulus about G2 that covers the lensed images. Second, we replaced G1 by an ellipsoidal pseudo-Jaffe model () with the halo truncated at half the Einstein radius of the SIE model (). This has a series of more significant effects. In order for G1 to produce the same quadrupole moment at the Einstein ring, it must have higher ellipticity as it becomes more centrally concentrated. Moreover, the required shear and ellipticity will scale with the surface density at the ring, roughly as (Kochanek, 2006). This means that a centrally concentrated model for G1 will require a flatter model for G1 and a more massive G2, leading to changes in the balance between the second order terms (shear) and the higher order terms that could be more easily detected than when changing the radial structure of G2. While we generally observe these effects when we use the truncated model with , the increase to () indicates that we also lack constraints that can distinguish between extended and truncated halos for G1.
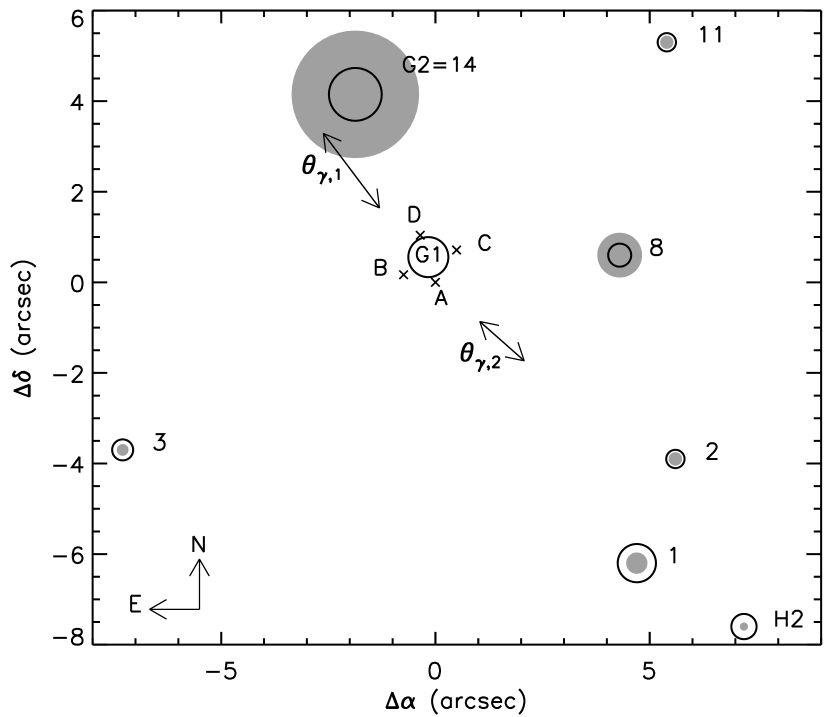
Interestingly, the orientation of the external shear in the two-galaxy model, , is nearly in the direction of another galaxy in the H-band image (Kneib et al., 1998a), namely object #1. This suggests a more general analysis of these neighbors. Figure 4 shows positions of all the nearby objects with significant H-band detections (objects H2, 1, 2, 3, 8, 11, and 14 in Kneib et al. 1998b). If we assume these are all in the same group as G1 and scale the Einstein radii of these objects by their H-band fluxes assuming a standard Faber-Jackson relation (), we can estimate the deflection scale of each galaxy near the lens as , using the fact that for an SIS. Table 4 lists our estimates for the critical radii, , shear, , and the amplitude of any higher order perturbations, , for each galaxy, where we use our best-fit critical radius of for . The galaxies in Figure 4 are shown by open circles representing their critical radii and filled circles scaled to their higher order perturbations, and the orientations of the external shear in our single and two-galaxy models are indicated with arrows.
| Model: | G1 only | G1+G2 | G1+G2+#1 | G1+G2+#1+#8 |
|---|---|---|---|---|
| 0.3 | 0.1 | 0.1 | 0.1 | |
| 15.3 | 2.4 | 1.2 | 0.7 | |
| 2.0 | 1.6 | 1.8 | 1.8 | |
| 3.8 | 0.8 | 0.3 | 0.3 | |
| 0.22 | 0.26 | 0.25 | 0.27 | |
| 0.14 | 0.087 | 0.057 | 0.045 | |
| – | ||||
| – | ||||
| – | ||||
| – | – | |||
| – | – | |||
| – | – | |||
| – | – | – | ||
| – | – | – | ||
| – | – | – |
Note. — Position angles are measured East of North and positions are relative to image A (negative RA values are Eastward of Image A). In rows 2-4, the is broken down into image positions (), flux ratios (), G1 position (), and priors on and ().
Examining Table 4, we see that the next most important galaxies are #1 and #8, where adding an object near #1 will also capture the primary effects of galaxies #2 and H2. If we add an SIS at the position of #1 we find modest improvement in the fit, with for . Adding #8 as a third galaxy does not improve the fit because its position is roughly orthogonal to the preferred shear direction, and we are using a prior of on the shear amplitude. When adding both #1 and #8, we find for . The results for these 3- and 4-galaxy models are summarized in Table 3. Note that the discrepancy between the best-fit critical radii in our models and the estimated critical radii in Table 4 is not surprising given the uncertainties in the Faber-Jackson relation, in the H-band magnitudes, and in our best-fit critical radii. Part of the improvement in these multiple-galaxy models is due to a better fit to the flux ratios, but much is due to the reduced external shear and our shear prior. These results suggest we are seeing some effects from these other nearby galaxies, but we have also reached the limits of what we can measure given the available data.
| ID | Hn (mag) | ||||
|---|---|---|---|---|---|
| G1(=H1) | – | 0.5 | – | – | |
| G2(=14) | 4.0 | 0.6 | 0.08 | 0.019 | |
| 1 | 8.3 | 0.5 | 0.03 | 0.003 | |
| 2 | 7.3 | 0.2 | 0.02 | 0.002 | |
| 3 | 8.3 | 0.3 | 0.02 | 0.002 | |
| 8 | 4.4 | 0.3 | 0.03 | 0.007 | |
| 11 | 7.3 | 0.2 | 0.01 | 0.002 | |
| H2 | 11.0 | 0.3 | 0.01 | 0.001 |
Note. — H-band magnitudes (Hn), angular separations from G1, estimated critical radii, contributions to shear, and higher order, non-linear perturbations for nearby objects detected in H-band image of H1413+117 (Kneib et al., 1998a).
4 Discussion
A persistent embarrassment in lens models has been the inability to fit image flux ratios. This is justified, in many cases correctly, by the complexities of the physical effects that modify flux ratios: absorption by the interstellar medium in the lens (e.g. Falco et al., 1999), intrinsic time variability modulated by the time delays, gravitational microlensing by stars (e.g. Wambsganss, 2006), and more massive satellites or neighboring galaxies. We know from the structure of the Einstein ring images of quasar host galaxies or lenses with other additional lensed features that the solution does not lie in giving the primary lens an odd angular structure (Yoo et al., 2006a, b; Evans & Witt, 2003; Kochanek & Dalal, 2004; Congdon & Keeton, 2005).
The advantage of mid-IR flux ratios is that they largely eliminate all of these complications other than the perturbing effects of satellites. Given typical differential extinctions seen in lenses (Falco et al., 1999), the extinction corrections in the mid-IR are negligible. Quasars should show little mid-IR variability (e.g. Poindexter et al., 2007), and the emission regions are too large to be affected by microlensing (e.g. Agol et al., 2000). It would, however, be wise to verify these latter two points empirically by coarsely monitoring a few lensed systems in the mid-IR.
The remaining physical effect, perturbations from satellites (a.k.a. CDM substructure), is thus well isolated. To date, the failure of a central lens galaxy model to fit image positions has always been traced to a luminous perturbing object (e.g. MG0414+0534, Ros et al. 2000; MG2016+112, Kochanek 2006; More et al. 2009; HE0435–1223, Kochanek et al. 2006). That this is true for “astrometric anomalies” is not surprising because astrometric perturbations are dominated by the high-mass end of the satellite mass function which will tend to have formed stars. It is also well-established that the flux-ratio anomalies can be explained by adding low-mass substructures (see, e.g. Dalal & Kochanek, 2002; Yoo et al., 2006a; Congdon & Keeton, 2005; Koopmans et al., 2003; Evans & Witt, 2003; Dobler & Keeton, 2006; Metcalf & Zhao, 2002), and the masses of the satellites can be so low that there is no surprise in a failure to observe the responsible object(s). We should also note that the introduction of a visible satellite to explain an astrometric anomaly does not necessarily explain any accompanying flux ratio anomaly. For example, while Ros et al. (2000) showed that a luminous satellite (Schechter & Moore, 1993) can explain the image positions in MG0414+0534, the model still cannot explain the flux ratio of the A1 and A2 images – a problem recently confirmed by the mid-IR observations of Minezaki et al. (2009).
Nonetheless, high-mass substructures should also produce flux ratio anomalies, and we should be able to demonstrate that these can be correctly detected and attributed. While our original goal was to use the mid-IR flux ratios to search for evidence of low-mass, non-luminous substructure in the lens H1413+117, we instead found that the flux ratios could be explained by a nearby galaxy. This galaxy, which we refer to as G2, is object #14 in the Kneib et al. (1998ab) catalog, and it lies East and North of image A. It has comparable luminosity to the main lens, and it is close enough to the lens for the higher order terms in its perturbations to the lens potential beyond an external shear to significantly modify the image magnifications. Adding other nearby galaxies does not significantly improve the fits, in large part because we have a reduced near unity after adding G2. More importantly, no perturbing galaxies are required to explain the astrometry – the detection of the neighboring galaxy is purely due to the flux ratios. The only similar claim is for the four-image lens B2045+265, where the anomaly can be explained by turning a relatively round visible satellite into a 10:1 flattened mass distribution running across the most anomalous image (McKean et al., 2007). While the model works to explain the anomaly, the mass distribution assigned to the satellite is not very physical.
Independent of any such debates, mid-IR imaging provides a simple means of greatly expanding the numbers of lenses where these issues can be studied quantitatively. While there are 10 known radio lenses with four or more images, there are 17 such optical lenses. Moreover, radio flux ratios must also be corrected for intrinsic variability modulated by the time delays (e.g. Fassnacht et al., 2002), while there is at least an expectation that these effects will be minimal in the mid-IR. If true, single epoch measurements suffice in the mid-IR, while monitoring campaigns are required for radio wavelengths. Mid-IR flux ratios will also help in models for microlensing, since a better mass model can be constructed, and the microlensing flux anomalies will be better measured. Furthermore, a survey of microlensing comparing the optical to the mid-IR (assuming the optical can be corrected for extinction) could place a constraint on the ratio of dark matter to stellar matter at the position of the lensed images (Schechter & Wambsganss, 2002).
Unfortunately, little use has been made of this approach. There are published measurements for Q2237+0305 (Agol et al., 2000; Minezaki et al., 2009), B1422+231 and PG1115+080 (Chiba et al., 2005), MG0414+0534 (Minezaki et al., 2009), and now our measurements for H1413+117. All of these measurements are of modest precision (5–10%), so there is considerable scope both for expansion of the sample and improvements in the precision. Spitzer/IRAC observations (e.g. HE1104–1805, Poindexter et al. 2007; SDSS1004+4112, Ross et al. in prep), have much higher precision but can only resolve the larger separation lenses due to the poor resolution of Spitzer (FWHM of and at 3.6 and m, respectively). Moreover, the highest resolution bands will be dominated by more compact accretion disk emission in the rest-frame of most quasars (3.6m would be m in the rest-frame of H1413+117). Thus, further progress will depend on ground-based observations until the advent of the James Webb Space Telescope (JWST), which will provide exquisite mid-IR precision for every known gravitational lens. These observations are challenging for the current generation of 8m telescopes, but will become relatively easy with the next generation of 30m telescopes.
References
- Agol et al. (2000) Agol, E., Jones, B., & Blaes, O. 2000, ApJ, 545, 657
- Angonin et al. (1990) Angonin, M.-C., Vanderriest, C., Remy, M., & Surdej, J. 1990, A&A, 233, L5
- Antonucci (1993) Antonucci, R. 1993, ARA&A, 31, 473
- Aussel et al. (1998) Aussel, H., Gerin, M., Boulanger, F., Desert, F. X., Casoli, F., Cutri, R. M., & Signore, M. 1998, A&A, 334, L73
- Belokurov et al. (2007) Belokurov, V., et al. 2007, ApJ, 654, 897
- Bullock et al. (2000) Bullock, J. S., Kravtsov, A. V., & Weinberg, D. H. 2000, ApJ, 539, 517
- Cardelli et al. (1989) Cardelli, J. A., Clayton, G. C., & Mathis, J. S. 1989, ApJ, 345, 245
- Chae & Turnshek (1999) Chae, K.-H., & Turnshek, D. A. 1999, ApJ, 514, 587
- Chae et al. (2001) Chae, K.-H., Turnshek, D. A., Schulte-Ladbeck, R. E., Rao, S. M., & Lupie, O. L. 2001, ApJ, 561, 653
- Chantry & Magain (2007) Chantry, V., & Magain, P. 2007, A&A, 470, 467
- Chen et al. (2003) Chen, J., Kravtsov, A. V., & Keeton, C. R. 2003, ApJ, 592, 24
- Chiba et al. (2005) Chiba, M., Minezaki, T., Kashikawa, N., Kataza, H., & Inoue, K. T. 2005, ApJ, 627, 53
- Congdon & Keeton (2005) Congdon, A. B., & Keeton, C. R. 2005, MNRAS, 364, 1459
- Dalal & Kochanek (2002) Dalal, N., & Kochanek, C. S. 2002, ApJ, 572, 25
- Dobler & Keeton (2006) Dobler, G., & Keeton, C. R. 2006, MNRAS, 365, 1243
- Evans & Witt (2003) Evans, N. W., & Witt, H. J. 2003, MNRAS, 345, 1351
- Falco et al. (1999) Falco, E. E., et al. 1999, ApJ, 523, 617
- Fassnacht et al. (2002) Fassnacht, C. D., Xanthopoulos, E., Koopmans, L. V. E., & Rusin, D. 2002, ApJ, 581, 823
- Hutsemekers (1993) Hutsemekers, D. 1993, A&A, 280, 435
- Kayser et al. (1990) Kayser, R., Surdej, J., Condon, J. J., Kellermann, K. I., Magain, P., Remy, M., & Smette, A. 1990, ApJ, 364, 15
- Keeton (2001) Keeton, C. R. 2001, arXiv:astro-ph/0102340
- Klypin et al. (1999) Klypin, A., Kravtsov, A. V., Valenzuela, O. & Prada, F. 1999, ApJ, 522, 82-92
- Kneib et al. (1998a) Kneib, J.-P., Alloin, D., Mellier, Y., Guilloteau, S., Barvainis, R., & Antonucci, R. 1998a, A&A, 329, 827
- Kneib et al. (1998b) Kneib, J.-P., Alloin, D., & Pello, R. 1998b, A&A, 339, L65
- Kochanek & Dalal (2004) Kochanek, C. S., & Dalal, N. 2004, ApJ, 610, 69
- Kochanek (2006) Kochanek, C. S. 2006, in Saas-Fee Advanced Course 33: Gravitational Lensing: Strong, Weak and Micro, ed. G. Meylan, P. Jetzer, P. North (Berlin: Springer), 91
- Kochanek et al. (2006) Kochanek, C. S., Morgan, N. D., Falco, E. E., McLeod, B. A., Winn, J. N., Dembicky, J., & Ketzeback, B. 2006, ApJ, 640, 47
- Koopmans et al. (2003) Koopmans, L. V. E., et al. 2003, ApJ, 595, 712
- Madau et al. (2008) Madau, P., Diemand, J., & Kuhlen, M. 2008, ApJ, 679, 1260
- Magain et al. (1988) Magain, P., Surdej, J., Swings, J.-P., Borgeest, U., & Kayser, R. 1988, Nature, 334, 325
- Mao & Schneider (1998) Mao, S., & Schneider, P. 1998, MNRAS, 295, 587
- McKean et al. (2007) McKean, J. P., et al. 2007, MNRAS, 378, 109
- Metcalf & Zhao (2002) Metcalf, R. B., & Zhao, H. 2002, ApJ, 567, L5
- Metcalf (2005) Metcalf, R. B. 2005, ApJ, 629, 673
- Minezaki et al. (2009) Minezaki, T., Chiba, M., Kashikawa, N., Inoue, K. T., & Kataza, H. 2009, arXiv:0903.2535
- Moore et al. (1999) Moore, B., Ghigna, S., Governato, F., Lake, G., Quinn, T., Stadel, J., & Tozzi, P. 1999, ApJL, 524, L19
- More et al. (2009) More, A., McKean, J. P., More, S., Porcas, R. W., Koopmans, L. V. E., & Garrett, M. A. 2009, MNRAS, 394, 174
- Ostensen et al. (1997) Ostensen, R., et al. 1997, A&AS, 126, 393
- Poindexter et al. (2007) Poindexter, S., Morgan, N., Kochanek, C. S., & Falco, E. E. 2007, ApJ, 660, 146
- Refsdal & Stabell (1991) Refsdal, S., & Stabell, R. 1991, A&A, 250, 62
- Roche (2004) Roche, P. F. 2004, Advances in Space Research, 34, 583
- Ros et al. (2000) Ros, E., Guirado, J. C., Marcaide, J. M., Pérez-Torres, M. A., Falco, E. E., Muñoz, J. A., Alberdi, A., & Lara, L. 2000, A&A, 362, 845
- Sanders et al. (1989) Sanders, D. B., Phinney, E. S., Neugebauer, G., Soifer, B. T., & Matthews, K. 1989, ApJ, 347, 29
- Schechter & Moore (1993) Schechter, P. L., & Moore, C. B. 1993, AJ, 105, 1
- Schechter & Wambsganss (2002) Schechter, P. L., & Wambsganss, J. 2002, ApJ, 580, 685
- Strigari et al. (2008) Strigari, L. E., Koushiappas, S. M., Bullock, J. S., Kaplinghat, M., Simon, J. D., Geha, M., & Willman, B. 2008, ApJ, 678, 614
- Turnshek et al. (1997) Turnshek, D. A., Lupie, O. L., Rao, S. M., Espey, B. R., & Sirola, C. J. 1997, ApJ, 485, 100
- Wambsganss et al. (2005) Wambsganss, J., Bode, P., & Ostriker, J. P. 2005, ApJ, 635, L1
- Wambsganss (2006) Wambsganss, J. 2006, in Saas-Fee Advanced Course 33: Gravitational Lensing: Strong, Weak and Micro, ed. G. Meylan, P. Jetzer, P. North (Berlin: Springer), 453
- Willman et al. (2005) Willman, B., et al. 2005, AJ, 129, 2692
- Xu et al. (2009) Xu, D. D., et al. 2009, arXiv:0903.4559
- Yoo et al. (2006a) Yoo, J., Kochanek, C. S., Falco, E. E., & McLeod, B. A. 2006a, ApJ, 642, 22
- Yoo et al. (2006b) Yoo, J., Tinker, J. L., Weinberg, D. H., Zheng, Z., Katz, N., & Davé, R. 2006b, ApJ, 652, 26
- Yun et al. (1997) Yun, M. S., Scoville, N. Z., Carrasco, J. J., & Blandford, R. D. 1997, ApJ, 479, L9
- Zentner et al. (2005) Zentner, A. R., Berlind, A. A., Bullock, J. S., Kravtsov, A. V., & Wechsler, R. H. 2005, ApJ, 624, 505