The spatial distribution of galaxies within the CMB cold spot in the Corona Borealis supercluster
Abstract
We study the spatial distribution and colours of galaxies within the region covered by the cold spot in the cosmic microwave background (CMB) recently detected by the Very Small Array (VSA; Génova-Santos et al. 2005, 2008) towards the Corona Borealis supercluster (CrB-SC). The spot is in the northern part of a region with a radius degree ( Mpc at the redshift of CrB-SC) enclosing the clusters Abell 2056, 2065, 2059 and 2073, and where the density of galaxies, excluding the contribution from those clusters, is times higher than the mean value in typical intercluster regions of the CrB-SC. Two of such clusters (Abell 2056 and 2065) are members of the CrB-SC, while the other two are in the background. This high density intercluster region is quite inhomogeneus, being the most remarkable feature a large concentration of galaxies in a narrow filament running from Abell 2065 with a length of arcmin ( Mpc at the redshift of CrB-SC) in the SW–NE direction. This intercluster population of galaxies probably results from the interaction of clusters Abell 2065 and 2056. The area subtended by the VSA cold spot shows an excess of faint () and red () galaxies as compared with typical values within the CrB-SC intercluster regions. This overdensity of galaxies shows a radial dependence and extends out to arcmin. This could be signature of a previously unnoticed cluster in the background.
keywords:
cosmology: observations - cosmic microwave background - galaxies:clusters - techniques: photometric1 Introduction
Observations of the Corona Borealis supercluster (hereafter CrB-SC) with the Very Small Array (VSA) extended configuration (Génova-Santos et al. 2005, hereafter GS05) at 33 GHz have shown a decrement in the temperature of the cosmic microwave background (CMB), with a minimum temperature of K at coordinates RA, Dec. (J2000), near the center of the supercluster, in a regionwith no known galaxy clusters. The explanation of such a strong temperature decrement based only on a primary Gaussian CMB anisotropy is extremely unlikely. This led us to consider the Sunyaev-Zel’dovich (SZ) effect generated either by a previously unnoticed galaxy cluster or by a filamentary structure consisting of warm/hot gas in this supercluster as a possible component of this decrement. The SZ effect (Sunyaev & Zeldovich 1972) arises from the inverse Compton scattering of the CMB photons by hot electrons and produces decrements in the mean temperature of the CMB at the VSA frequency. It has been detected in the direction of a number of galaxy clusters (see e.g. Lancaster et al.’s 2005 for VSA observations of this effect in galaxy clusters); however, large-scale structures in superclusters, with lower temperatures and baryon overdensities but much larger length scales, may also generate detectable SZ signals.
Millimetric observations with the MITO telescope at 143, 214 and 272 GHz (Battistelli et al. 2006) supported the presence of an SZ component, probably on top of a negative primary CMB anisotropy. Recently we have also carried out observations with the new superextended configuration of the VSA (Génova-Santos et al. 2008, hereafter G08), completely independently and at a different angular resolution of 7 arcmin (FWHM), which confirmed the presence of this decrement. The gaussianity analyses performed on these data also bore out the results of GS05. In that work we also showed that this decrement is also detected in the WMAP 5-year data, even though with a lower level of signifiance because of its coarser angular resolution and higher noise.
The joint restrictions set by the VSA decrement and by the absence of significant X-ray signal in the ROSAT All Sky Survey data (see fig. 9 of GS05) put strong constraints on the temperature and density of the gas responsible for such a decrement. In GS05 we estimated that only 0.3 galaxy clusters rich enough to produce such a deep decrement are expected in the entire surveyed region. Also, this cluster hypothesis is further disfavoured by the fact that, due to the absence of any X-ray excess, a distant cluster would be needed, and this is in disagreement with the large angular extension of the decrement. On the other hand, as we showed in GS05, a filamentary structure of diffuse gas pointing towards us with a temperature 0.6-0.8 keV, baryon overdensity 400 and length 40 Mpc, could account for 50% of the total detected decrement whilst remaining undetected in the ROSAT data. This filament would contain a gas mass M. Such structures could provide a location for a significant fraction of the baryon content in the local Universe.
In fact, the baryon density at , derived from the total budget over the well-observed components (Fukugita et al. 1998) is a factor of 2 lower than that at high redshift, inferred through independent methods, such as the Ly forest (e.g. Rauch et al. 1997), the primordial CMB fluctuations (e.g. Rebolo et al. 2004; Spergel et al. 2005) or the primordial abundance of deuterium (Tytler et al. 1996). The results of hydrodynamical simulations (Cen & Ostriker 1999; Davé et al. 1999, 2001) indicate that a significant fraction of these “missing baryons” may be located in a phase of warm/hot gas distributed in diffuse structures on supercluster scales, at temperatures K. Basilakos et al. (2006) have studied the morphology of superclusters by means of hydrodynamical and -body simulations in a -CDM model. They found that filamentary structures are very prominent in clusters and superclusters dominated by dark matter. The gaseous component is, however, predominantly spherical.
If the decrement detected by the VSA is caused by an SZ effect arising from a filamentary structure of warm/hot gas along the line of sight, there should be galaxies towards this direction which may be tracing the distribution of this gas. Therefore, an optical study of the galaxy population in this region is useful for determining whether the hypotethical SZ effect airses from such a structure or from a farther unknown galaxy cluster. In this paper we analyse the density, spatial distribution and photometric properties of such galaxies using the Sloan Digital Sky Survey (SDSS). The paper is organized as follows: Section 2 describes the main properties of the CrB-SC from an optical perspective; Section 3 presents the basic properties of the microwave and optical data used in our study; Section 4 presents the analysis of such data, focusing on the properties of the spatial distribution of galaxies within the VSA cold spot compared with those in clusters and intercluster regions. Conclusions are drawn in Section 5.
2 The Corona Borealis Supercluster of galaxies
One of the best examples of known superclusters in the northern sky is the CrB-SC. Abell (1958) first noted the presence of a concentration of clusters of galaxies in the Corona Borealis region, and included it in his catalogue of second order clusters. The first dynamical study of the CrB-SC was carried out by Postman et al. (1988) through the analysis of a sample of 1,555 galaxies in the vicinity of Abell clusters. They concluded that the mass of each cluster in the core of the CrB-SC lies in the range , while the total mass of the supercluster is , which is probably enough to bind the system. They proved also that the dynamical timescales are comparable with the Hubble time, making it unlikely that the system could be virialized. Subsequent work by Small et al. (1998) quoted a value for the mass of CrB-SC of . They remarked that almost one third of the galaxies in the region are not associated with any Abell cluster and noted the great contribution to the projected surface density of galaxies of the background cluster Abell 2069 and its surrounding galaxies. This cluster is located at a redshift , suggesting the existence of the so-called Abell 2069 supercluster. The number of clusters belonging to CrB-SC ranges from six to eight according to Postman et al. (1988) and Small et al. (1997) respectively. We will consider here that CrB-SC includes eight clusters (Einasto et al. 2001) distributed around the position RA=, Dec.=, at a redshift . Six clusters (Abell 2061, 2065, 2067, 2079, 2089 and 2092) are located in the core of the supercluster, in a region, while there are another two (Abell 2019 and 2124) at an angular distance of from the core. Einasto et al. (2001) pointed out out Abell 2061 and 2065 as the only X-ray emitting clusters. There are four other Abell clusters (Abell 2056, 2005, 2022 and 2122) in this region at redshifts , two (Abell 2069 and 2083) at and another two, Abell 2059 and 2073, in the background at redshifts 0.13 and 0.17 respectively. Other clusters have been detected using the Digital Sky Survey (Gal et al. 2003; Lopes et al. 2004), the Hamburg/RASS catalogue (Bade et al. 1998), and Sloan Digital Sky Survey (SDSS) (Koester et al. 2007), all of them with just photometric estimates of redshifts. Throughout this paper we adopt for CrB-SC a centre of RA=, Dec.= and a radius of 2.5 degrees, which corresponds to Mpc at the distance of that supercluster.
3 SDSS data
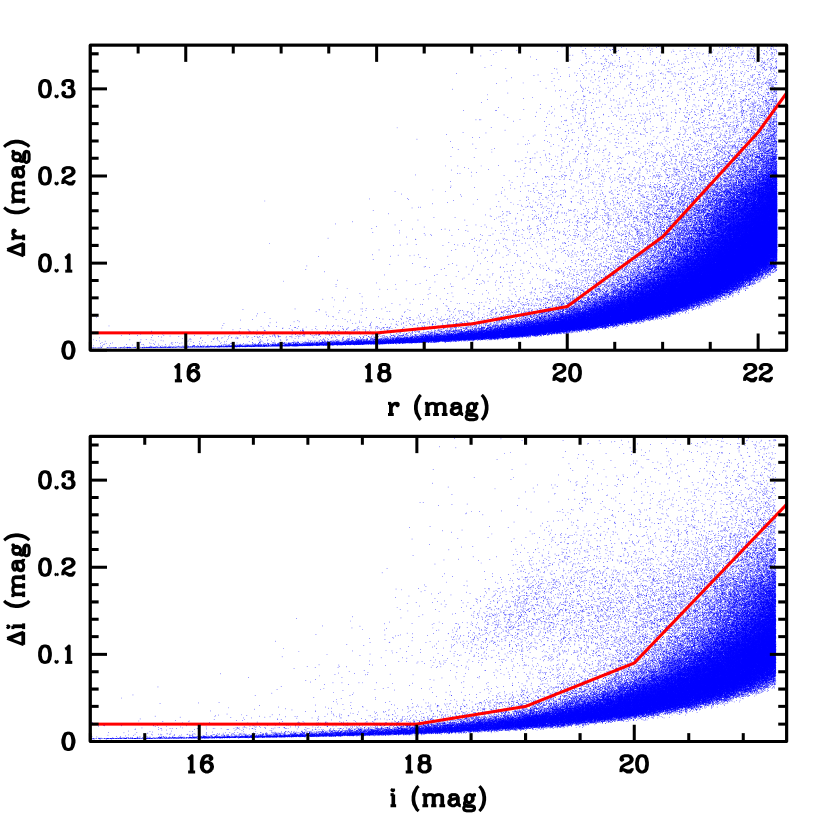
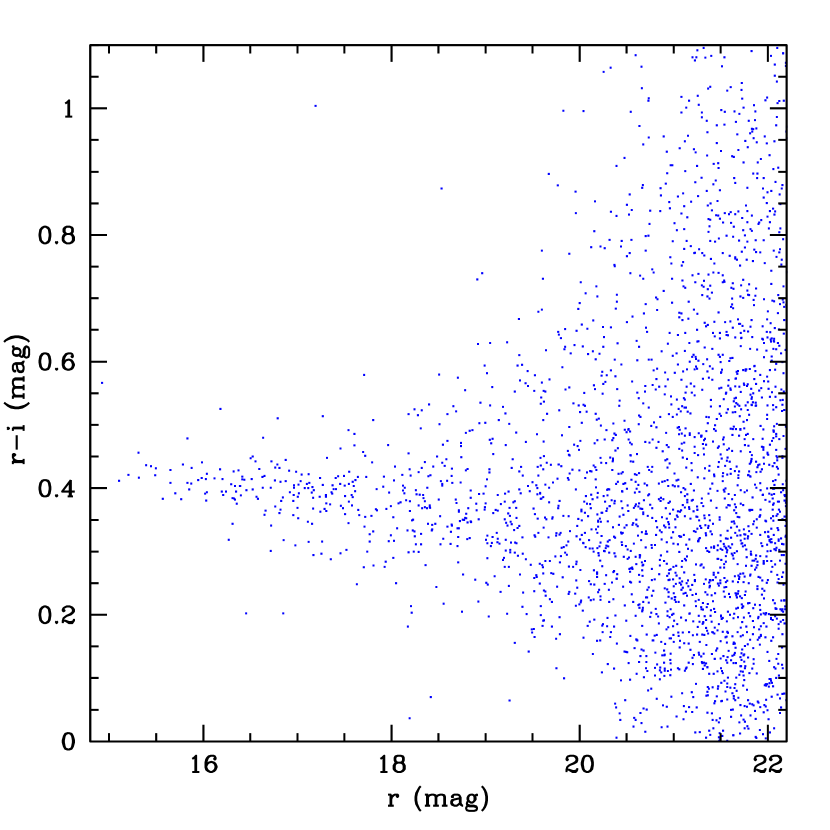
Using the SDSS-DR6 Catalogue Archive Server111http://www.sdss.org/dr6/access/index.html#CAS by SQL queries, we got the catalogues of galaxies selected from the SDSS Galaxy file. The SDSS photometric survey covers the entire region of the supercluster, apart from two narrow strips (see below). We downloaded this catalogue in the region and Dec. square degrees, and then centred in the VSA cold spot. There were 5,692,792 objects classified as galaxies in this area. The extinction in an area of square degrees around the VSA cold spot is small (0.06–0.08 mag in the filter) producing reddenings . In any case, the analysis presented in this paper uses the unreddened and magnitudes. We limit our analysis to galaxies with mag, which roughly corresponds to the completeness limits for pointlike objects in the SDSS catalogue (although some of the analysis use subsamples with additional cuts in magnitude). At the redshift () of the CrB-SC, mag corresponds to mag, and then our selection includes the full range of giants and mag within the domain of dwarf galaxies in the Corona supercluster. The most distant galaxies within the catalogue are expected to be at , where the faintest galaxies would have mag. With mag the catalogue contains 3,282,036 galaxies. We imposed an additional constraint according to the photometric errors. Figure 1 presents the errors as a function of the magnitude in and filters. As expected, for most of the objects there is a tight correlation between magnitude and error. We selected objects with errors below the solid lines in Fig 1 (see Stoughton et al. 2002 for a discussion of photometric properties of SDSS data). This constraint removes % of the objects, reducing the final number to 3,110,085 in the filter. For some of the analyses presented in this paper, we used a further restriction in colour , which is required to be in the range 0.2–0.6 according to the expectations for galaxies in the red sequence (Gladders & Yee 2000) of Corona Borealis clusters. This is illustrated in Fig. 2, which shows a colour–magnitude diagram for galaxies at distances arcmin from the centre of the cluster Abell 2065. With this restriction there are 1,217,025 galaxies left in the sample. In addition, for some of the analyses presented here we use the full sky SDSS catalogue with all galaxies up to mag in a region of square degrees.
4 Analysis
4.1 The VSA cold spot
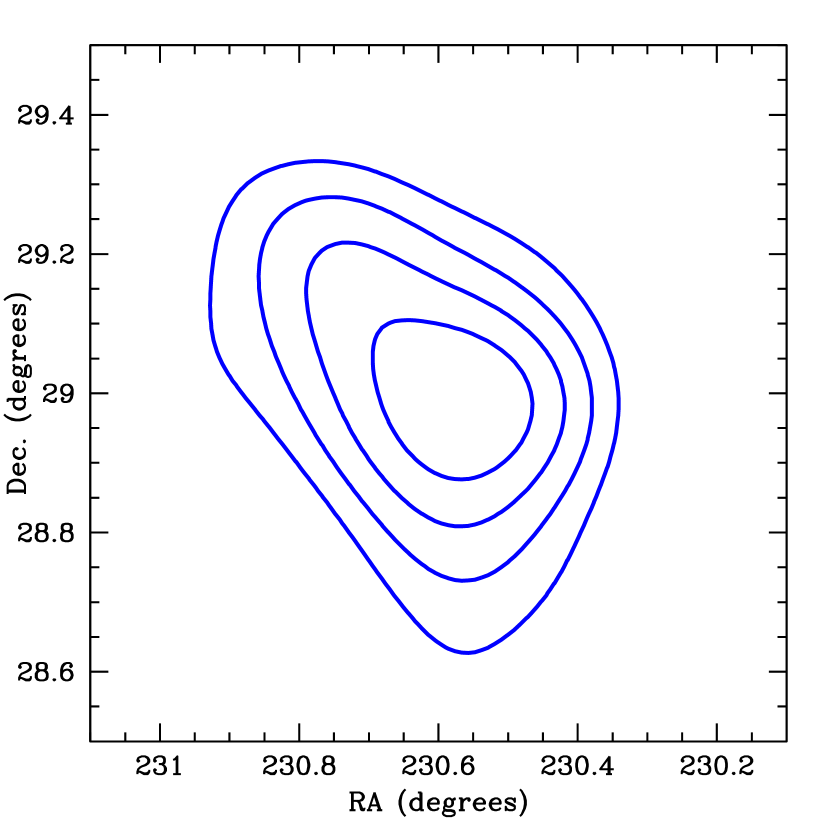
The VSA observed the CrB-SC with two different setups providing angular resolutions of 11 and 7 arcmin respectively. The cold spot was detected with both configurations. The position, size and shape of the cold spot have been determined from the uv-tapered map of the superextended configuration which has an effective resolution of 13 arcmin. The cold spot was the only feature in that map above the level. Figure 3 presents a contour map with the 2, 3, 4 and 5 levels of the cold spot obtained from the VSA map after source subtraction and Gaussian filtering (bottom-left of Fig. 1 in G08). The spot is resolved by the VSA and has an elongated shape with the major axis running along the NE–SW direction. The minimum temperature is achieved at RA=, Dec.=. The area subtended by the 2, 3, 4 and 5 levels are 894, 548, 311 and 120 square arcmin respectively. The spot is located arcmin SW from the nominal coordinates of CrB-SC as given by NED.222http://nedwww.ipac.caltech.edu/
The densities of galaxies within the 2, 3, 4 and 5 (36.2, 54,3, 72.4 and 90.5 mJy beam-1 respectively) VSA contours are listed in Table 1. We have applied the restriction in errors explained in the previous section and an mag cut in magnitude. The density of galaxies tends to be slightly higher towards the inner part of the spot; for instance it increases % from the 2 to the 5 contour level. The significance and consequences of this change are investigated in the following sections. The small changes ( mags) in the mean values of colours are compatible with the dispersion in the distribution of galaxies within each contour.
| -level | area (arcmin) | gal | (gal arcmin-2) | |
|---|---|---|---|---|
| 2 | 894 | 2565 | 2.87 | 0.428 |
| 3 | 548 | 1614 | 2.95 | 0.426 |
| 4 | 311 | 978 | 3.14 | 0.430 |
| 5 | 120 | 398 | 3.32 | 0.439 |
4.2 The distribution of galaxies within CrB-SC
Figure 4 shows the density map of SDSS galaxies in the CrB-SC with , and respectively. The maps have been built by counting galaxies within square boxes. The maps have a radius of 5 degrees and are centred at , . The dark strips running from the east edge to the centre of the maps indicate a region not covered by the SDSS DR6 data. The highest density regions in the maps correspond to the known Abell clusters. There are no Abell clusters of galaxies in the area covered by the VSA cold spot ( square arcminute below the 3 level). The nearest cluster to this spot is Abell 2059 which is projected at 26.2 arcmin (3.6 Mpc at the redshift of this cluster). The nearest cluster member of CrB-SC is Abell 2056 projected at 58.9 arcmin. This corresponds to 4.7 Mpc ( Abell radius) at the redshift of the supercluster, so there is no appreciable contribution of galaxies within this cluster at the VSA position. The highest intercluster density is found in a region roughly enclosed by a circle with a radius degree and centred arcmin south of the VSA cold spot. The limits of that region are roughly delineated by the Abell clusters 2056, 2065, 2059 and 2073. A filament centred at , and running from Abell 2065 in the NE–SW direction strip with a projected length of arcmin (3 Mpc at the redshift of the CrB-SC) shows the highest density of galaxies not specifically associated with a cluster. In the following sections we quantify the density and properties of galaxies within the area subtended by the VSA cold spot as compared with that in cluster and intercluster regions, and in the control field.
4.3 Comparison with control fields
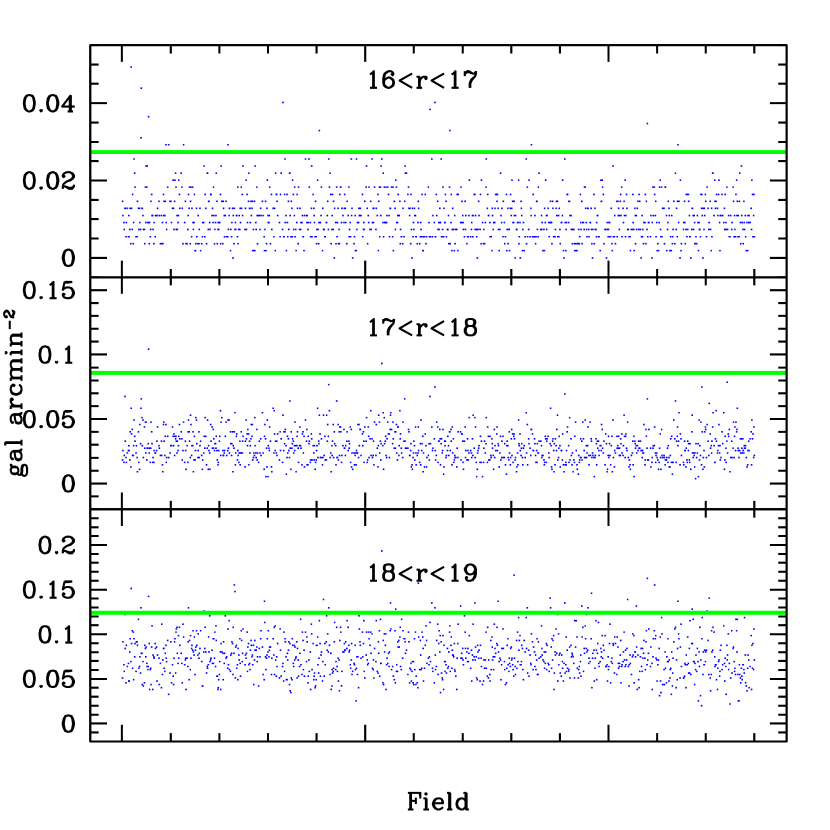
We have compared the density of galaxies within the VSA cold spot with those in randomly selected regions in the SDSS. For simplicity we computed the density within circles with a radius of 13.2 arcmin, which gives an equivalent area to that subtended by the 3 VSA cold spot contour. The fields are distributed across the whole sky region surveyed by the SDSS and are far away (30 arcmin) from any Abell cluster. Figure 5 presents the density of galaxies in each of these fields for three different cuts in magnitude. The density within the VSA cold spot is indicated by the solid line. The figure shows that for each cut in magnitude the great majority of fields have densities with values lower than that within the VSA cold spot. The results are quantified in Table 2. Only % of fields have densities comparable to or larger than the one in the VSA cold spot. The contrasts in density between VSA and the field are . This overdensity is significant at the 2–4 level depending on the cut in magnitude applied.
| VSA | |||||
|---|---|---|---|---|---|
| (mag) | (gal arcmin-2) | (gal arcmin-2) | |||
| 16-17 | 0.027 | 16 | 2.5 | 2.6 | |
| 17-18 | 0.086 | 2 | 3.0 | 4.7 | |
| 18-19 | 0.124 | 32 | 1.6 | 2.1 |
4.4 Comparison with CrB-SC intercluster regions
To estimate the density of galaxies in CrB-SC intercluster regions we built a grid with circles of 13.2 arcmin (the effective radius of the 3 VSA cold spot contour level) separated 20 arcmin in RA and Dec., and uniformly covering the CrB-SC up to 3 degrees from the centre of the supercluster. We then excluded those circles at less than 30 arcmin from the centre of the VSA cold spot, or at less than 15 arcmin from an Abell cluster, or only partially covered by the SDSS. These restrictions implicitly exclude the inner core of the CrB-SC where the intercluster density is the highest within the maps presented in Figure 4. The position of the 133 remaining regions are shown in Figure 6. The total intercluster area used for the comparison is then 20.2 square degrees (70% of the area subtended by a circle with a radius of 3 degrees centred at the CrB-SC). The results are summarized in Table 3, which presents the mean number of galaxies and colour in the intercluster regions and in the VSA cold spot. The region subtended by the VSA cold spot is overdense by factors for any of the considered cuts in magnitudes. These factors are in the range3–4 level of significance and are very robust with respect to magnitudes or colour restrictions. The mean value of colours in intercluster regions and within the VSA cold spot are compatible when dispersion from field to field and Poissonian noise are taken into account. The overdensity of galaxies found within the VSA cold spot appears to be consistent with previous findings of potential clusters of galaxies (Gal et al. 2003; Koester et al. 2007) at a distance of 8-9 arcmin from the center of the spot.

| (1) | (2) | (3) | (4) | (5) | (6) | (7) | (8) | |
|---|---|---|---|---|---|---|---|---|
| Range in mag | gals | gals | gals | gals | ||||
| 74 | 0.380 | 67 | 0.389 | |||||
| 151 | 0.424 | 129 | 0.391 | |||||
| 380 | 0.435 | 243 | 0.385 | |||||
| 897 | 0.429 | 417 | 0.388 |
4.5 Comparison with CrB-SC clusters
| Field | RA (J2000) | Dec. (J2000) | Redshift | (gal arcmin-2) | |||||||
|---|---|---|---|---|---|---|---|---|---|---|---|
| mag | |||||||||||
| (hh mm ss.ss) | (dd mm ss.s) | ||||||||||
| VSA cold spot | 15 22 11.5 | +29 00 06 | 0.253 | 0.255 | 0.215 | 0.163 | 3.214 | 2.888 | 2.606 | 2.335 | |
| Abell 2073 | 15 25 41.5 | +28 24 32 | 0.171700 | 0.594 | 0.335 | 0.260 | 0.200 | 3.727 | 3.050 | 2.593 | 2.652 |
| Abell 2059 | 15 20 17.6 | +28 50 13 | 0.130500 | 0.560 | 0.331 | 0.214 | 0.231 | 3.298 | 3.058 | 2.862 | 2.543 |
| Abell 2061 | 15 21 15.3 | +30 39 17 | 0.078400 | 0.904 | 0.450 | 0.190 | 0.150 | 4.598 | 2.986 | 2.392 | 2.266 |
| Abell 2067 | 15 23 14.8 | +30 54 23 | 0.073858 | 0.574 | 0.383 | 0.186 | 0.194 | 3.811 | 3.062 | 2.644 | 2.542 |
| Abell 2083 | 15 29 26.3 | +30 44 45 | 0.114200 | 0.361 | 0.309 | 0.162 | 0.140 | 3.232 | 2.869 | 2.582 | 2.347 |
| Abell 2056 | 15 19 12.3 | +28 16 10 | 0.084600 | 0.429 | 0.382 | 0.245 | 0.200 | 3.066 | 3.120 | 2.891 | 2.807 |
| Abell 2065 | 15 22 42.6 | +27 43 21 | 0.072600 | 1.021 | 0.541 | 0.303 | 0.255 | 4.449 | 3.771 | 2.878 | 2.991 |
| Abell 2089 | 15 32 41.3 | +28 00 56 | 0.073130 | 0.400 | 0.292 | 0.161 | 0.145 | 2.940 | 2.763 | 2.536 | 2.309 |
Table 4 shows the density of galaxies in the VSA cold spot and in the Abell clusters located up to 3 degrees from the centre of the CrB-SC. The clusters Abell 2069, 2079 and 2092 have been removed from that list because they are not completely covered by the SDSS. The table shows the density within radius of 5, 10, 15 and 20 arcmin respectively for and mags respectively. The density for Abell clusters within arcmin for the deeper cut in magnitude, is in the range 2.763–3.771 arcmin-2. The cluster with the higher density of galaxies is Abell 2065 as expected from the fact that it is one of the two cluster in the field with X-ray emission in ROSAT.
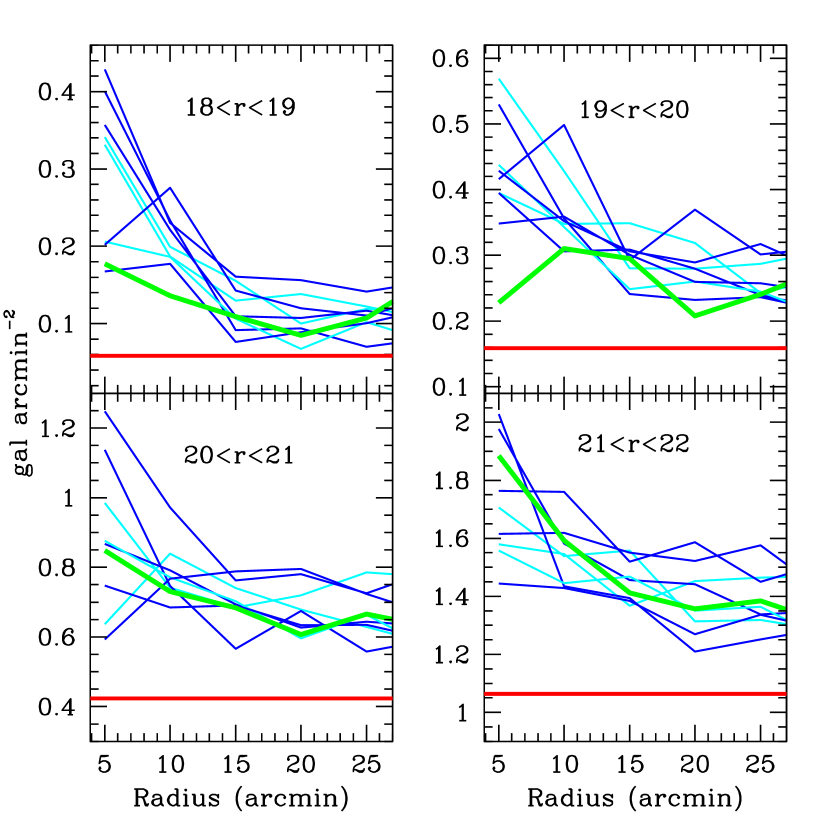
Figure 7 presents the radial dependence of such fields for several ranges in magnitude. The scale of the overdensity associated with the VSA cold spot region is 10–15 arcmin, which is similar to the typical radius of clusters at the redshift of CrB-SC. The excess found in the mag slice could be interpreted as the existence of a relatively low mass (or relatively dark) cluster at the position of the VSA cold spot and at the redshift of CrB-SC. However, the absence of overdensity in the slice suggests that this concentration of galaxies cannot be responsible for the overdensity at fainter magnitudes.
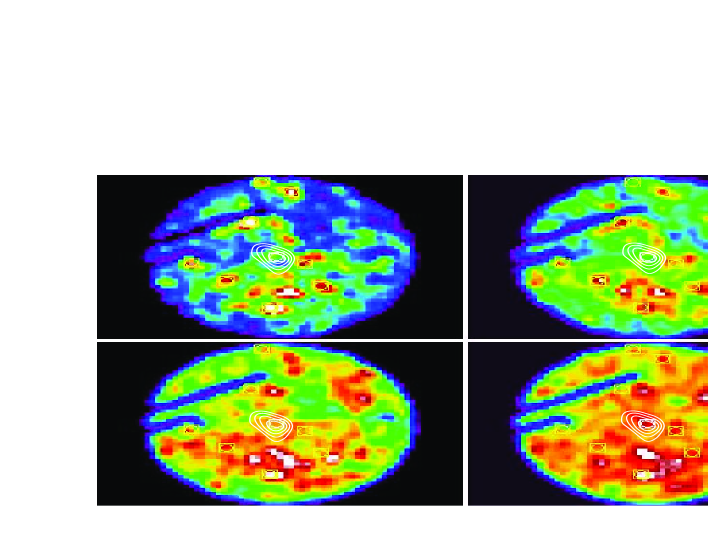
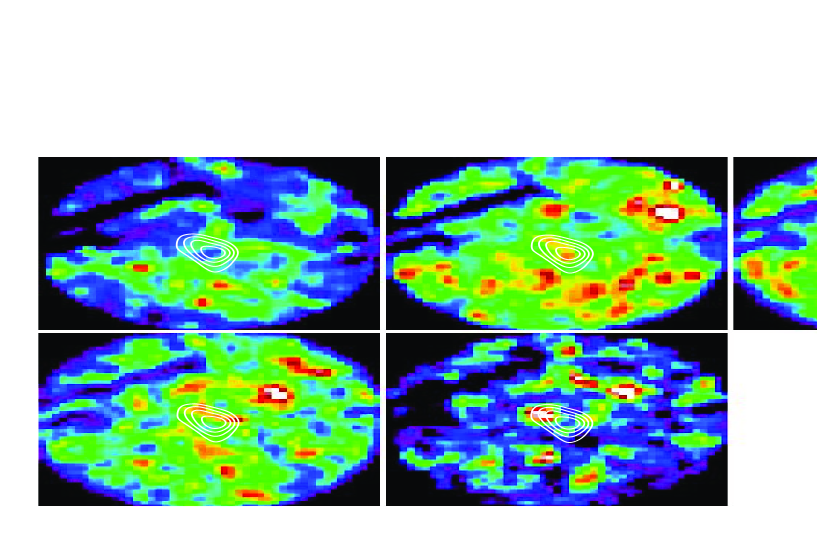
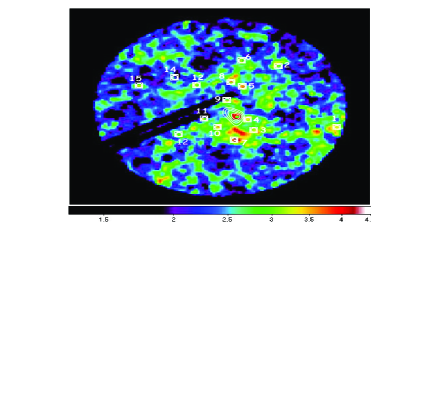
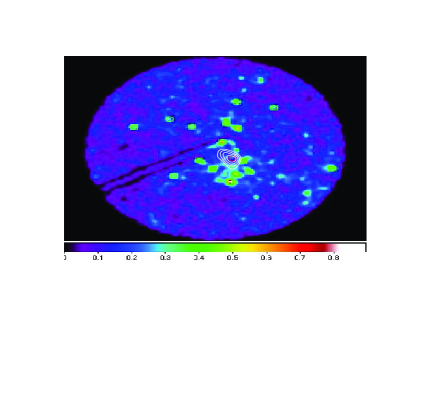
Figure 8 shows maps of the density of galaxies in a circle with a radius of 2 degrees centred at the position of the VSA cold spot. Each panel shows a slice which corresponds to a selection of galaxies in magnitude. As shown in Fig. 4, the spot is immersed within the inner core of the supercluster where the density is higher. Abell clusters are the dominant structures in the maps which show the brighter slice in magnitude. As we move to fainter cuts in magnitude, the presence of those clusters is less obvious as more and more galaxies from the background are contributing to the maps. In the first three panels the region subtended by the VSA cold spot is within a filament running from SE to NW which is slightly overdense with respect to the near environment. However, the map corresponding to the mag slice (bottom right) shows a clear overdensity with a radius arcmin located at the position of the VSA cold spot. The absence of that overdensity in the slice could indicate the presence of a cluster in CrB-SC with a lack of relatively bright galaxies, or alternatively that the concentration of galaxies is in the background of the respect to CrB-SC. Figure 9 shows the density of galaxies up to mag for different colour slices. In the redder map (bottom-middle panel) a clear overdensity emerges at the position of the VSA cold spot. This corresponds basically to the structure seen in the mag in Figure 8.
5 Conclusions
In this paper we have presented a study of the spatial distribution of galaxies in the CrB-SC, where a cold spot at 33 GHz was found by the VSA instrument working with two different configurations. We have used the SDSS data to analyse the density, and photometric properties of galaxies within the area covered by this spot and compared them with those of galaxies in Abell clusters, intercluster regions and in the field. Our main findings are:
-
•
The VSA cold spot is located in the northern part (40 arcmin from the centre) of a region of degree delineated by the clusters Abell 2056, 2065, 2059 and 2073, where the density of galaxies is a factor higher with respect to other intercluster regions. This gives an excess of galaxies up to mag with respect to typical values in the field.
-
•
The region subtended by the VSA cold spot has an overpopulation of galaxies as compared with mean values in random selected areas of the sky. Counting galaxies up to mag in random selected regions in the sky, we showed that the density of galaxies within the spot is 1.6–3.0 higher than the mean value in such control fields with little dependence on the restrictions applied in magnitudes and/or colours. Only in 1–3% of such random regions the density of galaxies is larger than in the VSA cold spot.
-
•
No Abell cluster of galaxies is found in the area subtended by the VSA cold spot ( square arcminute below the 3 level). The nearest Abell cluster is Abell 2059, which has a redshift of 0.1305 and is projected at 26.2 arcmin (3.6 Mpc at the redshift ). The nearest cluster member of CrB-SC is Abell 2056 projected at 58.9 arcmin (4.7 Mpc at the redshift of the supercluster). We conclude that the contribution of any Abell cluster to the population of galaxies within the area subtended by the VSA cold spot is probably very small.
-
•
The area subtended by the VSA cold spot shows an excess of faint () and red () galaxies, as compared with typical values within CrB-SC intercluster regions. This overdensity of galaxies shows a radial dependence and extends up to arcmin. This could be the signature of a previously unnoticed cluster at high redshift. Confirmation and delineation of such structure will require deep imaging and spectroscopic determination of redshifts.
References
- Abell et al. (1958) Abell , G. O. 1958, ApJSS, 3, 211
- (2) Bade, N. etal. 1998, A&AS, 127,145
- Battistelli et al. (2006) Battistelli, E. S., et al. 2006, ApJ, 645, 826
- Basilakos et al. (2006) Basilakos, S., Plionis, M., Yepes, G., Gottlöber, S., & Turchaninov, V. 2006, MNRAS, 365, 539
- Cen & Ostriker (1999) Cen, R., & Ostriker, J. P. 1999, ApJ, 514, 1
- Davé et al. (1999) Davé, R., Hernquist, L., Katz, N., & Weinberg, D. H. 1999, ApJ, 511, 521
- Davé et al. (2001) Davé, R., et al. 2001, ApJ, 552, 473
- Einasto et al. (2001) Einasto, M., Einasto, J., Tago, E., Müller, V., & Andernach, H. 2001, AJ, 122, 2222
- Fukugita et al. (1998) Fukugita, M., Hogan, C. J., & Peebles, P. J. E. 1998, ApJ, 503, 518
- Gal et al. (2003) Gal, R. R., de Carvalho, R. R., Lopes, P. A. A., Djorgovski, S. G., Brunner, R. J., Mahabal, A., & Odewahn, S. C. 2003, AJ, 125, 2064
- Gladders & Yee (2000) Gladders, M. D., & Yee, H. K. C. 2000, AJ, 120, 2148
- Génova-Santos et al. (2005) Génova-Santos, R., et al. 2005, MNRAS, 363, 79 (GS05)
- Génova-Santos et al. (2008) Génova-Santos, R., et al. 2008, MNRAS, 391, 1127
- (14) Koester, B. P. e2007, ApJ, 660, 239
- Lancaster et al. (2005) Lancaster, K., et al. 2005, MNRAS, 359, 16
- (16) Lopes, P. A. A., et al. 2004, AJ, 188, 1017
- Postman, Geller, & Huchra (1988) Postman, M., Geller, M. J., & Huchra, J. P. 1988, AJ, 95, 267
- Rauch et al. (1997) Rauch, M., et al. 1997, ApJ, 489, 7
- Rebolo et al. (2004) Rebolo, R., et al. 2004, MNRAS, 353, 747
- Rubiño-Martín et al. (2006) Rubiño-Martín, J. A. et al. 2006, MNRAS, 369, 909
- Small et al. (1997) Small, T. A., Sargent, W. L. W., & Hamilton, D. 1997, ApJS, 111, 1
- Small et al. (1998) Small, T. A., Ma, C-P, Sargent, W. L. W., & Hamilton, D. 1998, ApJ, 492, 45
- Spergel (2005) Spergel, D. N. 2005, ASP Conf. Ser. 344: The Cool Universe: Observing Cosmic Dawn, 344, 29
- Sunyaev & Zeldovich (1972) Sunyaev, R. A., & Zeldovich, Y. B. 1972, Comments on Astrophysics and Space Physics, 4, 173
- (25) Stoughton, C. et al. 2002, AJ, 123, 485
- Tytler et al. (1996) Tytler, D., Fan, X.-M., & Burles, S. 1996, Nature, 381, 207