Stochastic Models of User-Contributory Web Sites
Abstract
We describe a general stochastic processes-based approach to modeling user-contributory web sites, where users create, rate and share content. These models describe aggregate measures of activity and how they arise from simple models of individual users. This approach provides a tractable method to understand user activity on the web site and how this activity depends on web site design choices, especially the choice of what information about other users’ behaviors is shown to each user. We illustrate this modeling approach in the context of user-created content on the news rating site Digg.
1 Introduction
The Web is becoming more complex and dynamic as sites allow users to contribute and personalize content. Such sites include Digg, Flickr and YouTube where users share and rate news stories, photos and videos, respectively. Additional examples of such web sites include Wikipedia and Bugzilla, enabling anyone to contribute to encyclopedia articles or help develop open source software. These social web sites also often allow users to form explicit links with other users whose contributions they find interesting and highlight the activity of a user’s designated friends [13] to help users find relevant content.
Web sites often provide users with aggregate summaries of recent activity. For example, both Digg and Flickr have a front page that features ‘hot’ (popular or interesting) content. News organizations, such as The New York Times, allow users to subscribe to or embed RSS feeds of their most popular (e.g., emailed) stories in the users’ own pages. Feedback between individual and collective actions can lead to nonlinear amplification of even small signals. For example, the ‘Digg effect’ refers to the phenomenon where a ‘hot’ story on the social news aggregator Digg brings down servers hosting the story that are not equipped to deal with heavy traffic that a popular story on Digg generates.
Aggregate activity of many users determines the structure and usefulness of user-participatory web sites. Understanding this emergent behavior will enable, for example, predicting which newly contributed content will likely become popular, identifying productive ways to change how information is displayed to users, or how to change user incentives so as to improve the content.
The behavior of an individual user on a user-contributory web site is governed by a myriad of social, economic, emotional and cognitive factors, and often subject to unpredictable environmental influences, such as the weather or the economy. Nevertheless, the combined activities of many users often produce remarkably robust aggregate behaviors [24, 25].
In this paper, we present a stochastic processes-based framework for relating aggregate behavior of web users to simple descriptions of their typical individual behavior. The models can be written directly from the individual behavior descriptions, and quantified with empirical observations of a representative sample of users.
The methodology we describe applies to behaviors that can be modeled as Markov processes, i.e., where the relevant changes depend only on the current state of the system, not the detailed history of how it arrived at that state. In principle such models can always be applied by extending the complexity of the “state” describing the system. However, such complexity can lead to models requiring estimates for an impractically large number of parameters characterizing how the state changes. Instead, the Markov modeling assumption is useful primarily in connection with systems requiring only a few variables to define their current state.
At first glance an assumption of Markov processes and simple states may appear overly restrictive for describing human behavior. However, many online activities provide only a fairly limited set of actions for users and present information based on little or no historical context of particular individuals. In these cases, a few state variables can capture the main context involved in user actions. Furthermore, we discuss simplifying approximations to the models that readily enable identifying how key system behaviors relate to user actions. These simplifications come at a cost: while the resulting models correctly describe the typical aggregate behaviors, they say little about their extreme cases, e.g., where web site use is suddenly and briefly much larger than average. Even with this limitation, however, simplified models are often preferred over full models, which frequently require multiple simulation trials, which are computationally expensive and whose typical behaviors can be challenging to identify [14].
The paper is organized as follows. Section 2 reviews the stochastic modeling framework. In Section 3 we then illustrate the framework for the social news aggregator Digg [11], which allows users to submit and rate news stories by voting for the stories they like. Digg promotes highly rated stories to the front page, in essence allowing it to emerge from the decisions made by its users. We describe in detail the modeling steps: specifying an individual’s behavior on a site, estimating model parameters and solving for aggregate behaviors. We show stochastic models can correctly explain several features of this collective user behavior. Because other user-contributory web sites have features and aggregate behaviors [24, 25] similar to Digg, the stochastic modeling approach could be useful in describing a variety of sites in addition to Digg. This paper also provides a brief tutorial of useful guidelines for applying the stochastic modeling framework to the behavior of user-participatory sites.
2 Stochastic Models
Rather than account for the inherent variability of individuals, stochastic models focus on the behavior of average quantities representing aggregate properties of the system. In the context of a participatory web site, such quantities include average rate at which users contribute new content and rate existing content. Such macroscopic descriptions often have a simple form and are analytically tractable. Stochastic models do not reproduce the results of a single observation — rather, they describe typical behavior. These models are analogous to the approach used in statistical physics, demographics and macroeconomics where the focus is on relations among aggregate quantities, such as volume and pressure of a gas, population of a country and immigration, or interest rates and employment.
We represent each user as a stochastic process with a small number of states. This abstraction captures much of the relevant individual user complexity by casting their decisions as inducing probabilistic transitions between states. This modeling framework applies to stochastic processes of varying complexity. In this paper, we focus on simple processes that obey the Markov property, namely, a user whose future state depends only on her present state and the input she receives. A Markov process can be succinctly captured by a diagram showing the possible states of the user and conditions for transition between those states.
With the representation of users based on a small set of relevant states, the same set of states for all users, and transitions depending only on the state and not the individual user, the system as a whole is described simply by the number of users in each state at a given time. That is, the system configuration is defined by the occupation vector: where is the number of users in state .
The occupation vector changes as people use the web site, e.g., to view, post and rate content. In principle, one could follow the history of the system, giving a sequence of occupation vectors. However, to investigate typical behavior we consider a collection of histories of similar content (as determined through a few characteristic properties). This grouping allows the model to generalize from simply describing what has already been observed to predicting behavior of similar situations that may arise in the future.
The next step in developing the stochastic model summarizes the variation within the collection of histories with a probabilistic description. That is, we characterize the possible occupation vectors by the probability, , the system is in configuration at time . The evolution of is given by the Stochastic Master Equation [9].
Solving the Master Equation analytically is almost always intractable. Monte Carlo simulations can determine the model’s predictions, and are often feasible for evaluating relatively small group behavior [21, 18]. However, simulations are computationally challenging for large groups, such as the thousands to millions of users of contributory web sites. Moreover, the requirement to repeat the simulation many times to identify typical behavior makes it difficult to identify the key features of information available to users and their choices leading to the observed aggregate behavior of the web site. An alternative is a simple, but approximate, method working with the average occupation number, whose evolution is given by the Rate Equation
| (1) |
where denotes the average number of users in state at time , i.e., , and is an approximate expression for the average transition rate, , from configuration to configuration , with the transition rate when the occupation vector is . The transition rates can also depend explicitly on time. In the Rate Equation, occupation number increases due to users’ transitions from other states to state , and decreases due to transitions from the state to other states. Each state corresponds to a dynamic variable in the mathematical model — the average number of users in that state — and it is coupled to other variables via transitions between states.
Using the average of the occupation vector in the transition rates, i.e., , rather than the average of the transition rates for the possible occupation vectors, i.e., , is a common simplifying technique for stochastic models. A sufficient condition for the accuracy of this approximation is that variations around the average are relatively small, so the average is a fair description of the typical behavior. In stochastic models with many components, variations are often small due to many independent interactions among the components. More elaborate versions of the stochastic approach give improved approximations when variations are not small, particularly due to correlated interactions [17]. Even in these cases, however, the averaged rate equations usually provide useful qualitative relations between user behaviors and aggregate properties of the system. User behavior on the web often involves distributions with long tails, whose typical behaviors differ significantly from the average [24]. In this case we have no guarantee that the averaged approximation is adequate. Instead we must test its accuracy for particular aggregate behaviors by comparing model predictions with observations of actual behavior, as we report below.
In summary, this stochastic modeling approach to typical aggregate behavior requires specifying the aggregate states of interest and how individual user actions cause transitions among these states. The modeling approach is best suited to cases where the users’ decisions are mainly determined by a few characteristics of the user and the information they have about the system. These system states and transitions give the rate equations. Solutions to these equations then give estimates of how aggregate behavior varies in time and depends on the characteristics of the users involved.
The aggregate behavior described by the Rate Equations is universal, i.e., the same formalism describes a variety of systems governed by the same abstract principles. This approach successfully models several distributed robot systems [14, 15, 5]. Stochastic models also describe group behavior in social science, with parameters estimated from social surveys [18], e.g., the formation of network connections among teen peer groups [21].
At the heart of this argument is the concept of separation of scales, which holds that the details of microscopic (user-level) interactions are only relevant for computing the values of parameters of the macroscopic model. This principle applies broadly to naturally evolved systems, as found in biology and economics, and designed technological artifacts [3, 20]. From the perspective of large-scale group behaviors, this decomposition often arises from processing, sensory and communication limitations of the individuals and their limited set of actions. In effect, these limits mean users can only pay attention to a relatively small number of variables [6].
3 Example: Stochastic Model of Digg
As an example of stochastic modeling, we examine aggregate behavior on Digg, a social news aggregator whose users submit and rate stories. When a user submits a story, it goes to the upcoming stories list. There are a few new submissions every minute and they are displayed in reverse chronological order of their submission time, 15 stories to a page. A user votes on a story by “digging” it. A newly submitted story is visible on the upcoming stories pages for 24 hours after the submission. If the story accumulates enough votes within this 24-hour period, it is promoted to the front page, and becomes visible there. Otherwise, the story is removed after 24 hours. Although the exact promotion mechanism is kept secret and changes occasionally, it appears to take into account the number of votes the story receives and how rapidly. Digg’s popularity is fueled in large part by the emergent front page.
Digg allows users to track friends’ activities (stories they recently submitted or voted for). The friend relationship is asymmetric. When user lists user as a friend, can watch the activities of but not vice versa. We call the fan of . A submitted story is visible in the upcoming stories list, as well as to submitter’s fans through the Friends interface. With each vote, a story becomes visible to the voter’s fans through the “dugg upcoming” part of the friends interface, which shows the newly submitted stories that user’s friends voted for.
While in the upcoming stories list, a story accrues votes slowly. Once it is promoted to the front page, it accumulates votes at a much faster rate. As the story ages, accumulation of new votes slows down [25], and after a few days the story’s number of votes saturates.
We collected data by scraping Digg over a period of several days in May 2006. We determined the number of diggs for the stories as a function of the time since each story’s submission. We collected at least 4 such observations for each of 2152 stories, submitted by 1212 distinct users. Of these stories, 510, by 239 distinct users, were promoted to the front page. To focus on promoted stories, we sampled more extensively from the front pages, so our data set has a larger fraction of promoted stories than Digg as a whole. We also determined the number of fans of a subset of users, including those who submitted the stories we followed.
In this section we illustrate the stochastic approach with a model describing how the number of votes received by stories changes in time and depends on parameters characterizing individual user behavior, on average. Our goal is to produce a model that explains — and predicts — the voting patterns on Digg and how these aggregate behaviors relate to the ways Digg enables users to discover new content.
3.1 Behavioral Model
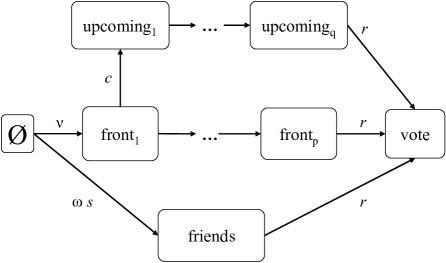
A user visiting Digg can choose to browse its front pages to see the recently promoted stories, upcoming stories pages for the recently submitted stories, or use the friends interface to see the stories her friends have recently submitted or voted for. She can select a story to read and, if she considers it interesting, vote for it. Fig. 1 shows the state diagram for user’s behavior. The user’s environment, the stories she is seeing, changes in time due to the actions of all the users.
We characterize the changing state of a story by three values: the number of votes, , the story has received by time after it was submitted to Digg, the list the story is in at time (upcoming or front pages) and its location within that list, which we denote by and for upcoming and front page lists, respectively.
With Fig. 1 as a modeling blueprint, we relate the users’ choices to the changes in the state of a single story. In terms of the general rate equation (Eq. 1), the occupancy vector describing the aggregate user behavior at a given time has the following components: the number of users who see a story via one of the front pages, one of the upcoming pages, through the friends pages, and number of users who vote for a story, . Since we are interested in the number of users who reach the vote state, we do not need a separate equation for each state in Fig. 1: at a given time, a particular story has a unique location on the upcoming or front page lists. Thus, for simplicity, we can group the separate states for each list in Fig. 1, and consider just the combined transition for a user to reach the page containing the story at the time she visits Digg. These combined transition rates depend on the location of the story in the list, i.e., the value of or for the story. With this grouping of user states, the rate equation for is:
| (2) |
where measures how interesting the story is, i.e., the probability a user seeing the story will vote on it, and , and are the rates at which users find the story via one of the front or upcoming pages, and through the friends interface, respectively.
In this model, the transition rates appearing in the rate equation depend on the time but not on the occupation vector. Nevertheless, the model could be generalized to include such a dependence if, for example, a user currently viewing an interesting story not only votes on it but explicitly encourages people they know to view the story as well.
3.2 Story Visibility
Before we can solve Eq. 2, we must model the rates at which users find the story through the various Digg interfaces. These rates depend on the story’s location in the list. The parameters of these models depend on user behaviors that are not readily measureable. Instead, we estimate them using data collected from Digg, as described below.
Visibility by position in list
A story’s visibility on the front page or upcoming stories lists decreases as recently added stories push it further down the list. The stories are shown in groups: the first page of each list displays the 15 most recent stories, page 2 the next 15 stories, and so on.
We lack data on how many Digg visitors proceed to page 2, 3 and so on in each list. However, when presented with lists over multiple pages on a web site, successively smaller fractions of users visit later pages in the list. One model of users following links through a web site considers users estimating the value of continuing at the site, and leaving when that value becomes negative [7]. This model leads to an inverse Gaussian distribution of the number of pages a user visits before leaving the web site,
| (3) |
with mean and variance . This distribution matches empirical observations in several web settings [7]. When the variance is small, for intermediate values of this distribution approximately follows a power law, with the fraction of users leaving after viewing pages decreasing as .
To model the visibility of a story on the front or upcoming page, the relevant distribution is the fraction of users who visit at least pages, i.e., the upper cumulative distribution of Eq. 3. For , this fraction is
| (4) |
where , erfc is the complementary error function, and . For , .
The visibility of stories decreases in two distinct ways when a new story arrives. First, a story moves down the list on its current page. Second, a story at the position moves to the top of the next page. For simplicity, we model these processes as decreasing visibility, i.e., the value of , through taking on fractional values within a page, i.e., denotes the position of a story half way down the list on the first page. This model is likely to somewhat overestimate the loss of visibility for stories among the first few of the 15 items on a given page since the top several stories are visible without requiring the user to scroll down the page.
List position of a story
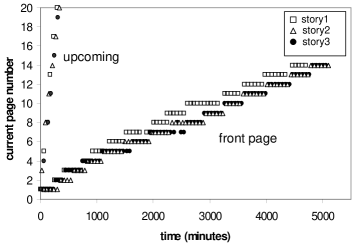
Fig. 2(a) shows how the page number of a story on the two lists changes in time for three randomly chosen stories from our data set. The behavior is close to linear, so we take a story’s page number on the upcoming page and the front page at time to be111 is a step function: when and when .:
| (5) | |||||
| (6) |
where is the time the story is promoted to the front page (before which ) and the slopes are given in Table 1. Since each page holds 15 stories, these rates are the submission and promotion rates, respectively.
Front page and upcoming stories lists
Digg prominently shows the stories on the front page. The upcoming stories list is less popular than the front page. We model this fact by assuming a fraction of Digg visitors proceed to the upcoming stories pages.
Promotion to the front page
We use a simple threshold to model how a story is promoted to the front page. Initially the story is visible on the upcoming stories pages. If and when the number of votes a story receives exceeds a promotion threshold , the story moves to the front page. This threshold model approximates Digg’s promotion algorithm as of May 2006, since in our data set we did not see any front page stories with fewer than 44 votes, nor did we see any upcoming stories with more than 42 votes. We take as an approximation to the promotion algorithm.
 |
 |
| (a) | (b) |
Friends interface
The friends interface allows the user to see the stories her friends have (i) submitted, (ii) voted for, and (iii) commented on in the preceding 48 hours. Although users can take advantage of all these features, we only consider the first two. These uses of the friends interface are similar to the functionality offered by other social media sites: e.g., Flickr allows users to see the latest images his friends uploaded, as well as the images a friend liked.
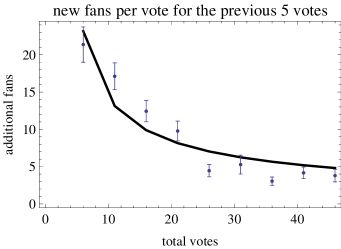
The fans of the story’s submitter can find the story via the friends interface. As additional people vote on the story, their fans can also see the story. We model this with , the number of fans of voters on the story by time who have not yet seen the story. Although the number of fans is highly variable, the average number of additional fans from an extra vote when the story has votes is approximately
| (7) |
where and , as illustrated in Fig. 2(b), showing the fit to the increment in average number of fans per vote over groups of 5 votes as given in the data. Thus early voters on a story tend to have more new fans (i.e., fans who are not also fans of earlier voters) than later voters.
The model can incorporate any distribution for the times fans visit Digg. We suppose these users visit Digg daily, and since they are likely to be geographically distributed across all time zones, the rate fans discover the story is distributed throughout the day. A simple model of this behavior takes fans arriving at the friends page independently at a rate . As fans read the story, the number of potential voters gets smaller, i.e., decreases at a rate , corresponding to the rate fans find the story through the friends interface, . We neglect additional reduction in from fans finding the story without using the friends interface.
Combining the growth in the number of available fans and its decrease as fans return to Digg gives
| (8) |
with initial value equal to the number of fans of the story’s submitter, . This model of the friends interface treats the pool of fans uniformly. That is we assume no difference in behavior, on average, for fans of the story’s submitter vs. fans of other voters.
Summary
In summary, the rates in Eq. 2 are:
where is time since the story’s submission and is the rate users visit Digg. The first step function in and indicates that when a story has fewer votes than required for promotion, it is visible in the upcoming stories pages; and when , the story is visible on the front page. The second step function in accounts for a story staying in the upcoming list for at most hours. We solve Eq. 2 subject to initial condition , because a newly submitted story starts with a single vote, from the submitter.
3.3 Model Parameters and Behavior
| parameter | value |
|---|---|
| rate general users come to Digg | |
| fraction viewing upcoming pages | |
| rate a voters’ fans come to Digg | |
| page view distribution | , |
| fans per new vote | , |
| vote promotion threshold | |
| upcoming stories list location | |
| front page list location | |
| story specific parameters | |
| interestingness | |
| number of submitter’s fans | |
The solutions of Eq. 2 show how the number of votes received by a story changes in time. The solutions depend on the model parameters, of which only two parameters — the story’s interestingness and number of fans the submitter has — change from one story to another. Therefore, we fix values of the remaining parameters as given in Table 1.
As described above, we estimate some of these parameters (such as the growth in list location, promotion threshold and fans per new vote) directly from the data. The remaining parameters are not directly given by our data set (e.g., how often users view the upcoming pages) and instead we estimate them based on the model predictions. The small number of stories in our data set, as well as the approximations made in the model, do not give strong constraints on these parameters. We selected one set of values giving a reasonable match to our observations. For example, the rate fans visit Digg and view stories via the friend’s interface, given by in Table 1, has 90% of the fans of a new voter returning to Digg within the next 19 hours. As another example of interpreting these parameter values, for the page visit distribution the values of and in Table 1 correspond to about of the users viewing more than just the first page. These parameters could in principle be measured independently from aggregate behavior with more detailed information on user behavior. Measuring these values for users of Digg, or other similar web sites, could improve the choice of model parameters.
| S | r | final votes |
|---|---|---|
| 5 | 0.51 | 2229 |
| 5 | 0.44 | 1921 |
| 40 | 0.32 | 1297 |
| 40 | 0.28 | 1039 |
| 160 | 0.19 | 740 |
| 100 | 0.13 | 458 |
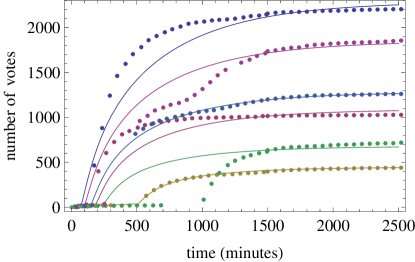
As specific examples, we consider stories promoted to the front page, though the model also describes the stories that never reach the front page. Fig. 3 shows the behavior of six stories. For each story, is the number of fans of the story’s submitter, available from our data, and is estimated to minimize the root-mean-square (rms) difference between the observed votes and the model predictions. Table 2 lists these values. The more interesting stories (with higher values) are promoted to the front page (inflection point in the curve) faster and receive more votes than less interesting stories. Overall there is qualitative agreement between the data and the model, indicating that the features of the Digg user interface we considered can explain the patterns of collective voting. This highlights a benefit of the stochastic approach: identifying simple models of user behavior that are sufficient to produce the aggregate properties of interest.
The only significant difference between the data and the model is visible in the lower two lines of Fig. 3. In the data, a story posted by the user with is promoted before the story posted by the user with , but saturates at smaller value of votes than the latter story. In the model, the story with larger is promoted first and gets more votes.
 |
 |
| (a) | (b) |
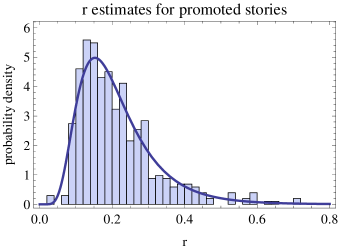
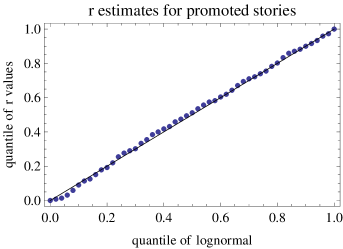
The estimated values for the stories in our data set show the 510 promoted stories have a wide range of interestingness to users. As shown in Fig. 4, these values fit well to a lognormal distribution with maximum likelihood estimates of the mean and standard deviation of equal to and , respectively, with the ranges giving the confidence intervals. A randomization test based on the Kolmogorov-Smirnov statistic and accounting for the fact that the distribution parameters are determined from the data [2] shows the values are consistent with this distribution (-value ). While broad distributions occur in several web sites [24], our model allows factoring out the effect of visibility due to the user interface from the overall distribution of votes. Thus we can identify variation in users’ inclination to vote on a story they see.
We compared model predictions with observed number of votes, either at the end of our sample for a story or two days after submission, whichever was earlier. For the promoted stories, the rms relative error between the number of votes and the model prediction is , corresponding to a rms error of votes. For stories not promoted these values are and votes, respectively.
Our data set, examining the front page at one hour intervals, only provides the hour within which the story was promoted. Based on this coarse observation, our model tends to underestimate the promotion time, with the median error of about 4 hours. This is likely due mainly to the large variation in the number of fans for subsequent voters: the model explicitly includes the submitter’s fans but only considers the average subsequent growth in fans with Eq. 7.
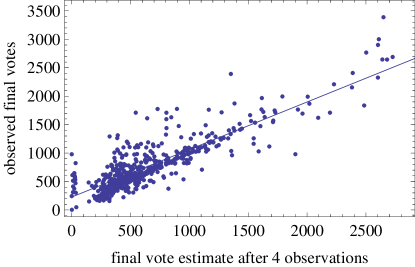
The values can be estimated from the early history of each story. For instance, using just the first 4 observations for each promoted story increases the relative error in the votes to . The predicted numbers of votes have correlation with the observed numbers so early observations provide a strong prediction of the relative ordering of numbers of votes stories will receive, as illustrated in Fig. 5. This corresponds to the predictability of eventual ratings from early reaction to new content seen on Digg and YouTube [13, 22]. Once a story reaches the front page, its subsequent growth in votes is well-predicted from the number of votes it receives shortly after promotion when accounting for the hourly and daily variation in story submission rate [22]. However, predictions based on early observations of the story prior to its promotion benefit from accounting for the growth in fans [11] as included in our model. As a simple comparison, we determined the predicted number of votes based on extrapolating from the rate a story accumulated votes during the first 4 observations. This simpler model, which does not consider the number of fans for the story’s voters, has a lower correlation, , with the observed numbers and a larger rms error. A randomization test comparing these two methods indicates this reduction in performance is statistically significant (-value less than ). Thus our model, incorporating the average growth in number of fans, provides a better description of how stories accumulate votes than simply extrapolating from early observations while on the upcoming pages. More generally, by estimating the “interestingness” of a story from early votes, we separate the influence of changing visibility in the Digg user interface from the underlying rate at which users will vote on the story if they see it.
The general behavior, of slow vote growth on the upcoming list, mainly due to fans, followed by much faster growth if the story is promoted, is qualitatively similar to previous stochastic models of Digg [11]. Thus these aggregate behaviors are somewhat robust with respect to modeling details of individual user behaviors. Our model improves on this prior work with a better motivated derivation and incorporating a more principled description of a story’s visibility and the growth in the number of fans. We also provide a more complete empirical analysis of how fans affect story promotion.
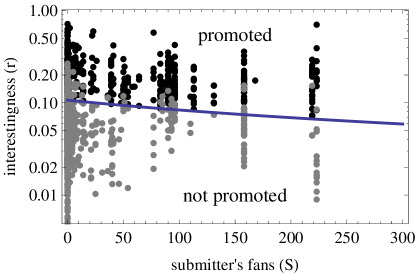
Fig. 6 shows parameters required for a story to reach the front page according to the model, and how that prediction compares to the stories in our data set. The stories in Fig. 3 are all above the promotion threshold. The model’s prediction of whether a story is promoted is correct for of the stories in our data set. For promoted stories, the correlation between and is , which is significantly different from zero (-value less than by a randomization test). Thus a story submitted by a poorly connected user (small ) tends to need high interest (large ) to be promoted to the front page [12].
Our model gives a reasonable qualitative account of how user behavior leads to stories’ promotion to the front page and the eventual saturation in the number of votes they receive due to their decreasing visibility. Additional properties of the interface and user population could be added to the model for a more accurate analysis of the behavior. For example, a submitter’s fans may find the story more interesting than the general Digg audience, corresponding to different values for these groups of users. Digg has additional mechanisms for presenting stories, e.g., by topic and “top stories” that have received especially many votes in recent time periods. Users finding stories via these parts of the Digg interface could be included with additional terms in Eq. 2.
We model users coming to Digg independently with unform rates and . In fact, the rates vary systematically over hours and days [22], and individual users have a wide range in time between visits [23]. In our model, this variation gives time-dependent values for , describing the rate users come to Digg, and and , which relate to the rate new stories are posted and promoted. Another time-dependence arises from the decreasing novelty of stories over time [25]. In our model, this behavior would arise from a combination of the story’s reduced visibility and a time-dependent decrease in the story’s interest to users (i.e., a reduction in ). Moreover, in some cases, the interestingness of web content, not just its visibility, depends on how many votes it has received [19]. The model could include this behavior with depending directly on . Additional dynamics arises if users change behavior with experience on the web site, or the site’s algorithms or interface are modified. In this case, user model parameters would need occasional reestimation.
These possibilities of incorporating additional details in the user models illustrates how the stochastic approach provides insights into how aggregate behavior arises from the users, in contrast to models evaluating regularities only in the aggregate behaviors. In particular, user models can help distinguish aggregate behaviors arising from intrinsic properties of the stories (e.g., their interestingness to the user population) from behavior due to the information the web sites provides, such as ratings of other users and how stories are placed in the site, i.e., visibility.
4 Discussion
We described a general approach to relating simple models of user choices to aggregate properties of systems involving many users. Modeling user-participatory web sites is one application of this approach, as we illustrated for Digg. Observations allow estimating the rate parameters appearing in the model. Comparing solutions to the model with observations can also help identify approaches to improving the model, e.g., by including heterogeneous preferences among users. The user state diagram is determined by the actions and information the web site makes available to users. Whether this approach results in a tractable model depends on the questions one is interested in and how much user behavior depends on details of user history or on the specific choices of other users rather than just a few aggregate measures provided by the web site.
Although we focus on Digg, many user-contributory sites have similar structural properties, including extended distributions of user activity and graphical properties of their social networks [16, 24]. Thus the stochastic formalism relating user behavior to aggregate content rating should generalize to other web sites.
The connection between user state transitions and aggregate behavior allows investigation of how changes to the web site may change aggregate behaviors. Such hypothetical uses of the modeling approach can suggest improvements to the web site. For example, Digg’s promotion algorithm could take into account the number of fans a submitter has, making it more difficult for highly connected users to get uninteresting stories promoted to the front page.
This framework is particularly relevant when information on specific users is limited, as is their set of actions (e.g., posting stories and voting on them in Digg). The framework is less well suited to describing complicated history-dependent actions (e.g., individual users who remember how others treated them in the past as when forming reputations in an e-commerce context). Moreover, while the model can suggest how changes to underlying parameters or user behaviors will affect overall observations, the model provides correlations rather than causal connections between users and observed behavior. In general, there could be other effects, not included in the available observations of the users, that significantly affect behavior and therefore may limit inference from the model of changes that may achieve some more desired behavior (e.g., users spending more time at a web site). Nevertheless, the relations seen with stochastic models can suggest ways to improve the behavior which could be tested, either directly through experimental manipulation of the web site [19] or through smaller-scale experiments [8].
A practical challenge for using these models is identifying the relevant states for the users and estimating the transition rates among these states [1, 4]. To some extent, online activities simplify this problem through their limited set of actions and information provided to users. However, web sites can become more personalized over time, e.g., with collaborative filtering for recommendations based on history. This leads to more history-dependence in user behavior and the open question of whether the history-dependence can be summarized in simple additional state variables for the user – such as probability a recommendation is relevant being a function of number of visits the person has had to a site. If so, the model only requires a few additional state variables – in this case number of visits – to regain the Markov property. Alternatively, we can generalize the model to allow the transition to the next state to depend not just on the current state but also some fixed number of past states, as has been applied to dynamic task allocation [10].
As web sites develop greater complexity and personalization, model-based design tools could help identify aggregate consequences of design choices of actions and information provided to users. More broadly, such models could complement economic or game theory analyses of the incentives for participation provided to the users.
Acknowledgments
This work is based on research supported in part by the National Science Foundation under awards IIS-0535182 and BCS-0527725. We thank M. Brzozowski and G. Szabo for helpful comments.
References
- [1] Kevin S. Brown and James P. Sethna. Statistical mechanical approaches to models with many poorly known parameters. Physical Review E, 68:012904, 2003.
- [2] Aaron Clauset, Cosma Rohilla Shalizi, and M. E. J. Newman. Power-law distributions in empirical data. arxiv.org preprint 0706.1062, 2007.
- [3] P. J. Courtois. On time and space decomposition of complex structures. Communications of the ACM, 28(6):590–603, June 1985.
- [4] Stephen P. Ellner and John Guckenheimer. Dynamic Models in Biology. Princeton Univ. Press, Princeton, NJ, 2006.
- [5] Aram Galstyan, Tad Hogg, and Kristina Lerman. Modeling and mathematical analysis of swarms of microscopic robots. In P. Arabshahi and A. Martinoli, editors, Proc. of the IEEE Swarm Intelligence Symposium (SIS2005), pages 201–208, 2005.
- [6] Tad Hogg and Bernardo A. Huberman. Artificial intelligence and large scale computation: A physics perspective. Physics Reports, 156:227–310, 1987.
- [7] Bernardo A. Huberman, Peter L. T. Pirolli, James E. Pitkow, and Rajan M. Lukose. Strong regularities in World Wide Web surfing. Science, 280:95–97, 1998.
- [8] John Kagel and Alvin E. Roth, editors. The Handbook of Experimental Economics. Princeton Univ. Press, 1995.
- [9] N. G. Van Kampen. Stochastic Processes in Physics and Chemistry. Elsevier Science, Amsterdam, revised and enlarged edition, 1992.
- [10] K. Lerman, Chris V. Jones, A. Galstyan, and Maja J. Matarić. Analysis of dynamic task allocation in multi-robot systems. International Journal of Robotics Research, 25(3):225–242, 2006.
- [11] Kristina Lerman. Social information processing in social news aggregation. IEEE Internet Computing: special issue on Social Search, 11(6):16–28, 2007.
- [12] Kristina Lerman. Social networks and social information filtering on Digg. In Proc. of International Conference on Weblogs and Social Media (ICWSM-07), 2007.
- [13] Kristina Lerman and Aram Galstyan. Analysis of social voting patterns on Digg. In Proceedings of the 1st ACM SIGCOMM Workshop on Online Social Networks, pages 7–12, New York, 2008. ACM.
- [14] Kristina Lerman, Aram Galstyan, Alcherio Martinoli, and Auke Jan Ijspeert. A macroscopic analytical model of collaboration in distributed robotic systems. Artificial Life, 7:375–393, 2001.
- [15] A. Martinoli, K. Easton, and W. Agassounon. Modeling of swarm robotic systems: A case study in collaborative distributed manipulation. Int. Journal of Robotics Research, 23(4):415–436, 2004.
- [16] M. E. J. Newman. The structure and function of complex networks. SIAM Review, 45(2):167–256, 2003.
- [17] Manfred Opper and David Saad, editors. Advanced Mean Field Methods: Theory and Practice. MIT Press, Cambridge, MA, 2001.
- [18] Garry Robins, Pip Pattison, Yuval Kalish, and Dean Lusher. An introduction to exponential random graph (p*) models for social networks. Social Networks, 29:173–191, 2007.
- [19] Matthew J. Salganik, Peter Sheridan Dodds, and Duncan J. Watts. Experimental study of inequality and unpredictability in an artificial cultural market. Science, 311:854–856, 2006.
- [20] Herbert A. Simon. The Sciences of the Artificial. MIT Press, Cambridge, MA, 3rd edition, 1996.
- [21] Christian Steglich, Tom A. B. Snijders, and Michael Pearson. Dynamics networks and behavior: Separating selection from influence. Technical report, Interuniversity Center for Social Science Theory and Methodology, July 2007.
- [22] Gabor Szabo and Bernardo A. Huberman. Predicting the popularity of online content. Technical report, HP Labs, Nov. 2008. Available at hpl.hp.com/research/scl/papers/predictions.
- [23] A. Vázquez, J. Gama Oliveira, Z. Dezso, K.-I. Goh, I. Kondor, and A.-L. Barabasi. Modeling bursts and heavy tails in human dynamics. Physical Review E, 73:036127, 2006.
- [24] Dennis M. Wilkinson. Strong regularities in online peer production. In Proc. of the 2008 ACM Conference on E-Commerce, pages 302–309, 2008.
- [25] Fang Wu and Bernardo A. Huberman. Novelty and collective attention. Proc. of the Natl. Acad. Sci., 104:17599–17601, 2007.