Improved viscosity-concentration equation for emulsions of nearly spherical droplets
Abstract
We propose an improved viscosity model accounting for experiments of emulsions of two immiscible liquids at arbitrary volume fractions and low shear rates. The model is based on a recursive-differential method formulated in terms of the appropriate scaling variable which emerges from an analysis of excluded volume effects in the system. This variable, called the effective filling fraction, incorporates the geometrical information of the system which determines the maximum packing and reduces to the bare filling fraction for infinitely diluted emulsions. The agreement of our model for the viscosity with experiments is remarkable for all the range of volume fractions and viscosity ratio.
I Introduction
Due to the central role that they play in many technological processes, the rheology of solid-liquid suspensions is a subject for which a large amount of work has been produced einstein ; krieger ; russel ; werff ; masalova ; larson ; mendoza . However, the rheological properties of emulsions of immiscible liquids have received much less attention, despite the fact that they are also very important in many industrial applications taylor ; yaron ; choi ; phan ; pal1 ; pal2 .
Emulsions present an interesting rheological behavior with characteristics similar to those of the solid-liquid suspensions. In particular, the relative viscosity of emulsions of nearly spherical droplets also diverges at certain critical value of the filling fraction: . Also similar is the fact that for very dilute emulsions where the interaction between neighboring drops is absent, the relative viscosity follows the Einstein’s like relation
| (1) |
where the viscosity ratio contains the viscosity of the dispersed phase and the viscosity of the continuous phase. Equation (1) has been originally introduced by Taylor taylor and is called Taylor’s equation. The difference between Einstein’s and Taylor’s expressions lies in the fact that in the later relation the coefficient multiplying the filling fraction incorporates information about the nature of the dispersed phase through its viscosity . However, when the viscosity of the dispersed phase is much larger than the viscosity of the continuous phase, , one recovers Einstein’s expression .
Although of fundamental importance, Taylor’s equation does not reproduces the behavior of concentrated emulsions since in this case interactions between droplets becomes very important. Several efforts have been done in order to incorporate these interactions choi ; yaron . Among them we can mention the viscosity equation developed in Ref. phan based on a differential effective medium procedure
| (2) |
that takes into account the effect of the viscosity ratio . A shortcoming of this expression is that it fails to describe the experimental data adequately at large concentrations. Pal improved this model by incorporating ”crowding effects” through a critical filling fraction , pal1 :
| (3) |
This model (called model 2) considerable improves the quantification of the rheological properties of emulsions of two immiscible liquids even at high filling fractions. However, comparison with experiments shows that it underestimates the value of the viscosity at intermediate volume fractions pal1 . Pal also proposed the following model giving excellent agreement with experimental data at large volume fractions pal2
| (4) |
however, it does not reduce to the correct Taylor’s expression at low concentrations.
Having in mind all these considerations, in this article we propose an improvement to the differential effective medium model that gives the correct divergence at the critical concentration, produces a better description of experiments and reduces to the right Taylor’s expression at low concentrations.
II Improved differential viscosity model: Scaling and excluded volume effects
In its original article, Taylor calculated the viscosity of a dilute suspension of fluid drops under three main assumptions: i) The drops are small enough to maintain a spherical shape due to surface tension, ii) no slipping exists at the interface between the drops and the host fluid and iii) tangential stresses are continuous at the surface of the drop. Then, using hydrodynamic results for the velocity field out and inside of the sphere, he obtained the corresponding expressions for the components of the stress acting across unit area of the spherical surface and imposed on the tangential components the continuity condition. The normal stress is not continuous at the surface, fact which is ultimately related to the surface tension. As a result of these impositions, Taylor obtained the explicit expressions for the four constants appearing in the formulas giving the components of the stress tensor. Then, following Einstein’s arguments, Taylor showed that in the case of liquid droplets, the factor that multiplies the volume fraction in Einstein’s relation must be replaced by . This replacement leads to Eq. (1).
The procedure followed by Taylor is very interesting since it emphasizes two different ingredients entering into the suspended phase correction () in Eq. (1)
| (5) |
The first ingredient is that the boundary conditions at the surface of the drop determine the stresses applied on it and thus control the contribution due of a single drop to the total stress of the composite system: particle plus continuous phase. The second ingredient comes from the consideration of the contribution of droplets to the composite system. Following Landau landau , one may argue that the total contribution by the drops to the total stress tensor comes from an average over the volume of the system in the form
| (6) |
where we represented the single drop contribution to the stress tensor by which is proportional to and with the radius of the drop. The upper in Eq.(6) stands for the volume average and the factor accounts for the contribution of the independent particles. However, this average is strictly valid only when the system is made of point particles. This restricts the validity of Eq. (6) to very diluted systems.
Thus, if one considers that a drop has a volume then the average must be performed over the free volume accessible to the particles, which is defined by: . Here, is the volume of one particle and is a constant taking into account the fact that the complete free volume can not be filled with drops. Note that, for different symmetries of the suspended particles, the value of the constant will be different. This is specially important in the case of drops which may change their shape when subjected to strong shears. Therefore, contains information about the maximum packing of drops the system may allocate.
Therefore, if excluded volume effects are taken into account, the suspended phase contribution to the stress tensor is given by
| (7) |
For finite-sized droplets, this relation leads to the result that the Taylor expression scales with the excluded volume factor instead of , and thus gives the following expression for the viscosity of an emulsion
| (8) |
Taylor’s formula is then recovered in the limit of very small volume fractions (). Eq. (8) explains the experimental fact that the viscosity diverges at volume fractions , implying that this effect is related to the excluded volume effects. Similar arguments used in the case of solid particles lead to excellent agreement between experiments and theory, see Ref. mendoza .
The central result of the present analysis is Eq. (8), which shows that the correct scaling factor describing the dependence of the viscosity of an emulsion of finite-sized droplets on the filling fraction is the effective filling fraction
| (9) |
where is a structural or crowding factor that takes into account the arrangements of the droplets in the emulsion and is given by
| (10) |
where is the filling fraction at the divergence. The importance of is that it incorporates correlations between particles by taking into account geometrical information having the characteristic that at low volume fractions and at maximum packing. This quantity plays an important role in determining the correct dependence of the viscosity of the emulsion, as we will show next.
At low volume fractions, the shear viscosity of an emulsion is given by Eq.(8). In order to extend it to larger filling fractions , we will use a differential effective medium approach in which a concentrated emulsion is obtained from an initial continuous phase by successively adding infinitesimally small quantities of droplets to the system until the final volume fraction of the dispersed phase is reached.
The usual implementation of the differential theory to obtain a concentrated emulsion up to a given stage, consists in treat it as a homogeneous effective medium of viscosity into which we add a quantity of new droplets. Then, the new viscosity is calculated using Taylor’s expression to give
| (11) |
Here, it is important to notice that in order to allocate the new droplets maintaining constant the volume of the system, one has to remove part of the effective medium in order to allocate the new quantity () of droplets. Therefore, the new filling fraction is given by , from which one finds
| (12) |
A shortcoming of using Eq. (11) and the bare filling fraction is that it does not contains the correlations generated by the excluded volume effects, that is, it assumes that all the volume of the emulsion before new droplets are added is available to the new droplets. However, as we have mentioned previously, this is not possible since the droplets can occupy only the free volume and therefore scale according to , Eq. (9).
These considerations suggest that the differential theory must be performed in terms of the scaling variable and not on the bare filling fraction itself.
Therefore, making the substitution of by in Eqs.(11) and (12) and integrating we obtain
| (13) |
that, in terms of the bare filling fraction takes the form
| (14) |
Expressions (13) and (14) are similar to other ones based on the differential method, see, for example, Eqs. (2)-(4). However, our model crucially makes use of the geometrical information of the system from the start through . This makes an essential difference since, in contrast to the usual differential procedure, the use of as the integration variable incorporates correlations between droplets of the same recursive stage, resulting in an improvement of the quantitative description when compared to experimental data, as will be shown in the next section.
III Results
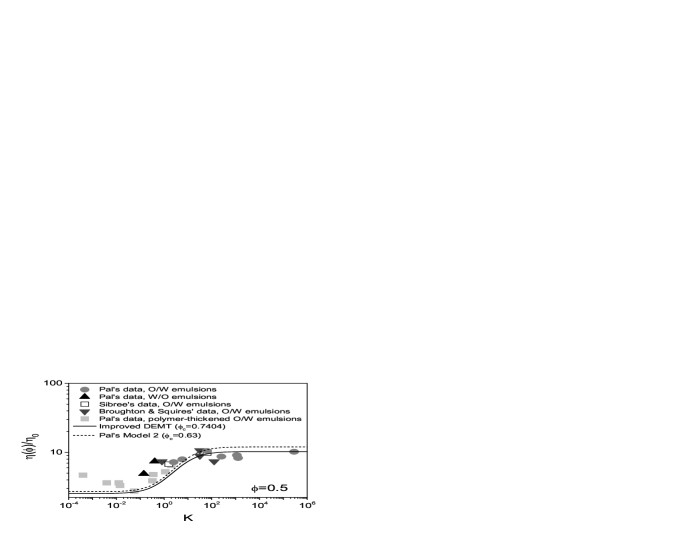
In Figure 1 we show the relative viscosities predicted form the improved DEMT, Eq.(13), and Pal’s model 2, Eq.(3), as a function of the viscosity ratio . Both models initially show a nearly constant value followed by an increase in the range , approximately, and finally becomes nearly constant again for large values of . They also predict an increase with increasing In this figure, was taken to be . A comparison between both models show that the improved DEMT, Eq.(13), predicts higher values of the relative viscosity than Pal’s model 2, Eq.(3), over the full range of The difference between both models is larger for larger .
The various data sets considered for comparison with the models are the same as the ones used in Ref. pal1 . They consist on emulsions covering a viscosity ratio and with the characteristic that the capillary number is small and that the emulsions are stable (unfloculated).
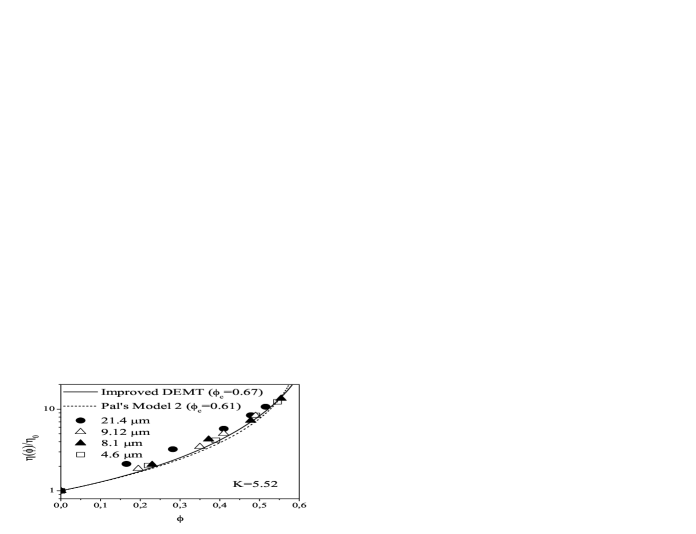
Figure 2 shows comparisons between the experimental data and predictions of improved DEMT, Eq.(13), and Pal’s model 2, Eq.(3), for different values of the viscosity ratio . As can be seen, improved DEMT describes the experimental data slightly better than Pal’s model 2. However, the more significant difference between both models is the fitting parameter which varies for different values of . In all cases the improved DEMT predicts larger values of . Figure 3 shows the independence of the relative viscosity on the mean droplet size. The comparison with the theoretical models show again a better fit for the improved DEMT. In Fig. 4 we compare experimental relative viscosity data at a fixed as a function of the viscosity ratio . Both models show a good agreement with experimental data, nonetheless approximate fitting values of are very different in both models, being larger for the improved DEMT.
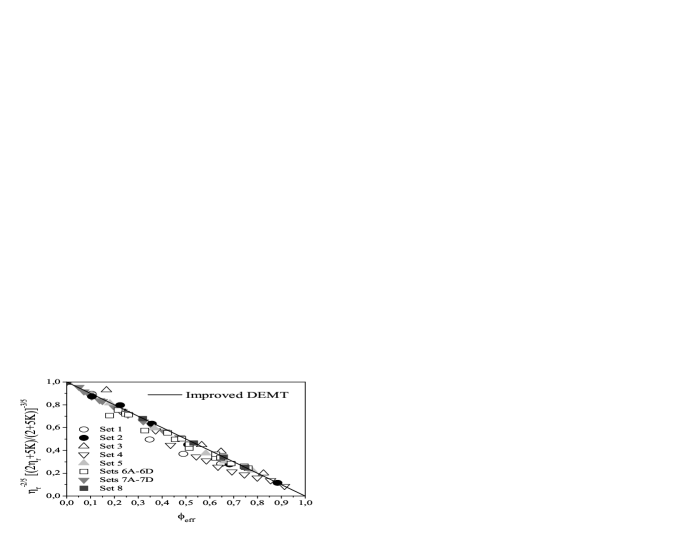
According to Eq.(13), the viscosity, plotted in the form versus , should be system independent. This is confirmed in Fig. 4 which shows all the viscosity data, and compare them with the improved DEMT prediction. Pal’s model 2 can not be plotted in this sample independent form since it produces different curves for different values of . As can be seen, the agreement between data points and improved DEMT is excellent.
IV Conclusions
An improved viscosity equation is developed for emulsions of spherical droplets starting from the Taylor’s equation for the viscosity of very dilute emulsions taylor and using a differential effective medium approach. Geometrical information about the packing of the droplets is included through an effective volume fraction, , which approaches at low concentrations and becomes one at the critical concentration. The model improves the results obtained with Pal’s model 2, Ref. pal1 for the relative viscosity, describes experimental data very well, and reduces to Taylor’s expression at low concentrations. In the limit it reduces to the expression recently found for a suspension of hard spheres mendoza .
Acknowledgements
This work was supported in part by Grant DGAPA IN-107607 (CIM) and DGAPA IN-102609 (ISH).
References
- (1) Einstein, A.: Eine neue Bestimmung der Molekul dimension, Ann. Phys. (Leipzig) 19 (1906) 289-306.
- (2) Krieger, I. M. and T. J. Dougherty: A mechanism for non-Newtonian flow in suspensions of rigid spheres. Trans. Soc. Rheol. 3 (1959) 137-152.
- (3) I. Masalova, A. Ya. Malkin. Rheology of highly concentrated emulsions-concentration and droplet size dependencies. J. Phys. Chem. 17, (2007) 42250.
- (4) Larson, R. G.: The Structure and Rheology of Complex Fluids . Oxford University Press, New York, 1999.
- (5) Mendoza, C. I. and I. Santamaría-Holek: The rheology of hard sphere suspensions at arbitrary volume fractions: An improved differential viscosity model. J. Phys. Chem. 130, (2009) 044904.
- (6) Russel, W. B.: Review of the role of colloidal forces in the rheology of suspensions. J. Rheol. 24 (1980) 287-317.
- (7) van der Werff, J. C. and C. G. De Kruif: Hard-sphere colloidal dispersions: The scaling of rheological properties ewith particle size, volume fraction, and shear rate. J. Rheol. 33 (1989) 421-454.
- (8) Pal, R.: Novel viscosity equations for emulsions of two immiscible liquids. J. Rheol. 45 (2001) 509-520.
- (9) Pal, R.: Viscosity-Concentration Equation for Emulsions of Nearly Spherical Droplets. J. Colloid Interface Sci. 231, (2000) 168-175.
- (10) Phan-Thien, N. and D. C. Pham: Differential multiphase models for polydispersed suspensions and particulate solids. J. Non-Newtonian Fluid Mech. 72 (1997) 305-318.
- (11) Taylor G. I.: The viscosity of a fluid containing small drops of another liquid. Proc. R. Soc. London, Ser. A 138 (1932) 41-48.
- (12) Yaron I. and B. Gal-Or: On viscous flow and effective viscosity of concentrated suspensions and emulsions. Rheol. Acta 11 (1972) 241-252.
- (13) Choi, S.J. and W. R. Schowalter: Rheological properties of nondilute suspensions of deformable particles. Phys. Fluids 18 (1975) 420-427.
- (14) Landau L.D. and Lifshitz E.M.: Course of Theoretical Physics, Fluid Mechanics. Pergammon, New York 1980), Vol. 6.
Figure Captions
Fig. 1. Relative viscosity predicted from the improved DEMT, Eq.(13) (solid line) and Pal’s model 2, Eq.(3) (dashed line). is taken to be .
Fig. 2. Comparisons between the experimental data [Pal (2001)] and best fits of the theoretical predictions for the volume dependence of the relative viscosity for different values of the viscosity ratio . The solid line is the result of the improved DEMT and the dashed line the prediction of Pal’s model 2.
Fig. 3. Comparisons between the experimental data and predictions of improved DEMT (solid line), Eq.(13) and Pal’s model 2 (dashed line), Eq.(3). The best fit for the improved DEMT was obtained with and for Pal’s model 2 .
Fig. 4. Viscosity ratio () dependence of the relative viscosity. The solid line is the result of the improved DEMT with and the dashed line is the prediction of Pal’s model 2 with .
Fig. 5. Master curve of consisting of all the experimental viscosity data. The solid line is the result of the improved DEMT.