A Chandra Study of the Rosette Star-Forming Complex. II. Clusters in the Rosette Molecular Cloud
Abstract
We explore here the young stellar populations in the Rosette Molecular Cloud (RMC) region with high spatial resolution X-ray images from the Chandra X-ray Observatory, which are effective in locating weak-lined T Tauri stars as well as disk-bearing young stars. A total of 395 X-ray point sources are detected, 299 of which (76%) have an optical or near-infrared (NIR) counterpart identified from deep FLAMINGOS images. From X-ray and mass sensitivity limits, we infer a total population of young stars in the survey region. Based on smoothed stellar surface density maps, we investigate the spatial distribution of the X-ray sources and define three distinctive structures and substructures within them. Structures B and C are associated with previously known embedded IR clusters, while structure A is a new X-ray-identified unobscured cluster. A high mass protostar RMCX #89 = IRAS 06306+0437 and its associated sparse cluster is studied. The different subregions are not coeval but do not show a simple spatial-age pattern. Disk fractions vary between subregions and are generally % of the total stellar population inferred from the X-ray survey. The data are consistent with speculations that triggered star formation around the HII region is present in the RMC, but do not support a simple sequential triggering process through the cloud interior. While a significant fraction of young stars are located in a distributed population throughout the RMC region, it is not clear they originated in clustered environments.
1 Introduction
In the last two decades, developments in infrared (IR) technologies, such as arrays and the mid-IR Spitzer Space Telescope, have enabled large-scale studies of star formation processes in molecular clouds (e.g., Lada et al., 1991; Lada & Lada, 1995; Carpenter, 2000; Evans et al., 2003; Churchwell et al., 2004; Young et al., 2005; Harvey et al., 2006). One major discovery from such surveys of nearby clouds is that a large fraction (70%-90%) of stars form in embedded clusters (Lada & Lada, 2003). The spatial distribution and hierarchical structure of embedded clusters in giant molecular clouds (GMCs) should reveal physical processes in cluster formation (e.g., Elmegreen, 2000; Bonnell et al., 2001; Lada & Lada, 2003; Tan et al., 2006; Ballesteros-Paredes et al., 2007). It is particularly important to understand the influence of initial clusters on later star formation in adjacent cloud material. The expansion of the HII region around massive stars in young stellar clusters can, in principle, sequentially trigger formation of second-generation OB clusters, as described by Elmegreen & Lada (1977) (see also Whitworth et al., 1994; Dale et al., 2007; Preibisch & Zinnecker, 2007). However, the operation of triggering in specific cases of OB associations in GMCs is often unclear.
As one of the most massive Galactic GMCs, the Rosette Molecular Cloud (RMC) is ideal for studying the formation and possible triggering of embedded star clusters. With a total extent of 150 pc (Cox et al., 1990) and of molecular gas (Blitz & Thaddeus, 1980), it lies only 1.4 kpc from the Sun (Hensberge et al., 2000). Townsley et al. (2003, hereafter TFM03) and Román-Zúñiga et al. (2008b, hereafter RL08) review past and present research on this well-studied and important star formation region. Its orientation is perpendicular to the line-of-sight with a large, annular HII region at its tip known as the Rosette Nebula. This HII region is powered by the Myr old OB cluster NGC 2244 (Wang et al., 2008, hereafter Paper I). The molecular gas exhibits the strongly clumped structure characteristic of turbulent GMCs (Williams & Blitz, 1998; Heyer et al., 2006).
Phelps & Lada (1997, henceforth, PL97) identified seven embedded clusters in the dense molecular cloud cores from stellar concentrations in near-IR (NIR) images which are associated with IRAS mid-IR sources (see Figure 1a in Paper I). They suggested that both triggered and spontaneous star formation may be contributing to the forming clusters in this cloud. The recent deeper FLAMINGOS NIR imaging survey of Rosette (Román-Zúñiga et al., 2008a, hereafter REFL08) reveal four more clusters across the complex. They find an increasing fraction of younger stars (identified from -band excesses associated with hot circumstellar disks) with increasing distance from NGC 2244, implying a temporal sequence of star formation across the complex. Four new clusters and over 700 stars with dusty disks are located in mid-IR maps obtained with the IRAC and MIPS detectors on the Spitzer Space Telescope (Poulton et al., 2008). Both the FLAMINGOS and studies argue that the embedded star formation is not principally produced by sequential triggering from the NGC 2244 OB cluster.
Lying 2∘ from the Galactic Plane, IR imaging surveys in the Rosette region are unavoidably contaminated by the overwhelming field star populations. Therefore, identification of young embedded populations has relied on selecting stars with IR color excesses produced by dusty circumstellar disks. Because the many diskfree pre-main sequence stars (PMS) (weak-lined T Tauri stars, WTTS) that are cluster members cannot be identified in this way, statistical subtraction of the contaminating field population is needed to estimate the full embedded population from IR images. Even in very young clusters, the WTTS may outnumber stars with prominent disks (e.g., Walter et al., 1988; Neuhaeuser et al., 1995).
PMS stars both with and without disks are well-known to emit X-rays that can penetrate the heavy extinction of GMCs (Feigelson et al., 2007). The level of X-ray emission from young stellar populations is elevated times above the levels of X-ray emission from the old Galactic disk population (Preibisch et al., 2005). As a consequence, X-ray observations, particularly with the high spatial resolution Chandra X-ray Observatory, are highly efficient in selecting PMS members in stellar clusters. images provide remarkably complete and unbiased PMS populations with subarcsecond positions. X-ray surveys thus complement IR surveys in establishing the census of embedded PMS populations in GMCs which in turn can address issues relating to triggered star formation. has made recent advances in the study of star formation triggering in the vicinity of HII regions produced by the Cep OB3b, Trumpler 37 (IC 1396), NGC 6618 (M 17), and Trumpler 16 (Carina) OB associations and a high latitude cluster (Getman et al., 2006, 2007; Broos et al., 2007; Sanchawala et al., 2007; Getman et al., 2008a).
A previous X-ray study of the RMC was presented by Gregorio-Hetem et al. (1998) based on an image from the ROSAT satellite. They report faint X-ray sources associated with embedded IR-emitting low mass star clusters. However the poor spatial resolution and soft energy band of ROSAT prevents identification of individual embedded stars. The diffuse and stellar emission from the central Rosette Nebula cluster NGC 2244 were studied in detail in TFM03 and Paper I.
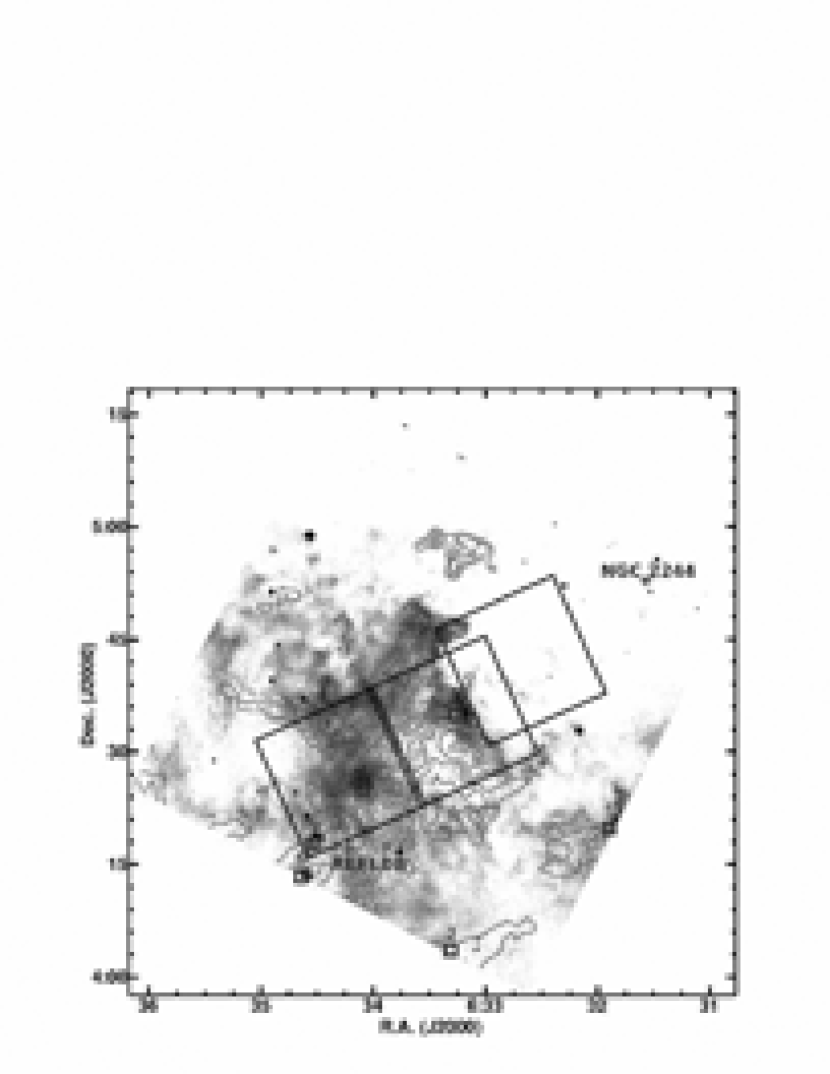
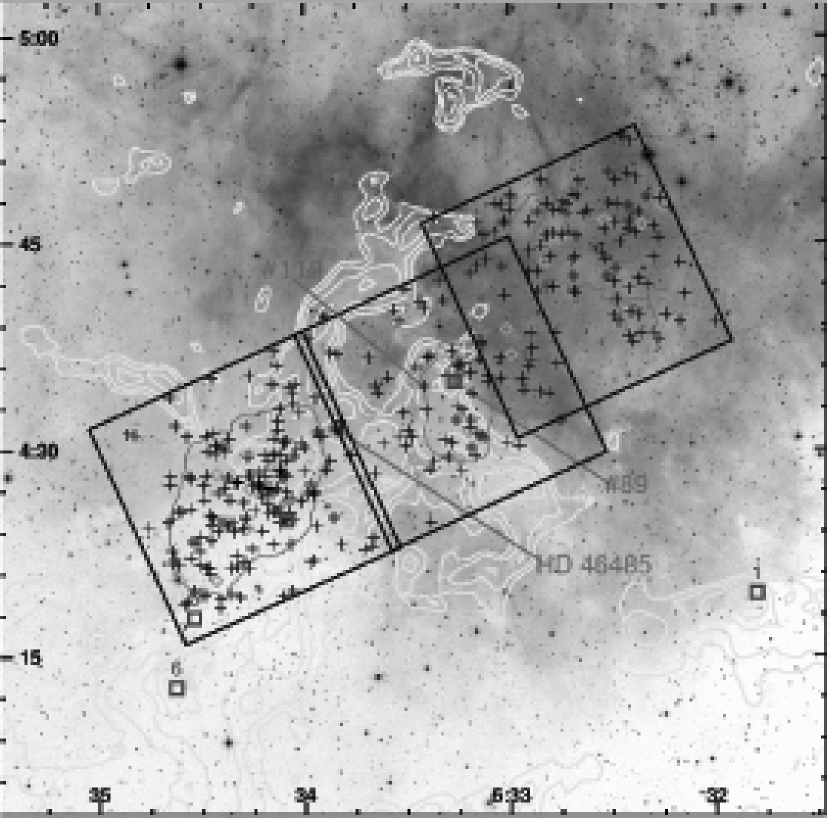
We now examine a mosaic of four Chandra images in the RMC, presented without detailed analysis in TFM03, to identify the PMS population and study the cluster formation process in molecular clouds, complementing the NIR studies (PL97, RL08, REFL08). Figure 1 outlines the location of our images with respect to the molecular gas and dust emission and the NIR clusters. Section 2 describes the observations with § 2.2 outlining the stellar counterparts of the X-ray sources. Important individual stars are discussed in § 3. Characterization of the embedded clusters, and non-clustered (distributed) population, follows in § 4. In particular we discover a previously unidentified older cluster (§ 4.4) and investigate clustered star formation in the particular environment of the Rosette Complex (§ 4.8). In § 5 we summarize our findings and discuss the implications for star formation modes in the RMC.
2 X-ray Sources in the RMC
2.1 Chandra Data Analysis
The RMC was observed with the Imaging Array of Chandra’s Advanced CCD Imaging Spectrometer (ACIS-I) in a sequence of 20 ks exposures obtained in January 2001 (ObsIDs 1875-77). The observatory and instrument are described by Weisskopf et al. (2002). Details on the data filtering, point source detection and extraction, variability analysis, and spectral fitting procedures using the ACIS Extract (AE) software package111The ACIS Extract software package and User’s Guide are available online at http://www.astro.psu.edu/xray/docs/TARA/ae_users_guide.html. (Broos et al., 2002) are given in Paper I. This paper also defines the quantities presented in the source tables below.
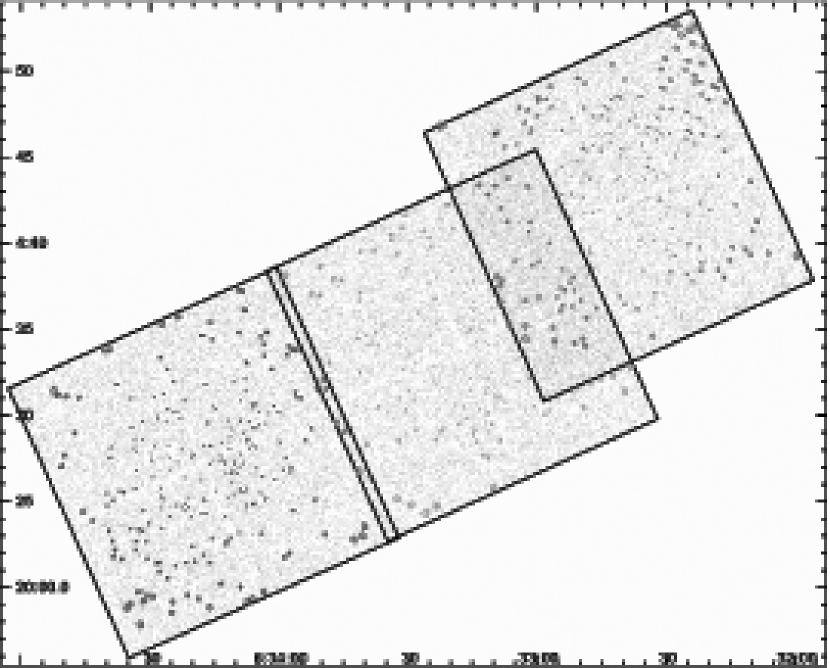
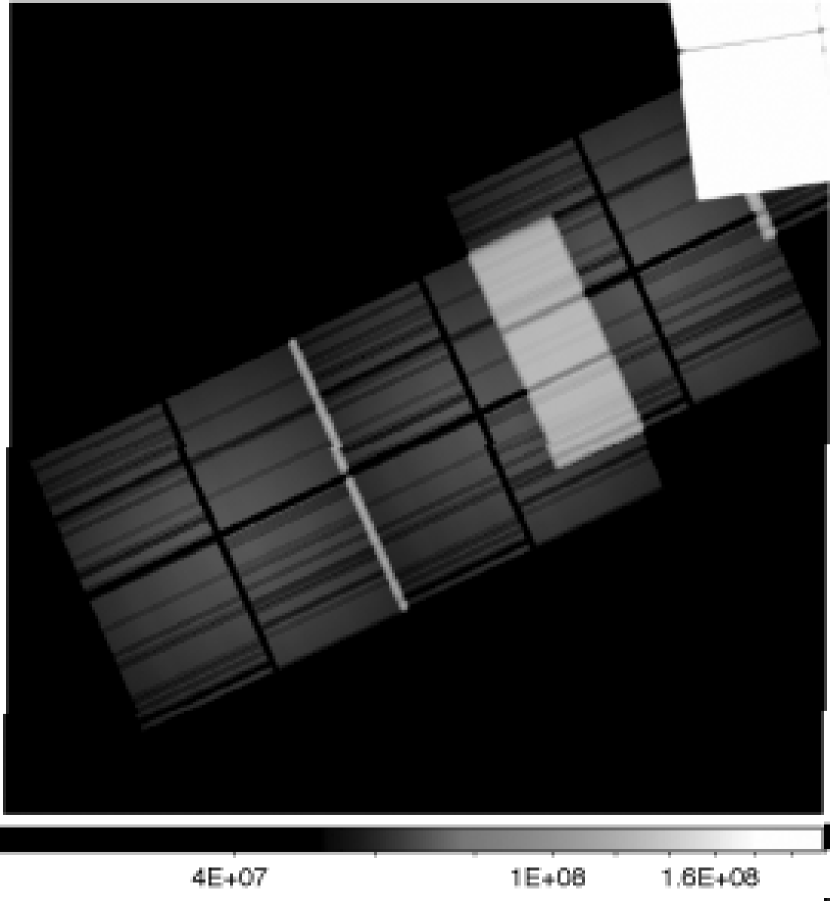
The resulting RMC source list contains 395 X-ray detections which we designate RMCX 1 through 395. We divide these into a primary list of 347 highly reliable sources (Table 1) and a secondary list of 48 tentative sources (Table 2) with likelihood of being spurious background fluctuations based on Poisson statistics. This approach has been adopted in our previous papers on Chandra observations of star forming regions (e.g. Townsley et al., 2006; Wang et al., 2007; Broos et al., 2007); it allows the reader to evaluate the validity of faint sources individually. Table 1 and Table 2 have a format that is identical to Tables 1 and 2 in Paper I. A Chandra mosaic of the RMC region (0.5-8 keV) overlaid with source extraction regions (calculated with AE) is shown in Figure 2. The image here is shown at reduced resolution (2″ per pixel).
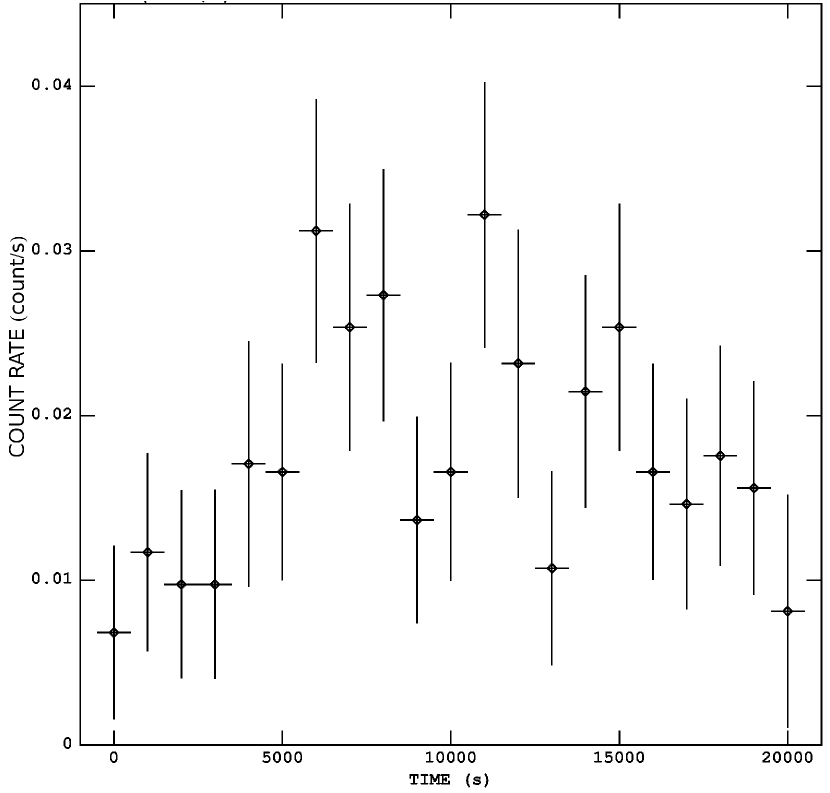
During the ks observations, eleven sources display significant variability (, shown in column 15 of Tables 1 and 2, where is the significance of the statistic for 1-sided Kolmogorov-Smirnov test comparing a uniform count rate model to the distribution of source event time stamps). These are associated with magnetic reconnection flares which are responsible for most of PMS X-ray emission (Feigelson et al., 2007). Only one of the variable sources (source #119) has more than 100 net counts due to the short exposure; its light curve shows a slow 3-fold rise in emission over 2 hours followed by a decay over the subsequent 3 hours. Such slow-rise X-ray flares are not infrequently seen from PMS stars (Getman et al., 2008b).
Spectral analysis results for 164 sources with photometric significance Signif (Signif defined as the net counts value divided by the error on that value; see Table 1 footnote) are presented in Table 3. The table entries are described in the table footnotes. ACIS spectral distributions were fit to thermal plasma models (“apec;”, Smith et al., 2001) with interstellar soft X-ray absorption (“wabs;”, Morrison & McCammon, 1983) convolved with the telescope mirror and detector spectral response. Best-fit absorbing column densities range from negligible to cm-2, equivalent to a visual absorption of 200 mag (Vuong et al., 2003). Temperatures range from keV to the hardest measurable by ACIS which we truncate at keV. The range of total band ( keV) absorption corrected luminosities () derived from spectral modeling is ergs s-1. Assuming a 2 keV plasma temperature and an average mag visual extinction ( cm-2), the faintest on-axis detection in Table 2 corresponds to a limiting luminosity of ergs s-1. Note however that the patchy extinction throughout our fields will change the limiting sensitivity of the observation somewhat (§ 2.3). The brightest source in the field is source #119 with 369 ACIS counts in the 20 ks exposure. This count rate is not high enough to cause photon pile-up in the detector.
2.2 Identification of Stellar Counterparts
The X-ray sources, which are generally located with precision better than 0.5″ in the 2MASS/Hipparcos reference frame, are associated with counterparts at other wavelengths to establish their stellar properties. Optical coverage of the RMC in the literature is poor because of the high visual extinction towards the molecular cloud and the contamination by foreground stars. Few spectral types are measured. We therefore use optical and IR photometric catalogs including: Whole-Sky USNO-B1.0 Catalog (Monet et al., 2003, hereafter USNO); 2MASS All-Sky Catalog of Point Sources (Cutri et al., 2003, 2MASS); and the University of Florida FLAMINGOS Survey of Giant Molecular Clouds (PI: E. Lada). The FLAMINGOS observations of the Rosette Complex fields and IR data reduction are described by Román-Zúñiga (2006) and REFL08. We have also associated our sources with the coordinates of 50,000 stars seen in IRAC 3.6m images (Poulton et al. 2008, private communication). Positional coincidence criteria are used to associate ACIS X-ray sources with optical and NIR (ONIR) sources as described in the Appendix of Broos et al. (2007) 222Software implementing the matching algorithm is available in the TARA package at http://www.astro.psu.edu/xray/docs/TARA/. .
Associations between ACIS sources and ONIR sources are reported in Table 4. Of the 395 ACIS sources in the RMC, 299 (76%) have an ONIR counterpart identified. magnitudes from FLAMINGOS photometry are reported if available; we adopt 2MASS photometry for six bright stars (RMCX #25, 65, 164, 185, 209, 342) that are saturated in FLAMINGOS ( mag, Román-Zúñiga 2006). NIR counterparts of 279 ACIS sources have measurements in all three bands. The SIMBAD and VizieR catalog services were examined for complementary information; these results are reported in the table footnotes. Useful sources include the TASS Mark IV Photometric Survey of the Northern Sky (Droege et al., 2006) and two large optical surveys of the Rosette (Massey et al., 1995; Berghöfer & Christian, 2002) that partly covered our Chandra fields. Source #65 is too bright () for its spectral type (G0) at the RMC’s distance, leading to its classification as a foreground star. The rest of the stars with known spectral types show colors and magnitudes consistent with being intermediate- to high-mass cloud members.
We have examined the spatial distribution of the 96 X-ray sources that do not have associated ONIR counterparts in the context of Digital Sky Survey optical plates and CO emission maps (Heyer et al., 2006). Over 20 of these sources are located in the brightest nebulosity of the photodissociation region (PDR) of the Rosette Nebula, where source detection becomes extremely difficult at ONIR wavelengths. We suspect that most of these are cloud members. About 50 others are concentrated in regions where the dense molecular cores are located and show X-rays with harder median energy (). Most of these are probably heavily obscured new members of the embedded clusters, although a few may be extragalactic sources coincidentally lying behind the embedded clusters.
Only a small fraction of the X-ray sources, perhaps 10 of the 96 that do not have ONIR counterparts, seem to be randomly distributed across the fields with a surface density consistent with the extragalactic background of active galactic nuclei. Extragalactic contaminants are seen in all fields of young stellar clusters (e.g., Getman et al., 2006; Wang et al., 2007; Broos et al., 2007). Considering the contamination analysis of these earlier studies, the absorption by the RMC gas, and the short 20 ks exposures considered here, we estimate a contamination of 3% from extragalactic sources and % from older Galactic field star populations among the 395 ACIS sources, and even fewer among the sources with ONIR counterparts listed in Table 4.
2.3 Limiting sensitivity and completeness
The sensitivity limits of our X-ray observations are spatially uneven due to the patchy absorption in the RMC and to degraded point spread function (PSF) of the Chandra mirrors at large off-axis angles. Based on previous experience with wavelet source detection and the ACIS Extract software (Getman et al., 2006; Wang et al., 2007; Broos et al., 2007), we estimate that the far-off-axis sensitivity is approximately 2 times worse than on-axis (see § 4.3). Sources with 8 or more net counts would be detected anywhere in the three fields; over 60% of the sources in Table 1 lie in this complete regime.
The typical extinction is in the RMC regions with molecular concentrations and in less obscured regions (REFL08). Assuming a keV thermal plasma as the spectral model of a typical PMS star (Preibisch et al., 2005), the absorption-corrected luminosity limit of 8 ACIS counts in 20 ks in the hard band (2–8 keV) is erg s-1 in obscured regions and erg s-1 in less obscured regions of the RMC (the observed luminosity in the 0.5–8 keV band erg s-1 and erg s-1, respectively). Due to the strong empirical correlation between and PMS stellar mass (Telleschi et al., 2007), these luminosity limits correspond to a mass limit around .
Adopting the X-ray luminosity function (XLF) of the Chandra Orion Ultradeep Project (COUP) observation of the Orion Nebula Cluster as a calibrator for other PMS stellar populations, we can estimate the completeness of our RMC observations with respect to the full underlying PMS population. Using the XLF of Feigelson et al. (2005), we find that the RMC observations probe % (%) of the PMS population down to the stellar limit of M⊙ in the obscured (lightly obscured) regions of the RMC. These fractions are adopted to obtain estimates of the total stellar populations in various RMC structures below (§ 4 and Table 6).
3 X-rays from Previously Studied Stars
3.1 The O7 Star HD 46485
The only previously known O star in our fields, HD 46485 (=BD+04∘1318, O7V; Walborn, 1973; Maíz-Apellániz et al., 2004) is detected with 310 counts in the 20 ks exposure (RMCX #164). A single-temperature thermal plasma model gives an acceptable fit to its X-ray spectrum with keV and a low absorbing column cm-2. The fit can be improved with a two-temperature thermal plasma model (Figure 4), with a soft component ( keV), a second harder component ( keV), and an absorbing column of cm-2 (). The soft plasma and the derived X-ray luminosity, erg s-1, are similar to the NGC 2244 O stars (e.g., HD 46223, HD 46202; Paper I), consistent with being associated with instabilities in the radiatively accelerated wind. Note that some O stars exhibit a much harder X-ray component; for example, Ori C (O7V) ionizing the Orion Nebula has a component with keV (e.g. Gagné et al., 2005). This hard component is attributed to a magnetically channeled wind shock (MCWS). These differences in the X-ray properties of O stars of similar spectral types may be attributed to the various magnetic field strength in different stars; in this case, HD 46485 likely does not have a strong field. Measurements of magnetic properties of massive stars (e.g., Alecian et al., 2008; Petit et al., 2008) will be able to further evaluate the link between X-ray emission and the presence of magnetic fields in OB stars.
HD 46485 does not appear to have any relationship to the embedded clusters of the RMC. It is much less absorbed and lies outside all of the clusters discussed here or in the infrared literature. The reported proper motion of HD 46485 is small ( = -0.26 mas/yr, = -1.55 mas/yr, The HIPPARCOS Catalogue; Perryman et al., 1997), and the radial velocity is km s-1 (Evans, 1967). It might be a runaway O star from NGC 2244, or a somewhat older member of the open clusters in the larger OB association (Perez, 1991).
3.2 RMCX #89 = IRAS 06306+0437: A new massive protostar
This star in PL97’s cluster #2 (PL2) exhibits unusually red colors in the NIR, with and . These colors imply both unusually strong reddening () and a strong -band excess. It is also a bright MSX point source (MSX6C G206.7804-01.9395). The source has only 21 net counts but the X-ray properties are all consistent with a highly absorbed source: the median photon energy is very hard (4.6 keV) which, based on the Orion Nebula calibration between and (Feigelson et al., 2005), corresponds to absorption cm-2 or . The observed X-ray luminosity in the hard band ( keV) is erg s-1. While not impossibly high for a lower mass PMS star, this is at the top % of the PMS X-ray luminosity function (Feigelson et al., 2005). Among protostars, only one of several dozen Class I in the Orion Nebula region flares up to a comparable X-ray level (e.g., COUP #554 in OMC 1S, Grosso et al., 2005; Prisinzano et al., 2008).
Although the evolutionary stage of PMS stars cannot be directly established from hard-band X-ray properties because magnetic reconnection flares are present throughout the Class I-III phases, our past experience suggests that sources with absorption exceeding cm-2 are protostars where most of the absorption arises in local envelopes rather than the larger-scale molecular cloud (Getman et al., 2006). A protostellar classification is also indicated by the rapidly rising flux (high m flux ratio) and roughly flat m spectral energy distribution measured with the and satellites (Poulton et al., 2008).
RMCX #89 = IRAS 06306+0437 is also a massive system. With a dereddened magnitude around , it has a bolometric luminosity associated with an early B or late O star (see the NIR color magnitude diagram in Paper I). As O stars generally have softer X-ray spectra than PMS stars, the correction from hard band to the total keV band is larger; for the O6-O7 star C Ori in the Orion Nebula Cluster, this correction is a factor of . If we assume the same correction, the estimated absorption-corrected total band X-ray luminosity is erg s-1 for RMCX #89. This source is similar to a candidate massive YSO found in the observation of the Pismis 24 cluster in the NGC 6357 star forming complex (Wang et al., 2007). In fact, IRAS 06306+0437 is a known water maser source (Brand et al., 1994). It was included in a CS(2-1) survey of IRAS sources with far-IR color characteristics of ultra compact HII regions, but not detected (Bronfman et al., 1996). Wu et al. (2006) observed IRAS 06306+0437 among other water masers not associated with known HII regions or low mass YSOs and detected NH3(1,1) emission coincident with the IRAS/MSX infrared peak. They suggested the ammonia core may be a high mass protostellar candidate.
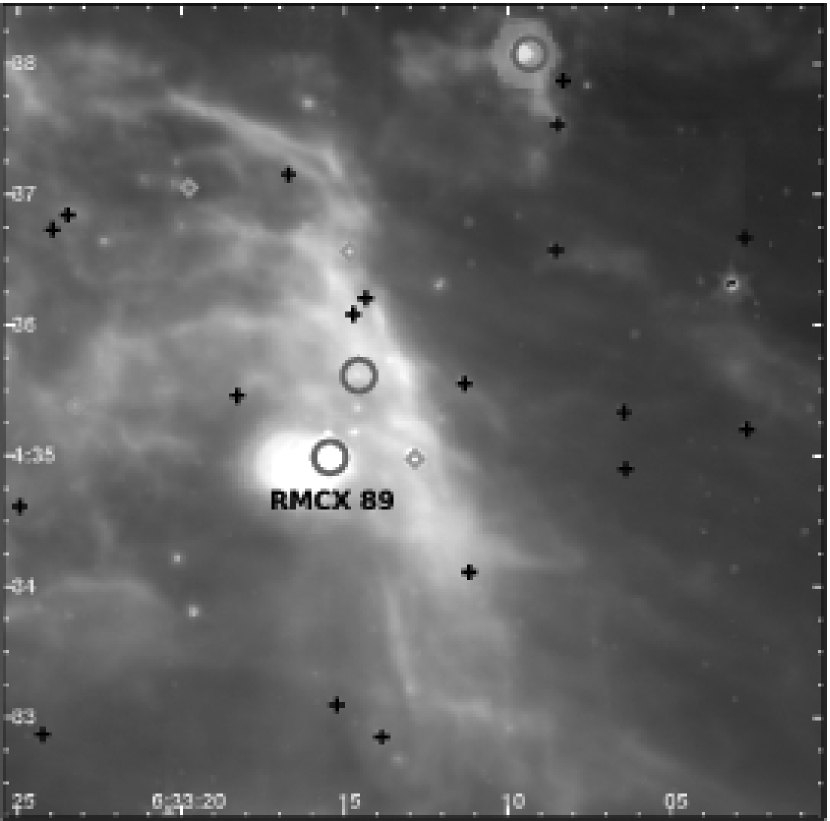
The catalog notes that the MIR source is extended. We examine the dusty environment of IRAS 06306+0437 in Figure 5 which we extracted from the archived IRAC and MIPS data from the Spitzer satellite. The star lies within a bright region of heated dust surrounded by an elongated complex of infrared filaments extending over several arcminutes which is probably associated with the larger photodissociation region of the Rosette Nebula. A smaller-scale view of the dust emission around IRAS 06306+0437 is shown by Poulton et al. (2008). They note that this star does not have an accompanying concentration of young Class I or II stellar companions; i.e. that PL 2 is not a true stellar cluster. Figure 5 shows 25 X-ray selected stars within 1 pc of RMCX #89. We have classified these as Class I, II or III based on a preliminary examination of their NIR colors, including two other Class I protostars, three Class II systems, and Class III systems. This is consistent with the concentration of NIR -band excess stars found in PL 2 (Figure 7 in REFL08). Another candidate protostar, RMCX #72 (), is close to RMCX #89, lying to the east in a secondary dust condensation. This further indicates the youth of this region.
We thus conclude that RMCX #89 is a massive proto-O star lying in a sparse cluster of PMS stars, most of which are older Class III systems. The implied age offset that the central O star is younger than the cluster of lower-mass PMS stars is similar to that recently inferred from study of the embedded W3 Main cluster (Feigelson & Townsley, 2008).
3.3 Intermediate-mass X-ray Stars
Block et al. (1993) list the five brightest -band sources in the PL4 region. The two bright stars BG/IRS1 and BG/IRS2 (acronyms used in Block et al. 1993 = BG) form a close pair whose spectra show Br and are likely Herbig Ae/Be (HAeBe) stars (Hanson et al., 1993). RMCX #209 and #207 are matched to BG/IRS2 and BG/IRS4, respectively. Both have 50 counts and the spectral fits yield keV with absorption cm-2 for RMCX #207 and cm-2 for RMCX #209. This absorption column () agrees with the mag derived by Hanson et al. (1993). The absorption corrected luminosities are erg s-1. Their hard X-ray spectra are consistent with the high X-ray temperatures (20 MK) seen in X-ray surveys of HAeBe stars (Hamaguchi et al., 2005; Stelzer et al., 2006). RMCX #210 coincides with BG/IRS 5 but has too few counts for spectral fitting.
The brightest X-ray source in our fields is RMCX #119 with 369 ACIS counts. The X-ray spectrum can be roughly fit with a standard two-temperature thermal plasma model but there seems to be some abundance anomaly around 1 keV. The derived X-ray luminosity is erg s-1, too high for most lower-mass PMS stars but consistent with the range of HAeBe systems. The stellar counterpart is bright, with , and was found not to have strong H emission in a follow-up study of sources in the Rosette region (Berghöfer & Christian, 2002). Its location in the NIR color-magnitude diagram indicates an intermediate mass star, although possibly with weak or absent accretion as suggested by the weak H emission (Calvet et al., 2000).
3.4 Protostellar sources of Herbig-Haro outflows
Five features of excited gas seen in the optical band [SII] survey by Ybarra & Phelps (2004) lie in our field. These are probably Herbig-Haro outflows from protostars. We have carefully examined the X-ray fields in the vicinity of these sources. In a region 6′ southwest of PL 2, the X-ray emitting star RMCX #51 is found near the extended [SII] feature RMC-F. Its IR counterpart is a heavily reddened star with , which has no significant -band excess. This star may be responsible for the [SII] emission feature.
RMC-H is an arc-shaped feature of excited gas outlining a globule of gas northwest of PL 2 with a possible HH outflow originating in the globule. Three X-ray sources are seen coincidently tracing the edge of the globule. One of them is the Class I protostar RMCX #58 which may be powering the jet-like outflow.
Ybarra & Phelps (2004) suggests that RMC-L is an HH outflow driven by a star in PL 4 associated with IRAS 06314+0427. In this context, the X-ray detected Class I protostar RMCX #315 may be the exciting source as it lies eastwards on the axis of symmetry of the bow-shock feature. The 3.5 pc separation between the star and shock is rather large, but comparable large-scale collimated flows have been detected in other star forming regions (e.g., HH80/81, pc long; Marti et al. 1993). Other [SII] features such as RMC-E, RMC-G, and RMC-M do not have an obvious correlation with our X-ray sources.
4 Stellar Clusters in the Chandra Population
Visual examination of the spatial distribution of X-ray sources in Figure 2 shows a non-random clustering. This is also evident in the earlier presentation of the field shown in Figure 6a of TFM03. We identify the X-ray source concentrations, which can be considered to be ‘star clusters,’ using two methods in §4.1-4.2. The newly identified XA cluster is describe in §4.4 and the previously established embedded XB and XC clusters are discussed in §4.5. Tables 5-6 provide quantitative results.
4.1 Clusters from the Smoothed X-ray Source Distribution
Wang et al. (2007) and Broos et al. (2007) found that smoothed maps of the stellar distribution derived from source lists are effective in revealing the structure of young stellar clusters. For example, in M 17, the X-ray stellar density maps highlighted the region’s complex structure, including the compact NGC 6618 cluster, a triggered population along the edge of the HII region, several small embedded clusters, and a previously unknown subcluster. A similar approach applied to 2MASS star distributions revealed the NGC 2237 subcluster on the western side of the Rosette Nebula (Li, 2005). Compared to infrared maps, X-ray maps are less affected by contamination from Galactic field stars and show richer populations than disky IR-excess samples.
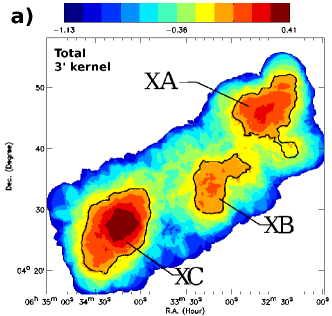
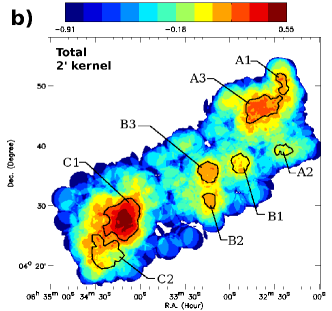
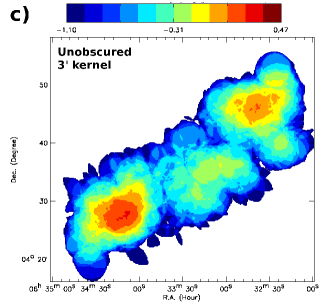
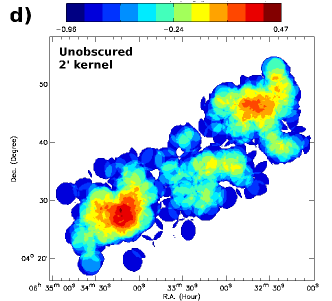
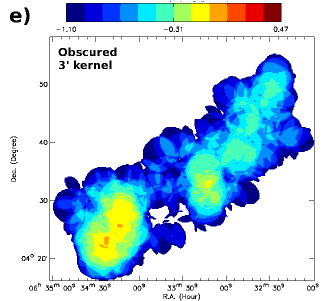
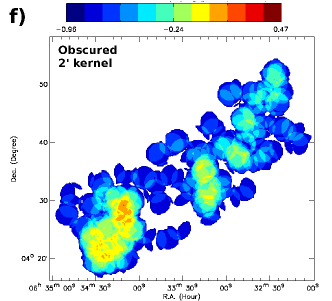
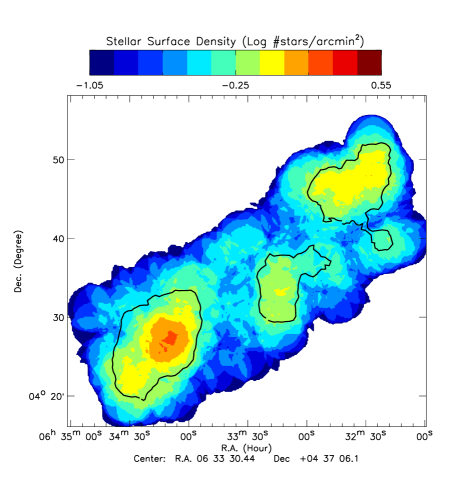
Smoothed maps of the sources in the RMC are shown in Figure 6333Note that each star has the same weight in these maps, so they do not accurately reflect the distribution of X-ray emission. A smoothed map of the X-ray emission is shown by TFM03.. The three ACIS fields have closely matched 20 ks exposures, only a small sensitivity bias is present between the on-axis and off-axis areas of each field, and contamination by extraneous sources is small (§2.2). The three rows of panels in Figure 6 show the total source sample, lightly obscured sources with keV, and heavily obscured sources with keV. The left and right panels show maps with 3′ and 2′ radius (1.2 and 0.8 pc) smoothing kernels, respectively.
Three large-scale structures are seen as overdensities in the total sample, irrespective of the adopted smoothing kernel size. We define these regions as XA, XB, and XC and trace their outline from a contour of the 3′ kernel. We note seven small-scale overdensities within the three major structures in the 2′ map of the total population. We label these XA1-XA3, XB1-XB3, and XC1. In addition, a distinct substructure of heavily obscured stars extending southward from XC1 is seen in panel Figure 6 which we call XC2. Note that the substructures are defined from smoothed contours on different maps and are not contiguous; the star totals in the main structures are thus larger than the sum of the stars in the substructures. We label stars lying outside all overdensities “distributed” stars in the RMC.
While the regions are defined based on subjectively chosen surface density contours, we are confident that these structures are not artifacts caused by the slightly degraded X-ray sensitivities at large off-axis angles on the ACIS-I CCDs. The overdensities are not located at the centers of the fields (where the telescope response is maximized) and represent a factor of difference in stellar density which cannot be solely attributed to the instrumental sensitivity gradients.
4.2 Clusters from the Nearest Neighbors Method
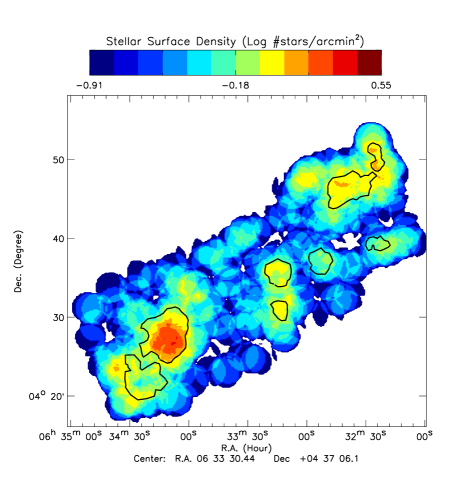
A second technique for identifying stellar clusters is analysis of the distribution of nearest neighbors (Casertano & Hut, 1985; Diggle, 2003). This was used by REFL08 to establish the content of the seven PL97 clusters in the catalog of the RMC. We apply the same nearest neighbor method used by REFL08 based on the local density derived from the distances to the 10 nearest neighbors to each star.
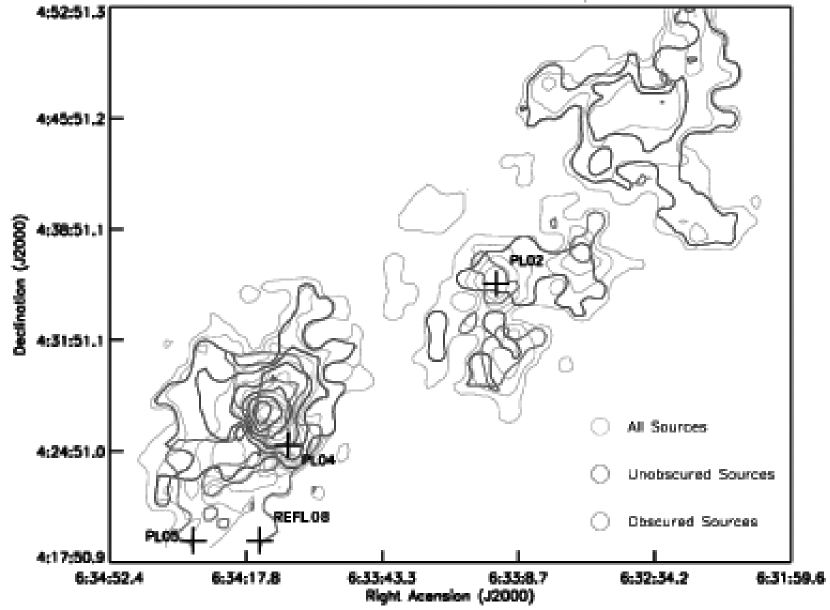
Contours of the resulting nearest neighbor maps for our Chandra RMC observations are shown in Figure 7 for the total, unobscured, and obscured populations. The locations and morphologies of the resulting concentrations closely resemble the structures that we defined using the smoothed surface density maps for X-ray sources. This indicates the robustness of the inferred clustering irrespective of the methodology used to smooth the star distribution.
4.3 Evaluating the Sensitivity Across the Mosaic
The maps shown in Figure 6 used all detected X-ray sources. However, the sensitivity across the field is not uniform; there is a bias towards detecting faint sources in the area close to the individual field aim points and in the overlapping regions with deeper exposure. It is possible that this sensitivity variations can create spurious structure in an intrinsically smooth distribution of sources. We evaluate the importance of this effect by creating a smoothed source map similar to Figure 6 which removes the sensitivity degradation due to telescope vignetting, effective exposure and background across the fields.
Following Lehmer et al. (2005) and Luo et al. (2008), we estimate the sensitivity across the X-ray imaging mosaic assuming a Poisson model. The resulting relation can be approximately represented by , where is the required number of counts for a source required to be detected, and is the background counts measured in a local region. The coefficients are obtained by constructing a lower envelope in the plot of Net Full counts against Bkgd Full counts tabulated in Table 1. We then construct a sensitivity map across the mosaic by dividing a smoothed map of by the telescope exposure maps in units of cm2 s (shown in Figure 8, see also Appendix of TFM03). The resulting sensitivity map is typically counts cm-2 s-1 near the aimpoint and near the edge of a typical 20 ks field. It reaches in a small region around subcluster XA1 where the field overlaps the much deeper 100 ks exposure of NGC 2244 discussed in Paper I.
This corresponds to a 8 counts limit across the 20 ks exposures and 40 counts in the overlapping region around XA1. Applying this spatially varying counts threshold removes the sensitivity bias from telescope degradation and overlapping fields, and provides a complete sub-sample of our X-ray detections. This procedure removes 30% of the weaker sources in Table 1 (the remaining sources with number of counts above the detection threshold are marked in Table 1, see table footnote). The smoothed stellar surface density map of this reduced, spatially uniform sample is shown in Figure 9.
The three major X-ray clusters, XA, XB, and XC, are present as prominent overdensities. Some substructures are less significant than in the full sample map; XA2 and XB1 are weakest with densities times above the background level. Additional possible substructures emerge: an enhancement at (, ) east of XA3 and at (, ) northwest of XC1. The reality of these features must be confirmed with deeper X-ray observations.
4.4 Identification of the new XA cluster
The three main stellar enhancements and seven secondary enhancements are listed in Table 5 with approximate sizes. Most are around 3′ or 1.2 pc in extent. Four of the seven substructures XB2, XB3, XC1, and XC2 are associated with clusters identified from and images (PL97, RL08, Poulton et al. 2008). Figure 12 shows the outline of the three main structures on the molecular CO map of Heyer et al. (2006). It shows that these same four substructures–XB2, XB3, XC1, and XC2–are associated with dense molecular regions.
X-ray cluster XA, on the other hand, lies in the evacuated region on the eastern side of the H-bright Rosette PDR. Located in the north-west side of the north-westernmost ACIS field where molecular material has been removed by the expanding HII region, its stars are less obscured compared to the XB and XC concentrations embedded in the molecular cloud. This is shown in columns of Table 6: 30% of XA stars have keV, corresponding to absorption cm-2 or , compared to % in concentrations XB and XC.
Most XA stars are concentrated in subcluster XA3 centered at (, ) = (06:32:38,+04:46:18). XA1 and XA2 represent small extensions to the northwest and southwest, respectively. Sixty-one stars are in the XA X-ray sample. Scaling by the incompleteness factor for lightly obscured regions given in § 2.3, the estimated total stellar population in XA is 300 stars. This is about 15% of the total population estimated for the central NGC 2244 cluster using the same XLF-based method (2000; Paper I).
The lightly absorbed XA cluster was not clearly identified in previous IR surveys of the cloud. The location of substructure XA1 is separated by ″ from IRAS 06297+0453. However a close inspection of IRAS, DSS, and 2MASS images led us to conclude that this is a spatial coincidence: IRAS 06297+0453 is associated with the very bright foreground K0V star BD +04 1304 (, ) and does not belong to the RMC. The XA cluster was not covered in the earlier PL97 survey. Six stars with -band excesses are present in the FLAMINGOS survey (Table 6), insufficient to highlight a cluster using the 10th-nearest neighbor method. However, it does appear as an enhancement in the smoothed surface density map of all 2MASS sources shown by Li (2005, Figures 1a and 2a), appearing as a stellar enhancement between XB and the main NGC 2244 cluster. A group of 32 stars with disky MIR spectral energy distributions is found within our XA contour in the IRAC/MIPS, but again these were not identified as a distinct cluster by Poulton et al. (2008, see their Figures 6b). Rather they appear as an eastward extension of the central NGC 2244 cluster. The cluster is more spatially distinct from the main cluster in the ACIS X-ray mosaic of 20ks pointings towards NGC 2244 and RMC (see Figure 6a in TFM03), which is not sensitive to obscuration.
The reason that the XA cluster emerges more clearly in our X-ray survey than in infrared surveys is probably due to presence of nebular contamination. It lies on a bright ridge of enhanced H Brackett- and spatially variable PAH emission (Figures 1 and 4 of Poulton et al., 2008). These contaminants limit the detection or photometric accuracy of stars in certain infrared bands which then inhibits identification of disk emission from multiband spectral energy distributions.
4.5 The Embedded Clusters XB and XC
As noted above and in Table 5, the XB and XC concentrations of X-ray stars shown in Figures 6 and 7 correspond to embedded clusters established from , 2MASS, FLAMINGOS, and studies. Their stellar populations inferred from NIR studies have been most thoroughly described by RL08. The XB and XC clusters have higher fractions of obscured stars than the XA cluster (46% and 41% 30%; Table 6). This, combined with their spatial relationship to dense molecular structures (Figure 12) confirms that they are at least partly embedded in cloud material.
The main advantage of our X-ray survey is that disk-free (PMS Class III) members are readily detected, subject only to the sensitivity limitations given in § 2.3. In most infrared surveys, Class III systems cannot be readily distinguished from the strong contamination of Galactic field stars. Infrared surveys are thus often limited to counting disky (PMS Class I and II) systems. The X-ray samples are thus usually larger than the IR-excess samples, and provide a less biased way to estimate disk fractions which is relevant to stellar ages.
The XB cluster is the sparsest of the three X-ray concentrations with 52 detected stars and an estimated total population of 200 stars (Table 6). It has an “L”-shaped structure with three subcomponents of similar ( pc) sizes. Subcluster XB2 associated with cluster C (Poulton et al., 2008) appears more embedded than the other subclusters. Subcluster XB3 is associated with NIR cluster PL 2 and MIR source IRAS 06306+0437. As discussed in § 3.2 above, this structure is dominated by the embedded massive star, RMCX #89. Both XB1 and XB2 contain bright MSX mid-IR sources (see footnotes to Table 4).
The XC cluster is the richest of the three main X-ray structures in the cloud with 160 detected stars. In the principal concentration of stars, XC1, roughly 2/3 are lightly obscured and 1/3 are heavily obscured. This rich cluster was first noted in -band imaging by Block et al. (1993), studied spectroscopically in Hanson et al. (1993), and noted as a NIR cluster by PL97, Bica et al. (2003), and Li & Smith (2005). The sparser XC2 component is only evident in the stellar surface density maps for the obscured population (Figure 6 and ) indicating it is deeply embedded. This region also appears much darker in the DSS optical image. It appears as a curved southern extension of the rich XC1 cluster in the X-ray maps, and is associated with the NIR clusters PL 5, REFL 8, and the cluster E (Table 5). The stellar structure may extend beyond the southeastern edge of our ACIS field. In contrast to XC1, only 1/4 of the stars in XC2 are lightly obscured as measured by the indicator of soft X-ray absorption. XC2 is thus the most deeply embedded stellar cluster in the RMC regions we examine here.
4.6 Evolutionary Stages of the Principal Clusters
X-ray properties cannot discriminate very young clusters, dominated by accreting Class I-II systems, from older clusters, dominated by non-accreting Class III systems. The reason for this is well-established: the X-ray luminosity function and flaring properties do not greatly change as low mass stars evolve from their Class I through III phases (e.g. Preibisch et al., 2005; Telleschi et al., 2007; Stelzer et al., 2007). X-ray selected samples are thus relatively unbiased with respect to age, and their ages can then be estimated from their rapidly evolving infrared properties. Here we focus on the high-quality photometry available from the FLAMINGOS survey (REFL08) for X-ray sources within the boundaries of clusters XA, XB, and XC presented above.
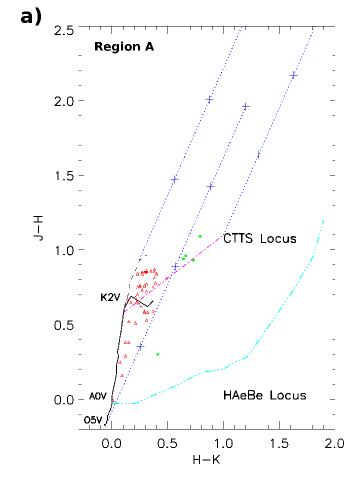
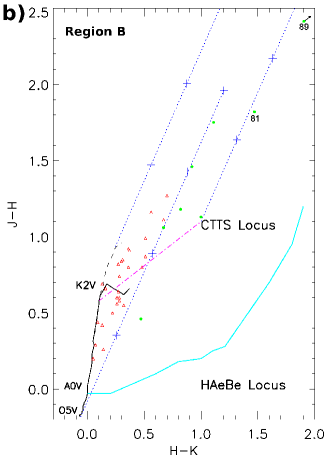
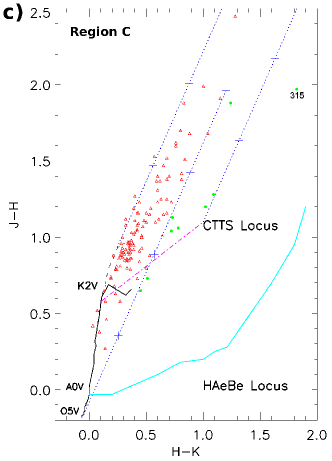
Figure 10 shows the vs. color-color diagrams for the three clusters. The region between the left two dashed lines is associated with Class III objects (diskless WTTS) reddened by interstellar extinction. To the right of this band are sources exhibiting significant -band excess; here we require based on FLAMINGOS photometric errors for the sources to be K-band excess stars. The region between the middle and right-most dashed lines is occupied by Class II objects (PMS stars with circumstellar accretion disks), and protostars still possessing thick envelopes (Class I objects) lie beyond the right-most dashed line. Star counts in various regions are summarized in the middle columns of Table 6.
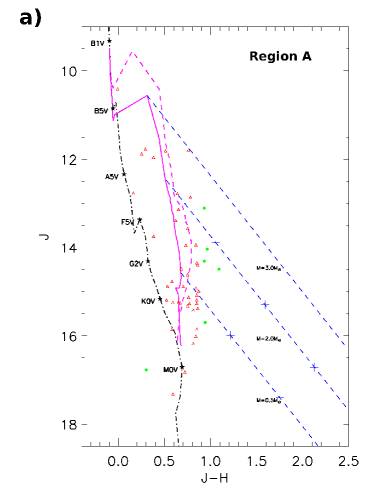
The colors of most sources in cluster XA are consistent with PMS stars with small reddening, , typical of stars in the central NGC 2244 cluster illuminating the Rosette Nebula (Paper I). A few Class II sources are present showing higher ; these may lie within XA or behind XA in the molecular cloud.
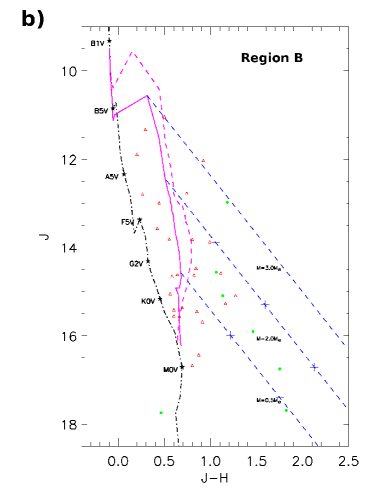
Sources in cluster XB show a wide range of absorptions; some sources are reddened with and the -excess sources are among the most reddened. This may suggest the XB subclusters are distributed along the line of sight, at different cloud depths. Three Class I sources are found in this region. Despite the smaller number of sources in region XB, it has more IR-excess sources than the more populous XA region. Subcluster XB1 has 11 detected X-ray stars with an inferred total population around 40 stars, but has no IR-excess systems. XB2 has more MIR-excess than NIR-excess stars, while XB3 has more NIR-excess than MIR-excess stars. We thus tentatively infer that the XB region is not homogeneous and coeval. Subcluster XB3, which includes RMCX #89 = IRAS 06306+0437 discussed in § 3.2, is clearly the youngest structure in the region as the presence of NIR excess in the stars indicates inner disks have not been cleared yet.
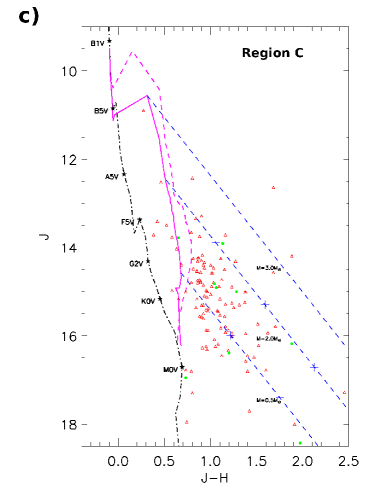
X-ray sources in cluster XC are mostly lightly obscured PMS stars with and a dozen heavily obscured sources with . The XC cluster is very populous in the X-ray map, and only 5-10% of these stars have infrared excesses in the NIR or MIR bands. This, together with the presence of only one very young system in Figure 12, indicates that the region is not dominated by active star formation today despite the presence of two sources resolved into several IR clusters (PL 4, PL 5, REFL 8 and ’s E). The very faint XC source RMCX #315 is associated with a faint NIR source with unusual colors, ; it is either a Class I system or a very heavily reddened Class II system. NIR vs. color-magnitude diagrams shown in Figure 11 provide an approximate range of the mass distribution and local absorptions for the same stars shown in Figure 10.
No candidate new OB stars appear in the RMC NIR color-magnitude diagram. This stands in marked contrast to studies of other prominent star forming regions where dozens of new obscured OB stars were identified by virtue of their X-ray emission. These include Westerlund 1 (Skinner et al., 2006), and RCW 38 (Wolk et al., 2006), NGC 6357 (Wang et al., 2007), RCW 108 (Wolk et al., 2008). There is no reason to believe that massive star formation is suppressed in the RMC; more likely the population of the individual embedded cluster is simply too small to contain massive stars as expected from the initial mass function.
We conclude that cluster XA, showing less absorption and very few IR-excess stars, appears older than clusters XB and XC. The latter structures are not unified, homogeneous clusters but rather collections of smaller stellar concentrations. Similar to the results of REFL08, we find no clear spatial pattern of cluster ages in this region. XC is the most populous and, with only % fraction of IR-excess sources and no more than one protostar, is not very young. Active star formation is strongest in subcluster XB2 with several protostars including the massive system RMCX #89 = IRAS 06306+0437.
4.7 Relationship to the Molecular Gas Distribution
Figure 12 shows the X-ray selected RMC stars, classified by evolutionary stage from the NIR color-color diagram (§ 4.6), superposed on contours representing 12CO emission (Heyer et al., 2006). The younger Class I and II sources are mostly seen around the CO molecular ridge near cluster XB and the molecular material near cluster XC. Class III stars appear more dispersed throughout the cloud and dominate the XA region where molecular material is no longer present. We can interpret this trend as reflecting the drifting of older Class III stars away from their birth sites (Feigelson, 1996). For example, with a characteristic transverse speed of 1 km s-1, a star would travel 1 pc (′) in 1 Myr. This is sufficient to disperse such stars originally formed in the clusters throughout the fields in a few Myrs, resulting in a “dispersed” population.
The relationship of cluster XA to molecular gas is clearly different than for clusters XB and XC. XA lies within the bright nebulosity of the Rosette HII region where most of the molecular materials are gone. This cluster of less embedded and older PMS stars (see § 4.6) is likely an early population triggered by the expansion of the HII region. Its similarity to NGC 2237, a similar lightly obscured cluster on the western side of the Rosette Nebula, will be discussed in our Paper III (Wang et al., in preparation). The overdensity of stars in XB, including the NIR PL 2 cluster, is situated on the ‘rim’ of molecular material adjacent to the expanding Rosette PDR. It includes XB2, the youngest subcluster in our examined portion of the RMC. This cluster, and possibly the similar PL 1 cluster located south-west of our fields in a molecular clump, are reasonably interpreted as triggered by the expanding shell of the NGC 2244 HII region. The molecular clumps are probably undergoing photoevaporation and will eventually become unobscured clusters like region XA.
Region XC contains the large and most extended population of embedded stars, including several infrared clusters. Its relationship to a dense molecular clump has been noted by Heyer et al. (2006) and REFL08. Our analysis above (§ 4.6) suggests that subcluster XC1 (PL 4) is partially emerging from the molecular core while XC2 is younger and still embedded. As discussed by REFL08 and Poulton et al. (2008), it is not clear that star formation here has been triggered by the expanding HII region.
Since the X-ray sample provides an estimate of the total stellar population of each cluster, we can roughly estimate the star formation efficiency (SFE) of molecular material in the RMC. Williams et al. (1995) estimate the molecular masses of 70 clumps in the RMC using an empirical CO-to-H2 ratio molecules cm-2 (K km s-1)-1. Mass estimates are made assuming either local thermodynamic equilibrium or gravitational binding of gas motions within clumps. If we assume an average stellar mass of 0.4 M⊙ (Kroupa, 2002), the SFE is approximately 15% in region XB and 11% in region XC, adopting the LTE clump masses. If the gravitational clump masses in Williams et al. (1995) are used, the SFE becomes 24% and 32% in XB and XC, respectively. These values are similar to the SFEs inferred for nearby embedded rich clusters: NGC 2071 (SFE12%) and NGC 2024 (33%) in the Orion Molecular Cloud (Lada et al., 1991), Oph (9%; Wilking & Lada, 1983), and Mon R2 (25%; Wolf et al., 1990). As noted by RL08, the XC (PL 4) cluster lies at the high end of SFEs; this may indicate that on-going star formation has significantly depleted gas in the region.
4.8 Clustered Distributed Star Formation
Infrared observations have established that % of stars in GMCs form in embedded clusters (Lada & Lada, 2003). Unclustered PMS stars have been established mainly in the Orion Molecular Cloud complex, but even there it has been difficult to quantify their population and star formation processes (Strom et al., 1993; Allen, 1996; Carpenter, 2000). Allen et al. (2007) present new survey results from Spitzer maps of nearby star forming clouds, and many show a significant distributed population. Distributed star formation in more distant clouds like the RMC is largely unstudied due to the heavy contamination from Galactic field stars outside of dense clusters. Modern astrophysical models of star formation in GMCs suggests that individual stars may commonly form asynchronously in supersonically turbulent cloud clumps (Mac Low & Klessen, 2004).
Because our X-ray identified young stellar population suffers little contamination, we are able to examine the fraction of stars that are formed both in clusters and at low stellar densities in the RMC. The total number of sources in the three fields is 553, of which 303 lie within the contours we use to define clusters XA, XB, and XC (Table 6). Among the 250 stars distributed outside the clusters, at most 10% of the total detections could be Galactic and extragalactic contaminants given the short exposure time and the presence of the molecular cloud (§ 2.2). This implies that 35% of stars could be formed in a distributed fashion throughout the RMC region, consistent with estimates from infrared studies (e.g. Carpenter, 2000; Lada & Lada, 2003). After correcting the sensitivity variation across the fields (§ 4.3), the fraction of distributed stars is 45%, which implies that clustered star formation would then be the governing mechanism in the RMC but distributed star formation is rather important.
However, further interpretation of this fraction should proceed with caution. There are at least three sources of complexity here. First, our definition of cluster boundaries based on smoothed stellar density maps (Figure 6) is arbitrary, which are about 0.8 stars arcmin-2 for the X-ray-sampled stellar density. In comparison, in REFL08 the cluster boundaries are defined by 0.2 stars arcmin-2 contour levels in the nearest neighbor density map of IR-excess sources. They find that 60% stars in the complex are in clusters. The clustering fraction reaches 86% if only the stars within the molecular cloud are considered. Besides the differences in the field coverage of the X-ray and IR surveys (see also § 5.1), we could get different distributed fractions with different, reasonable choices of cluster boundaries.
Second, a significant number of lower mass PMS stars ( M⊙) is missing from our survey due to short X-ray exposures (§ 2.3). While there may be no preference for lower-mass stars to be clustered or distributed, it is possible that higher-mass stars preferentially form in denser clusters from primordial mass segregation (e.g., Bonnell & Davies, 1998).
Third, the distributed stars may have been born in a clustered environment but have moved into a wider region. Numerical simulations show that the formation process of a cluster of stars is highly dynamic and chaotic; stellar encounters violently eject some of the young stars from multiple systems (Bate et al., 2003). Sparse clusters in particular can lose of their stars over a few Myrs. Thus the observed distributed populations may not have formed in situ.
5 Discussion
5.1 Comparing X-ray and infrared surveys
An underlying theme to this and similar studies concerns the relationships between X-ray and infrared surveys of star forming molecular clouds to uncover young stellar populations. Each as advantages and disadvantages. With instruments like FLAMINGOS, NIR surveys can cover large cloud areas to faint magnitudes. These catalogs can include virtually the entire cloud population at low to moderate extinctions (), but often suffer bad (often factors ) contamination by foreground and background field stars. Used by themselves, PMS samples are restricted to stars with NIR-bright inner disks, usually Class II and lightly obscured Class I systems. The resulting NIR-excess samples can constitute only a small fraction (%) of the total stellar populations which are often dominated by systems with cool or absent disks. With space-based instruments like ’s IRAC, MIR surveys also cover large cloud areas with very high sensitivity and penetration to . As with NIR studies, MIR observations are dominated by field star populations and samples are restricted to MIR-excess systems. The NIR-excess stars are recovered and new subpopulations emerge: embedded Class I and some Class 0 systems, low luminosity PMS brown dwarf systems, and a few older systems with transitional MIR-excess disks (e.g., Bouwman et al., 2006; Furlan et al., 2007). Diskfree Class III members are catalogued but cannot be distinguished from contaminants.
X-ray surveys have very different characteristics because they trace magnetic reconnection flaring rather than stellar and disk bolometric emission. Older Galactic field stars with much lower flaring levels are nearly absent, and most extragalactic contaminants are readily removed by the absence of stellar counterparts. X-rays can penetrate but with reduced sensitivity. X-ray studies also give estimates of the total stellar populations, and measurements of absorption for each star individually. While some Class I and II systems are recovered, the main advantage of X-ray observations is that disk-free Class III PMS members are readily detected, subject to the sensitivity limitations which correlate with stellar mass. Since many clusters are dominated by Class III stars, the X-ray populations can considerably exceed the NIR- or MIR-excess populations. A significant drawback is areal coverage: the telescope has a ′ field but suffers confusion in crowded fields, while the Chandra X-ray Observatory has a 17′ field of view with subarcsecond resolution. This limitation can be somewhat mitigated with mosaics as described here. The combination of X-ray and infrared studies are more effective at uncovering PMS populations in molecular clouds than any one method. We find here that the X-ray samples are quite free from contamination and can be 10 times richer than the NIR- or MIR-excess samples (Table 6). This greatly assists in tracing the spatial structure of star formation in the cloud. Subsequent infrared photometry then gives the evolutionary classification, absorption and approximate mass of each X-ray-selected star without bias towards luminous disks (Figures 10-11).
5.2 RMC Young Stellar Clusters
There is good agreement between our X-ray survey and REFL08 NIR survey (and other surveys). Taking this combined X-ray/infrared approach, we emerge with a number of results on the PMS population in the portion of the RMC examined with . First, we confirm past findings that star formation is not spatially uniform in the cloud, and we estimate that about 1/3 of the stars lie in unclustered environments (§ 4.8). This supports a large body of infrared-based survey work giving similar results in other clouds (Lada & Lada, 2003).
Second, we estimate the total population in the examined portion of the cloud to be about 1700 stars down to the substellar limit (Table 6). This estimate is based on an extrapolation of the empirical PMS -mass correlation (Telleschi et al., 2007) and knowledge of our X-ray sensitivity limits (§ 2.3). This is similar to the total population of stars found for the central NGC 2244 cluster which illuminates the Rosette Nebula HII region (Paper I).
Third, in contrast to the single concentrated OB cluster at the center of the Rosette Nebula, the RMC population is divided into three smaller clusters which themselves can be divided into sparse subclusters. Portions of X-ray clusters XB and XC are associated with well-established infrared clusters PL 2 and PL 4 (§ 4.5). The X-ray stellar distributions and absorptions provide more detail on these structures. XC is richest with a total population around 800 stars; subcluster XC2 is more deeply embedded with younger stars than XC1. Similarly in cluster XB, group XB2 has more protostars than XB1. These structures are thus inhomogeneous and not coeval. We caution that, our current identifications of structural components are from Figure 6 (and Figure 7) rather than Figure 9, as the addition of more sources is critically needed for substructure identification. While some substructures were cross-identified in the infrared (see Table 5), the weak substructures certainly require further confirmation regarding the details of their locations and sizes.
Subcluster XB2 = PL 2 is sparse but contains the highest-mass star in our examined region of the RMC, the heavily obscured, infrared-excess O9/B0 star RMCX #89 = IRAS 06306+0437 (§ 3.2). There is only one lower-mass protostar, RMCX #72, lies at a projected distance of 0.3 pc to RMCX #89. The absence of a substantial cluster surrounding this massive protostar has interesting implications for star formation at the edge of HII regions where triggering may be active. The system cannot realistically be dynamically ejected from a more crowded region, as it is still embedded in its dense dusty envelope. One possibility is that the massive star formed in isolation. We recall that HD 46223, one of the two O4 stars in the unobscured NGC 2244 cluster lies in a puzzling location near the southeast boundary of the nebula and, based on our study, has no lower mass companions (Paper I). IRAS 06306+0437 may be like HD 46223 seen at an earlier phase. Another possibility is that the massive star has formed before (except for RMCX #72) an accompanying cluster of lower mass stars. If this scenario applies, the star formation sequence is opposite to the one Feigelson & Townsley (2008) inferred for the embedded W3 Main clusters, where the OB stars appeared to have formed after, not before, an extended cluster of lower-mass PMS stars.
While it is reasonable that the density of obscured X-ray sources decreases significantly towards the HII region ionized by the NGC 2244 cluster, it was surprising that the new lightly obscured cluster XA appeared in the X-ray survey in a region with no molecular material (§ 4.4). Infrared surveys likely missed this structure due to the paucity of infrared-excess stars and confusion by the bright PAH and atomic nebular emission, a stellar enhancement associated with XA can be discerned in 2MASS, FLAMINGOS, and stellar distributions. Its location and low fraction of IR-excess sources suggest that it may have formed through an early epoch of triggered star formation produced by the expanding Rosette Nebula HII region. It appears similar to the small NGC 2237 cluster on the western side of the Rosette Nebula (Li, 2005, REFL08). A detailed study of NGC 2237 is presented in Paper III.
5.3 Star Formation Modes in the RMC
While Paper III will present a more comprehensive discussion of star formation in the Rosette complex, some immediate inferences can be made concerning the RMC structures presented here. NGC 2244 is the youngest OB cluster among the sub-associations (Blaauw, 1964). Cox et al. (1990) argue that sequential star formation extends into the RMC following the compression and triggering process described by Elmegreen & Lada (1977). However, neither REFL08, Poulton et al. (2008) nor the present study support this model in the XB and XC region of the RMC. No clear spatial sequence of stellar ages is seen. It is plausible, however, that cluster XA was triggered by the expanding Rosette HII region. At present it lies in (or, at least, projected upon) the ionized region rather than in the molecular cloud. It has the smallest fraction of infrared-excess stars of the clusters examined here, and hence was likely the earliest formed.
We thank Bruce Elmegreen and Zhiyun Li for helpful discussions on cluster structure and formation. We thank Travis Rector and Mark Heyer for kindly providing the KPNO MOSAIC images of the Rosette Nebula and the CO emission maps of the Rosette Complex, respectively. J.W. thanks C. Poulton for providing the full source catalog of Spitzer/IRAC 3.6m detections. This work was supported by Chandra X-ray Observatory grants GO1-2008X and GO3-4010X awarded to L.K.T. FLAMINGOS was designed and constructed by the IR instrumentation group (PI: R. Elston) at the University of Florida, Department of Astronomy with support from NSF grant AST97-31180 and Kitt Peak National Observatory. The data were collected under the NOAO Survey Program, “Towards a Complete Near-Infrared Spectroscopic Survey of Giant Molecular Clouds” (PI: E. Lada) and supported by NSF grants AST97-3367 and AST02-02976 to the University of Florida. E.A.L. also acknowledges support from NASA LTSA NNG05D66G. This publication makes use of data products from the Two Micron All Sky Survey, which is a joint project of the University of Massachusetts and the Infrared Processing and Analysis Center/California Institute of Technology, funded by NASA and the National Science Foundation. This research has made use of the SIMBAD database and the VizieR catalogue access tool, operated at CDS, Strasbourg, France.
References
- Alecian et al. (2008) Alecian, E., Wade, G. A., Catala, C., Bagnulo, S., Boehm, T., Bohlender, D., Bouret, J.-C., Donati, J.-F., Folsom, C. P., Grunhut, J., & Landstreet, J. D. 2008, A&A, 481, L99
- Allen (1996) Allen, L. 1996, PhD thesis, , University of Massachusetts, Amherst, MA, USA
- Allen et al. (2007) Allen, L., et al. 2007, Protostars and Planets V, ed. B. Reipurth, D. Jewitt, & K. Keil, 361
- Ballesteros-Paredes et al. (2007) Ballesteros-Paredes, J., Klessen, R. S., Mac Low, M.-M., & Vazquez-Semadeni, E. 2007, Protostars and Planets V, ed. B. Reipurth, D. Jewitt, & K. Keil, 63
- Bate et al. (2003) Bate, M. R., Bonnell, I. A., & Bromm, V. 2003, MNRAS, 339, 577
- Berghöfer & Christian (2002) Berghöfer, T. W. & Christian, D. J. 2002, A&A, 384, 890
- Bessell & Brett (1988) Bessell, M. S., & Brett, J. M. 1988, PASP, 100, 1134
- Bica et al. (2003) Bica, E., Dutra, C. M., Soares, J., & Barbuy, B. 2003, A&A, 404, 223
- Blaauw (1964) Blaauw, A. 1964, ARA&A, 2, 213
- Blitz & Thaddeus (1980) Blitz, L. & Thaddeus, P. 1980, ApJ, 241, 676
- Block et al. (1993) Block, D. L., Geballe, T. R., & Dyson, J. E. 1993, A&A, 273, L41+
- Bonnell et al. (2001) Bonnell, I. A., Bate, M. R., Clarke, C. J., & Pringle, J. E. 2001, MNRAS, 323, 785
- Bonnell & Davies (1998) Bonnell, I. A. & Davies, M. B. 1998, MNRAS, 295, 691
- Bouwman et al. (2006) Bouwman, J., Lawson, W. A., Dominik, C., Feigelson, E. D., Henning, T., Tielens, A. G. G. M., & Waters, L. B. F. M. 2006, ApJ, 653, L57
- Brand et al. (1994) Brand, J., Cesaroni, R., Caselli, P., Catarzi, M., Codella, C., Comoretto, G., Curioni, G. P., Curioni, P., di Franco, S., Felli, M., Giovanardi, C., Olmi, L., Palagi, F., Palla, F., Panella, D., Pareschi, G., Rossi, E., Speroni, N., & Tofani, G. 1994, A&AS, 103, 541
- Bronfman et al. (1996) Bronfman, L., Nyman, L.-A., & May, J. 1996, A&AS, 115, 81
- Broos et al. (2002) Broos, P., Townsley, L. K., Getman, K. V., & Bauer, F. 2002, ACIS Extract, An ACIS Point Source Extraction Package, Pennsylvania State University, http://www.astro.psu.edu/xray/docs/TARA/ae_users_guide.html
- Broos et al. (2007) Broos, P. S., Feigelson, E. D., Townsley, L. K., Getman, K. V., Wang, J., Garmire, G. P., Jiang, Z., & Tsuboi, Y. 2007, ApJS, 169, 353
- Calvet et al. (2000) Calvet, N., Hartmann, L., & Strom, S. E. 2000, Protostars and Planets IV, 377
- Carpenter (2000) Carpenter, J. M. 2000, AJ, 120, 3139
- Casertano & Hut (1985) Casertano, S. & Hut, P. 1985, ApJ, 298, 80
- Churchwell et al. (2004) Churchwell, E., Whitney, B. A., Babler, B. L., Indebetouw, R., Meade, M. R., Watson, C., Wolff, M. J., Wolfire, M. G., Bania, T. M., Benjamin, R. A., Clemens, D. P., Cohen, M., Devine, K. E., Dickey, J. M., Heitsch, F., Jackson, J. M., Kobulnicky, H. A., Marston, A. P., Mathis, J. S., Mercer, E. P., Stauffer, J. R., & Stolovy, S. R. 2004, ApJS, 154, 322
- Cox et al. (1990) Cox, P., Deharveng, L., & Leene, A. 1990, A&A, 230, 181
- Cutri et al. (2003) Cutri, R. M., Skrutskie, M. F., van Dyk, S., Beichman, C. A., Carpenter, J. M., Chester, T., Cambresy, L., Evans, T., Fowler, J., Gizis, J., Howard, E., Huchra, J., Jarrett, T., Kopan, E. L., Kirkpatrick, J. D., Light, R. M., Marsh, K. A., McCallon, H., Schneider, S., Stiening, R., Sykes, M., Weinberg, M., Wheaton, W. A., Wheelock, S., & Zacarias, N. 2003, 2MASS All Sky Catalog of point sources. (The IRSA 2MASS All-Sky Point Source Catalog, NASA/IPAC Infrared Science Archive. http://irsa.ipac.caltech.edu/applications/Gator/)
- Dale et al. (2007) Dale, J. E., Bonnell, I. A., & Whitworth, A. P. 2007, MNRAS, 375, 1291
- Diggle (2003) Diggle, P. 2003, Statistical Analysis of Spatial Point Patterns, 2nd Edition, Hodder Arnold Publication
- Droege et al. (2006) Droege, T. F., Richmond, M. W., Sallman, M. P., & Creager, R. P. 2006, PASP, 118, 1666
- Elmegreen (2000) Elmegreen, B. G. 2000, ApJ, 530, 277
- Elmegreen & Lada (1977) Elmegreen, B. G. & Lada, C. J. 1977, ApJ, 214, 725
- Evans (1967) Evans, D. S. 1967, in IAU Symposium, Vol. 30, Determination of Radial Velocities and their Applications, ed. A. H. Batten & J. F. Heard, 57
- Evans et al. (2003) Evans, II, N. J., Allen, L. E., Blake, G. A., Boogert, A. C. A., Bourke, T., Harvey, P. M., Kessler, J. E., Koerner, D. W., Lee, C. W., Mundy, L. G., Myers, P. C., Padgett, D. L., Pontoppidan, K., Sargent, A. I., Stapelfeldt, K. R., van Dishoeck, E. F., Young, C. H., & Young, K. E. 2003, PASP, 115, 965
- Feigelson et al. (2007) Feigelson, E., Townsley, L., Güdel, M., & Stassun, K. 2007, in Protostars and Planets V, ed. B. Reipurth, D. Jewitt, & K. Keil, 313
- Feigelson (1996) Feigelson, E. D. 1996, ApJ, 468, 306
- Feigelson et al. (2005) Feigelson, E. D., Getman, K., Townsley, L., Garmire, G., Preibisch, T., Grosso, N., Montmerle, T., Muench, A., & McCaughrean, M. 2005, ApJS, 160, 379
- Feigelson & Townsley (2008) Feigelson, E. D. & Townsley, L. K. 2008, ApJ, 673, 354
- Furlan et al. (2007) Furlan, E., et al. 2007, ApJ, 664, 1176
- Gagné et al. (2005) Gagné, M., Oksala, M. E., Cohen, D. H., Tonnesen, S. K., ud-Doula, A., Owocki, S. P., Townsend, R. H. D., & MacFarlane, J. J. 2005, ApJ, 628, 986
- Getman et al. (2007) Getman, K. V., Feigelson, E. D., Garmire, G., Broos, P., & Wang, J. 2007, ApJ, 654, 316
- Getman et al. (2008a) Getman, K. V., Feigelson, E. D., Lawson, W. A., Broos, P. S., & Garmire, G. P. 2008, ApJ, 673, 331
- Getman et al. (2008b) Getman, K. V., Feigelson, E. D., Broos, P. S., Micela, G., & Garmire, G. P. 2008, ApJ, 688, 418
- Getman et al. (2006) Getman, K. V., Feigelson, E. D., Townsley, L., Broos, P., Garmire, G., & Tsujimoto, M. 2006, ApJS, 163, 306
- Gregorio-Hetem et al. (1998) Gregorio-Hetem, J., Montmerle, T., Casanova, S., & Feigelson, E. D. 1998, A&A, 331, 193
- Grosso et al. (2005) Grosso, N., Feigelson, E. D., Getman, K. V., Townsley, L., Broos, P., Flaccomio, E., McCaughrean, M. J., Micela, G., Sciortino, S., Bally, J., Smith, N., Muench, A. A., Garmire, G. P., & Palla, F. 2005, ApJS, 160, 530
- Hamaguchi et al. (2005) Hamaguchi, K., Yamauchi, S., & Koyama, K. 2005, ApJ, 618, 360
- Hanson et al. (1993) Hanson, M. M., Geballe, T. R., Conti, P. S., & Block, D. L. 1993, A&A, 273, L44
- Harvey et al. (2006) Harvey, P. M., Chapman, N., Lai, S.-P., Evans, II, N. J., Allen, L. E., Jørgensen, J. K., Mundy, L. G., Huard, T. L., Porras, A., Cieza, L., Myers, P. C., Merín, B., van Dishoeck, E. F., Young, K. E., Spiesman, W., Blake, G. A., Koerner, D. W., Padgett, D. L., Sargent, A. I., & Stapelfeldt, K. R. 2006, ApJ, 644, 307
- Hensberge et al. (2000) Hensberge, H., Pavlovski, K., & Verschueren, W. 2000, A&A, 358, 553
- Heyer et al. (2006) Heyer, M. H., Williams, J. P., & Brunt, C. M. 2006, ApJ, 643, 956
- Kroupa (2002) Kroupa, P. 2002, Science, 295, 82
- Lada & Adams (1992) Lada, C. J., & Adams, F. C. 1992, ApJ, 393, 278
- Lada & Lada (2003) Lada, C. J. & Lada, E. A. 2003, ARA&A, 41, 57
- Lada et al. (1991) Lada, E. A., Evans, II, N. J., Depoy, D. L., & Gatley, I. 1991, ApJ, 371, 171
- Lada & Lada (1995) Lada, E. A. & Lada, C. J. 1995, AJ, 109, 1682
- Lehmer et al. (2005) Lehmer, B. D., et al. 2005, ApJS, 161, 21
- Li (2005) Li, J. Z. 2005, ApJ, 625, 242
- Li & Smith (2005) Li, J. Z. & Smith, M. D. 2005, ApJ, 620, 816
- Luo et al. (2008) Luo, B., et al. 2008, ApJS, 179, 19
- Mac Low & Klessen (2004) Mac Low, M.-M. & Klessen, R. S. 2004, Reviews of Modern Physics, 76, 125
- Maíz-Apellániz et al. (2004) Maíz-Apellániz, J., Walborn, N. R., Galué, H. Á., & Wei, L. H. 2004, ApJS, 151, 103
- Massey et al. (1995) Massey, P., Johnson, K. E., & Degioia-Eastwood, K. 1995, ApJ, 454, 151
- Meyer et al. (1997) Meyer, M. R., Calvet, N., & Hillenbrand, L. A. 1997, AJ, 114, 288
- Monet et al. (2003) Monet, D. G., Levine, S. E., Canzian, B., Ables, H. D., Bird, A. R., Dahn, C. C., Guetter, H. H., Harris, H. C., Henden, A. A., Leggett, S. K., Levison, H. F., Luginbuhl, C. B., Martini, J., Monet, A. K. B., Munn, J. A., Pier, J. R., Rhodes, A. R., Riepe, B., Sell, S., Stone, R. C., Vrba, F. J., Walker, R. L., Westerhout, G., Brucato, R. J., Reid, I. N., Schoening, W., Hartley, M., Read, M. A., & Tritton, S. B. 2003, AJ, 125, 984
- Morrison & McCammon (1983) Morrison, R. & McCammon, D. 1983, ApJ, 270, 119
- Neuhaeuser et al. (1995) Neuhaeuser, R., Sterzik, M. F., Schmitt, J. H. M. M., Wichmann, R., & Krautter, J. 1995, A&A, 297, 391
- Perez (1991) Perez, M. R. 1991, Revista Mexicana de Astronomia y Astrofisica, 22, 99
- Perryman et al. (1997) Perryman, M. A. C., Lindegren, L., Kovalevsky, J., Hoeg, E., Bastian, U., Bernacca, P. L., Crézé, M., Donati, F., Grenon, M., van Leeuwen, F., van der Marel, H., Mignard, F., Murray, C. A., Le Poole, R. S., Schrijver, H., Turon, C., Arenou, F., Froeschlé, M., & Petersen, C. S. 1997, A&A, 323, L49
- Petit et al. (2008) Petit, V., Wade, G. A., Drissen, L., Montmerle, T., & Alecian, E. 2008, MNRAS, L56
- Phelps & Lada (1997) Phelps, R. L. & Lada, E. A. 1997, ApJ, 477, 176
- Poulton et al. (2008) Poulton, C. J., Robitaille, T. P., Greaves, J. S., Bonnell, I. A., Williams, J. P., & Heyer, M. H. 2008, MNRAS, 132
- Preibisch et al. (2005) Preibisch, T., Kim, Y.-C., Favata, F., Feigelson, E. D., Flaccomio, E., Getman, K., Micela, G., Sciortino, S., Stassun, K., Stelzer, B., & Zinnecker, H. 2005, ApJS, 160, 401
- Preibisch & Zinnecker (2007) Preibisch, T. & Zinnecker, H. 2007, in IAU Symposium, Vol. 237, IAU Symposium, ed. B. G. Elmegreen & J. Palous, 270
- Prisinzano et al. (2008) Prisinzano, L., Micela, G., Flaccomio, E., Stauffer, J. R., Megeath, T., Rebull, L., Robberto, M., Smith, K., Feigelson, E. D., Grosso, N., & Wolk, S. 2008, ApJ, 677, 401
- Román-Zúñiga et al. (2008a) Román-Zúñiga, C. G., Elston, R., Ferreira, B., & Lada, E. A. 2008a, ApJ, 672, 861
- Román-Zúñiga et al. (2008b) Román-Zúñiga, C. G., Lada, E. A., & Elston, R. 2008b, Handbook of Star Forming Regions, Vol. I: The Northern Hemisphere, ed. B. Reipurth, in press, astro-ph/0910.0931
- Sanchawala et al. (2007) Sanchawala, K., Chen, W.-P., Lee, H.-T., Chu, Y.-H., Nakajima, Y., Tamura, M., Baba, D., & Sato, S. 2007, ApJ, 656, 462
- Siess et al. (2000) Siess, L., Dufour, E., & Forestini, M. 2000, A&A, 358, 593
- Skinner et al. (2006) Skinner, S., Güdel, M., Schmutz, W., & Zhekov, S. 2006, Ap&SS, 304, 97
- Smith et al. (2001) Smith, R. K., Brickhouse, N. S., Liedahl, D. A., & Raymond, J. C. 2001, ApJ, 556, L91
- Stelzer et al. (2007) Stelzer, B., Flaccomio, E., Briggs, K., Micela, G., Scelsi, L., Audard, M., Pillitteri, I., & Güdel, M. 2007, A&A, 468, 463
- Stelzer et al. (2006) Stelzer, B., Micela, G., Hamaguchi, K., & Schmitt, J. H. M. M. 2006, A&A, 457, 223
- Strom et al. (1993) Strom, K. M., Strom, S. E., & Merrill, K. M. 1993, ApJ, 412, 233
- Tan et al. (2006) Tan, J. C., Krumholz, M. R., & McKee, C. F. 2006, ApJ, 641, L121
- Telleschi et al. (2007) Telleschi, A., Güdel, M., Briggs, K. R., Audard, M., & Palla, F. 2007, A&A, 468, 425
- Townsley et al. (2006) Townsley, L. K., Broos, P. S., Feigelson, E. D., Brandl, B. R., Chu, Y.-H., Garmire, G. P., & Pavlov, G. G. 2006, AJ, 131, 2140
- Townsley et al. (2003) Townsley, L. K., Feigelson, E. D., Montmerle, T., Broos, P. S., Chu, Y.-H., & Garmire, G. P. 2003, ApJ, 593, 874
- Vuong et al. (2003) Vuong, M. H., Montmerle, T., Grosso, N., Feigelson, E. D., Verstraete, L., & Ozawa, H. 2003, A&A, 408, 581
- Walborn (1973) Walborn, N. R. 1973, AJ, 78, 1067
- Walter et al. (1988) Walter, F. M., Brown, A., Mathieu, R. D., Myers, P. C., & Vrba, F. J. 1988, AJ, 96, 297
- Wang et al. (2007) Wang, J., Townsley, L. K., Feigelson, E. D., Getman, K. V., Broos, P. S., Garmire, G. P., & Tsujimoto, M. 2007, ApJS, 168, 100
- Wang et al. (2008) Wang, J., Townsley, L. K., Feigelson, E. D., Getman, K. V., Broos, P. S., Roman-Zuniga, C. G., & Lada, E. A. 2008, ApJ, 675, 464
- Weisskopf et al. (2002) Weisskopf, M. C., Brinkman, B., Canizares, C., Garmire, G., Murray, S., & Van Speybroeck, L. P. 2002, PASP, 114, 1
- Whitworth et al. (1994) Whitworth, A. P., Bhattal, A. S., Chapman, S. J., Disney, M. J., & Turner, J. A. 1994, MNRAS, 268, 291
- Wilking & Lada (1983) Wilking, B. A. & Lada, C. J. 1983, ApJ, 274, 698
- Williams & Blitz (1998) Williams, J. P. & Blitz, L. 1998, ApJ, 494, 657
- Williams et al. (1995) Williams, J. P., Blitz, L., & Stark, A. A. 1995, ApJ, 451, 252
- Wolf et al. (1990) Wolf, G. A., Lada, C. J., & Bally, J. 1990, AJ, 100, 1892
- Wolk et al. (2006) Wolk, S. J., Spitzbart, B. D., Bourke, T. L., & Alves, J. 2006, AJ, 132, 1100
- Wolk et al. (2008) Wolk, S. J., Spitzbart, B. D., Bourke, T. L., Gutermuth, R. A., Vigil, M., & Comerón, F. 2008, AJ, 135, 693
- Wu et al. (2006) Wu, Y., Zhang, Q., Yu, W., Miller, M., Mao, R., Sun, K., & Wang, Y. 2006, A&A, 450, 607
- Ybarra & Phelps (2004) Ybarra, J. E. & Phelps, R. L. 2004, AJ, 127, 3444
- Young et al. (2005) Young, K. E., Harvey, P. M., Brooke, T. Y., Chapman, N., Kauffmann, J., Bertoldi, F., Lai, S.-P., Alcalá, J., Bourke, T. L., Spiesman, W., Allen, L. E., Blake, G. A., Evans, II, N. J., Koerner, D. W., Mundy, L. G., Myers, P. C., Padgett, D. L., Salinas, A., Sargent, A. I., Stapelfeldt, K. R., Teuben, P., van Dishoeck, E. F., & Wahhaj, Z. 2005, ApJ, 628, 283
| Source | Position | Extracted Counts | Characteristics | ||||||||||||||||
|---|---|---|---|---|---|---|---|---|---|---|---|---|---|---|---|---|---|---|---|
| RMCX | CXOU J | Err | Net | Net | Bkgd | Net | PSF | Signif | Anom | Var | EffExp | ||||||||
| # | (deg) | (deg) | (″) | (′) | Full | Full | Full | Hard | Frac | (ks) | (keV) | ||||||||
| (1) | (2) | (3) | (4) | (5) | (6) | (7) | (8) | (9) | (10) | (11) | (12) | (13) | (14) | (15) | (16) | (17) | |||
| 1 | 063232.43043705.7 | 98.135158 | 4.618251 | 0.7 | 6.0 | 7.5 | 3.4 | 0.5 | 6.7 | 0.91 | 1.9 | -5 | g… | 9.8 | 3.9 | ||||
| 3 | 063236.58043611.4 | 98.152431 | 4.603172 | 0.9 | 6.6 | 6.2 | 3.2 | 0.8 | 4.4 | 0.89 | 1.6 | -4.6 | …. | a | 17.9 | 2.6 | |||
| 4 | 063238.08043250.1 | 98.158706 | 4.547265 | 1.2 | 9.9 | 16.8 | 4.9 | 2.2 | 0.6 | 0.91 | 3.1 | -5 | g… | 10.6 | 1.3 | ||||
| 5 | 063239.50043628.9 | 98.164603 | 4.608042 | 0.6 | 6.3 | 12.3 | 4.1 | 0.7 | 3.5 | 0.90 | 2.6 | -5 | …. | a | 18.0 | 1.8 | |||
| 6 | 063239.51043124.9 | 98.164639 | 4.523587 | 1.2 | 9.9 | 11.7 | 4.4 | 3.3 | 3.9 | 0.91 | 2.3 | -5 | …. | a | 16.2 | 1.9 | |||
| 7 | 063240.73043653.3 | 98.169734 | 4.614833 | 0.5 | 5.9 | 14.4 | 4.4 | 0.6 | 9.6 | 0.90 | 2.9 | -5 | …. | a | 18.1 | 3.1 | |||
| 8 | 063242.33043217.9 | 98.176413 | 4.538329 | 1.3 | 9.0 | 7.0 | 3.5 | 2.0 | 6.7 | 0.90 | 1.7 | -3.6 | …. | a | 17.3 | 3.6 | |||
| 9 | 063245.25043206.5 | 98.188575 | 4.535152 | 0.7 | 8.4 | 21.4 | 5.3 | 1.6 | 1.9 | 0.90 | 3.6 | -5 | …. | c | 17.5 | 0.8 | |||
| 10 | 063246.11043612.9 | 98.192141 | 4.603596 | 0.8 | 7.3 | 10.8 | 4.1 | 2.2 | 7.7 | 0.90 | 2.3 | -5 | …. | a | 35.3 | 2.4 | |||
| 11 | 063246.72043831.4 | 98.194699 | 4.642082 | 0.5 | 4.5 | 5.8 | 3.0 | 0.2 | 0.8 | 0.89 | 1.6 | -5 | …. | a | 18.5 | 1.4 | |||
Note. — Table 1 is published in its entirety in the electronic edition of the Astrophysical Journal. A portion is shown here for guidance regarding its form and content.
Note. — Column 1: X-ray source sequence number, sorted by RA. denotes the sources included in the complete sample of X-ray detections after sensitivity correction (see § 4.3). Column 2: IAU designation. Columns 3,4: Right ascension and declination for epoch J2000.0. Column 5: Estimated random position error computed as the standard deviation of the local PSF inside extraction region divided by the square root of the extracted counts. Column 6: Off-axis angle in arcminutes Columns 7,8: Estimated net counts extracted in the total energy band (0.5 8 keV), and the average of its Poisson upper and lower error (including background contribution). Column 9: Background counts extracted (total band). Column 10: Estimated net counts extracted in the hard energy band (2 8 keV). Column 11: Fraction of the PSF (at 1.497 keV) enclosed within the extraction region. A PSF fraction significantly below 90% usually indicates that the source lies in a crowded region. Column 12: Photometric significance computed as the ratio of the net counts to the upper error on net counts. Column 13: Log probability that extracted counts (total band) are solely from background based on Poisson statistics. Some sources have values above the 0.1% threshold that defines the catalog because local background estimates can rise during the final extraction iteration. Column 14: Source anomalies: g = fractional time that source was on a detector (FRACEXPO from mkarf) is ; e = source on field edge; p = source piled up; s = source on readout streak. Column 15: Variability characterization based on the Kolmogorov-Smirnov statistic (total band): a = no evidence for variability (); b = possibly variable (); c = definitely variable (). No value is reported for sources with fewer than 4 counts or for sources in chip gaps or on field edges. Column 16: Effective exposure time: approximate time the source would have to be observed on-axis to obtain the reported number of counts. Column 17: Background-corrected median photon energy (total band).
| Source | Position | Extracted Counts | Characteristics | ||||||||||||||||
|---|---|---|---|---|---|---|---|---|---|---|---|---|---|---|---|---|---|---|---|
| RMCX | CXOU J | Err | Net | Net | Bkgd | Net | PSF | Signif | Anom | Var | EffExp | ||||||||
| # | (deg) | (deg) | (″) | (′) | Full | Full | Full | Hard | Frac | (ks) | (keV) | ||||||||
| (1) | (2) | (3) | (4) | (5) | (6) | (7) | (8) | (9) | (10) | (11) | (12) | (13) | (14) | (15) | (16) | (17) | |||
| 2 | 063232.91043437.2 | 98.137138 | 4.577017 | 1.4 | 8.4 | 5.9 | 3.4 | 2.1 | 0.6 | 0.90 | 1.5 | -2.8 | g… | 13.0 | 0.7 | ||||
| 12 | 063247.43043150.2 | 98.197650 | 4.530632 | 1.3 | 7.9 | 4.5 | 3.0 | 1.5 | 4.0 | 0.90 | 1.2 | -2.3 | …. | a | 17.6 | 2.1 | |||
| 16 | 063249.22043425.9 | 98.205124 | 4.573882 | 1.1 | 7.8 | 4.9 | 3.4 | 3.1 | 3.7 | 0.90 | 1.2 | -1.8 | …. | a | 33.1 | 7.8 | |||
| 26 | 063254.45043724.6 | 98.226879 | 4.623523 | 0.9 | 6.3 | 4.6 | 3.0 | 1.4 | 3.1 | 0.90 | 1.3 | -2.6 | …. | 35.6 | 3.4 | ||||
| 29 | 063255.82043419.1 | 98.232618 | 4.571979 | 1.1 | 7.2 | 5.2 | 3.4 | 2.8 | 0.0 | 0.89 | 1.3 | -2.1 | …. | a | 34.6 | 1.3 | |||
| 33 | 063258.15043003.7 | 98.242303 | 4.501051 | 1.1 | 6.6 | 3.3 | 2.5 | 0.7 | 3.5 | 0.89 | 1.1 | -2.3 | …. | a | 15.9 | 5.2 | |||
| 36 | 063300.61043030.7 | 98.252556 | 4.508536 | 0.9 | 5.9 | 3.5 | 2.5 | 0.5 | 0.0 | 0.90 | 1.1 | -2.7 | …. | a | 17.6 | 1.3 | |||
| 53 | 063308.34044203.4 | 98.284762 | 4.700962 | 1.0 | 7.3 | 4.6 | 3.2 | 2.4 | 2.4 | 0.89 | 1.2 | -1.9 | …. | a | 33.9 | 1.6 | |||
| 57 | 063308.52043634.3 | 98.285532 | 4.609538 | 0.3 | 4.0 | 4.7 | 3.0 | 1.3 | 0.0 | 0.90 | 1.3 | -2.7 | g… | 23.3 | 0.9 | ||||
| 58 | 063309.33043804.3 | 98.288891 | 4.634532 | 1.1 | 6.1 | 6.9 | 3.7 | 3.1 | 5.9 | 0.89 | 1.6 | -2.8 | …. | a | 35.4 | 3.3 | |||
Note. — Table 2 is published in its entirety in the electronic edition of the Astrophysical Journal. A portion is shown here for guidance regarding its form and content. The column descriptions are the same as in Table 1.
| RMCXaa For convenience columns 1 4 reproduce the source identification, net counts, and photometric significance data from Table 1. | Spectral Fitbb All spectral fits used the “wabs(apec)” model in XSPEC and assumed 0.3 abundances. Columns 5 and 6 present the best-fit values for the column density and plasma temperature parameters. Column 7 presents the emission measure for the model spectrum, assuming a distance of 1.4 kpc. Quantities in italics were frozen in the fit. Uncertainties represent 90% confidence intervals. More significant digits are used for uncertainties in order to avoid large rounding errors; for consistency, the same number of significant digits is used for both lower and upper uncertainties. Uncertainties are omitted when XSPEC was unable to compute them or when their values were so large that the parameter is effectively unconstrained. Fits lacking uncertainties should be considered to merely be a spline fit to the data to obtain rough estimates of luminosities; their spectral parameter values are unreliable. | X-ray Luminositiescc X-ray luminosities are presented in columns 8 12: s = soft band (0.5 2 keV); h = hard band (2 8 keV); t = total band (0.5 8 keV). Absorption-corrected luminosities are subscripted with a ; they are omitted when cm-2 since the soft band emission is essentially unmeasurable. | Notesdd 2T means a two-temperature model was used. Well-known counterparts from Table 4 are listed here for the convenience of the reader. | ||||||||||||
|---|---|---|---|---|---|---|---|---|---|---|---|---|---|---|---|
| Seq | CXOU J | Net | Signif | ||||||||||||
| Cts | (cm-2) | (keV) | (cm-3) | (ergs s-1) | |||||||||||
| (1) | (2) | (3) | (4) | (5) | (6) | (7) | (8) | (9) | (10) | (11) | (12) | (13) | |||
| 5 | 063239.50043628.9 | 12.3 | 2.6 | 21.8 | 2.2 | 53.4 | 29.67 | 29.98 | 30.02 | 30.15 | 30.42 | ||||
| 6 | 063239.51043124.9 | 11.7 | 2.3 | 22.1 | 2.0 | 53.7 | 29.72 | 30.14 | 30.21 | 30.28 | 30.65 | ||||
| 7 | 063240.73043653.3 | 14.4 | 2.9 | 22.2 | 7.0 | 53.6 | 29.48 | 30.48 | 30.55 | 30.52 | 30.75 | ||||
| 9 | 063245.25043206.5 | 21.4 | 3.6 | 20.0 | 0.2 | 53.8 | 30.45 | 27.47 | 27.47 | 30.45 | 30.48 | ||||
| 10 | 063246.11043612.9 | 10.8 | 2.3 | 22.1 | 3.5 | 53.3 | 29.28 | 29.98 | 30.05 | 30.06 | 30.34 | ||||
| 14 | 063248.65043404.4 | 14.6 | 2.7 | 20.0 | 1.2 | 52.9 | 29.77 | 29.10 | 29.10 | 29.85 | 29.86 | ||||
| 17 | 063249.80043641.9 | 10.2 | 2.2 | 22.2 | 3.4 | 53.2 | 29.07 | 29.91 | 30.00 | 29.97 | 30.29 | ||||
| 18 | 063251.19043412.1 | 29.9 | 4.4 | 21.9 | 1.7 | 53.7 | 29.86 | 30.02 | 30.07 | 30.24 | 30.60 | ||||
| 21 | 063251.73043621.4 | 10.4 | 2.3 | 22.7 | 2.0 | 53.8 | 30.06 | 30.32 | 30.08 | ||||||
| 22 | 063252.30043744.3 | 15.1 | 2.9 | 22.1 | 4.0 | 53.3 | 29.36 | 30.10 | 30.16 | 30.17 | 30.43 | ||||
Note. — Table 3 is published in its entirety in the electronic edition of the Astrophysical Journal. A portion is shown here for guidance regarding its form and content.
| X-ray Source | Optical/Infrared Counterpart and Photometry | ||||||||||||
|---|---|---|---|---|---|---|---|---|---|---|---|---|---|
| RMCX | CXOU J | USNO B1.0 | B | R | I | 2MASS | FLAMINGOS | J | H | K | 2MASS | Spitzer/IRAC | |
| (mag) | (mag) | (mag) | ID | ID | (mag) | (mag) | (mag) | PhCcFlg | 3.6m | ||||
| (1) | (2) | (3) | (4) | (5) | (6) | (7) | (8) | (9) | (10) | (11) | (12) | (13) | |
| 1 | 063232.43043705.7 | ||||||||||||
| 2 | 063232.91043437.2 | ||||||||||||
| 3 | 063236.58043611.4 | ||||||||||||
| 4 | 063238.08043250.1 | 09450095483 | 14.54 | ||||||||||
| 5 | 063239.50043628.9 | 063239043629 | 14.69 | 13.45 | 12.54 | ||||||||
| 6 | 063239.51043124.9 | ||||||||||||
| 7 | 063240.73043653.3 | ||||||||||||
| 8 | 063242.33043217.9 | ||||||||||||
| 9 | 063245.25043206.5 | 09450095525 | 18.41 | 16.59 | 14.86 | 063245260432074 | 063245043207 | 13.68 | 12.99 | 12.79 | AAA000 | ||
| 10 | 063246.11043612.9 | 063246043610 | 14.69 | 14.29 | 14.06 | ||||||||
Note. — Table 4 with complete notes is published in its entirety in the electronic edition of the Astrophysical Journal. A portion is shown here for guidance regarding its form and content.
Note. — Columns 1 2 reproduce the sequence number and source identification from Table 1 and Table 2. For convenience, [MJD95]=Massey, Johnson, & Degioia-Eastwood (1995), [BC02]=Berghöfer & Christian (2002), [TASS4]=TASS Mark IV Photometric Survey of the Northern Sky (Droege et al., 2006), [VGK85]=Voroshilov et al. (1985), [BGD93]=Block, Geballe, & Dyson (1993), [MSX]=the complete MSX6C catalogue in the Galactic Plane.
| X-ray structure | IR structure | ||||||
|---|---|---|---|---|---|---|---|
| RMC | R.A. | Dec. | Extent | ||||
| Struc | (J2000) | (J2000) | |||||
| XA | 06:32:38 | 04:46:18 | |||||
| XA1 | 06:32:24 | +04:50:30 | 062970453 | ||||
| XA2 | 06:32:25 | +04:39:00 | |||||
| XA3 | 06:32:38 | +04:46:18 | |||||
| XB | 06:33:15 | +04:35:11 | |||||
| XB1 | 06:32:54 | +04:37:00 | |||||
| XB2 | 06:33:14 | +04:31:30 | C | ||||
| XB3 | 06:33:15 | +04:35:11 | PL 2 | 063060437 | |||
| XC | 06:34:12 | +04:28:15 | |||||
| XC1 | 06:34:12 | +04:28:15 | PL 4 | E | 063140427 | ||
| XC2 | 06:34:24 | +04:22:00 | PL 5, REFL 8 | E | 063170426 | ||
| X-ray population | NIR pop | MIR pop | ||||||||||
|---|---|---|---|---|---|---|---|---|---|---|---|---|
| RMC | ||||||||||||
| Struc | Total | |||||||||||
| 1 | 2 | 3 | 4 | 5 | 6 | 7 | 8 | 9 | 10 | 11 | ||
| XA | 91 | 27 | 30% | 300 | 61 | 6 | 10% | 2% | 32 | 11% | ||
| XA1 | 6 | 2 | 33% | 20 | 3 | 0 | 0% | 0% | 2 | 6% | ||
| XA2 | 4 | 1 | 25% | 15 | 3 | 0 | 0% | 0% | 0 | 0% | ||
| XA3 | 29 | 5 | 17% | 100 | 23 | 4 | 17% | 4% | 11 | 11% | ||
| XB | 52 | 24 | 46% | 200 | 37 | 8 | 22% | 4% | 16 | 8% | ||
| XB1 | 11 | 6 | 55% | 40 | 5 | 0 | 0% | 0% | 0 | 0% | ||
| XB2 | 5 | 4 | 80% | 20 | 3 | 1 | 33% | 5% | 8 | 40% | ||
| XB3 | 14 | 7 | 50% | 20 | 11 | 4 | 36% | 20% | 1 | 5% | ||
| XC | 160 | 66 | 41% | 800 | 131 | 9 | 7% | 1% | 62 | 8% | ||
| XC1 | 67 | 22 | 33% | 340 | 57 | 5 | 9% | 1% | 17 | 5% | ||
| XC2 | 17 | 13 | 76% | 90 | 14 | 1 | 7% | 1% | 16 | 18% | ||
| Distributed | 250 | 105 | 42% | 1100 | ||||||||
Note. — Column 1: X-ray region defined in Table 5. The Distributed values represent the total sources in the X-ray fields minus those in the X-ray regions.
Column 2: = Number of X-ray sources in the region defined by the contours in Figure 6 and
Column 3: = Number of hard X-ray sources ( keV) contained in the region
Column 4: = Fraction of hard X-ray stars with respect to all X-ray stars.
Column 5: = Estimated total stellar population in the region based on the X-ray sample; see §2.3
Column 6: = Number of NIR stars in the X-ray region from Román-Zúñiga et al. (2008a)
Column 7: = Number of -band excess disky stars in the X-ray region from Román-Zúñiga et al. (2008a)
Column 8: = Fraction of -band excess disky stars with respect to the NIR sample in the X-ray region
Column 9: = Fraction of -band excess disky stars with respect to the estimated total stellar population in the X-ray region
Column 10: = Number of MIR-band excess disky stars in the X-ray region from Poulton et al. (2008)
Column 11: = = Fraction of MIR-band excess disky stars with respect to the estimated total stellar population in the X-ray region